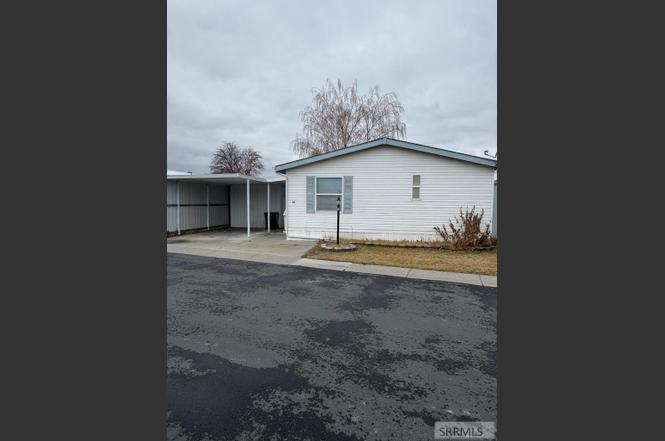
850 Parkway Dr #32 · Blackfoot, ID
Flood risk 1/10 · Minimal
- FEMA flood zone
- X
- Chance of flooding over 30 yrs
- 0.0%
- Est. flood insurance / yr
- $473 – $860
Fire risk 1/10 · Minimal
- Est. fire insurance / yr
- $584 – $1,086
Heat risk 3/10 · Minor
- Hot days now (above 92°F)
- 7 days/yr
- Hot days in 30 yrs
- 17 days/yr
Wind risk 1/10 · Minimal
- Chance of severe wind over 30 yrs
- —
Air-quality risk 5/10 · Moderate
- Unhealthy air days now
- 8 days/yr
- Unhealthy air days in 30 yrs
- 8 days/yr
Risk factors via First Street. Map © Google.
Why this score? — see what drove the B- grade
The composite is a weighted blend of 9 inputs, each scored 0–100. Each bar is that input's sub-score; the figure is the points it added to the 100-point composite (weight × sub-score).
- Cash flow +30.0/30.0
- DSCR +10.0/10.0
- 1% rule +9.2/10.0
- ARV discount +7.5/15.0
- Livability +4.2/5.0
- Schools +3.3/10.0
- Rent growth +2.5/5.0
- Condition / age +2.2/5.0
- Appreciation +0.0/10.0
$95,000
🖨 Deal sheet (PDF) 📄 Offer letter ✓ Due diligence
Listing remarks
Well kept manufactured home in Parkside Mobile Estates. This home has been freshly painted and features a spacious master with walk in closet, attached bath with shower and soaker tub. A large dining area and bright living room. The well established yard has a full sprinkler system and flower beds. One single carport and two exterior storage sheds!
Key facts
- Bright living room
- Walk in closet
- Attached bath
Tags
Property features AI
Exterior
- Utilities: Public water; Public sewer; Natural gas available
- Home design: Manufactured home (without land); Single level / 1 story
- Construction: Vinyl siding
- Exterior features: Shed(s)
Interior
- Kitchen: Dishwasher; Microwave; Refrigerator
- Flooring: Carpet; Laminate
- Bathrooms: 2 full bathrooms
- Heating & cooling: Heat pump; Electric heating; Forced air; Ceiling fan(s)
- Interior features: Walk-in closet(s)
Neighborhood map
What this means for you Summary
Snapshot
- This is a 3-bed/2.0-bath manufactured listed at $95k. Condition is rated fair.
Deal economics
- At list price, monthly cash flow is $410 ($5k/yr) — positive.
- The deal already cash-flows at list — no discount required.
- Meets the 1% rule at list price ($1k rent vs $95k).
- Recommended offer: $84k (12.0% below list) — sets the bar for market timing.
Location & tenants
- Location reads 83/100 on livability (#8 in ID, #904 nationally) — a professional / high-income tenant draw. Strengths: commute A+, cost of living A+, housing A+; Watch: amenities F.
- Blackfoot District (town): math 34% / reading 45% proficiency, ranked #69 of 92 in ID (top 75%) — families likely to look elsewhere, expect single-tenant / working-renter base with shorter leases.
- Zoned schools: Ridge Crest Elementary School (math 47% / reading 47%, grade D-, #176 of 357 statewide, top 53%, 374 students, 51% FRL); Mountain View Middle School (math 33% / reading 46%, grade F, #72 of 109 statewide, top 67%, 588 students, 47% FRL); Blackfoot High School (math 26% / reading 47%, grade F, #105 of 169 statewide, top 63%, 1,286 students, 40% FRL) — zoned schools at 46% FRL track the district average.
- Market conditions: 282 active listings in the ZIP; solid renter incomes; 251 units permitted in Bingham County in 2024 (0 in 5+ unit buildings).
Forward outlook
- Local home prices are declining (-3.0%/yr); year-one equity from $657 of loan paydown is wiped out by about $3k of value loss. Plan a longer hold.
- Bingham County population projected at -23% by 2050 — secular population decline; favor cash flow + early exit over multi-decade hold.
- At projected returns (-3.0% appreciation + 3.0% rent growth), your $27k cash investment doubles in ~7 years — after that, you're playing with house money.
Negotiation context
- It's been on market 126 days — a 12% lower offer ($84k) is reasonable based on typical stale-listing flexibility.
Questions for the listing agent
- It's been on market 126 days. Have you received any prior offers? Is the seller open to a 12% concession, seller financing, or rate buy-down credit?
- Have any recent inspections been done? Can we get a copy of the seller's disclosures and any deferred-maintenance estimates?
- Why hasn't it sold? Are there any deal-killer items the seller is aware of (foundation, flood, title, zoning, code violations)?
- Is there a deadline driving the sale (1031 exchange, divorce, estate, relocation)? That informs how much negotiation room exists.
- What's the average days-on-market for RENTAL listings here right now (not sales)? A rising rental-DOM trend means longer vacancies and softer asking-rent achievability than the comps imply.
- What's the recent tenant-quality profile in this submarket — average credit score on applications, eviction rate, late-payment / NSF rate, and stable-employment percentage? A property-management company in the area should have these aggregated.
- How much new for-sale + rental construction is in the pipeline within 1–3 miles? Heavy new supply typically softens prices + rents 12–24 months out; constrained supply supports both.
Investment metrics
- 1% rule
- 1.42% ✓
- Cap rate
- 11.47%
- Cash-on-cash
- 18.49%
- DSCR
- 1.82
- GRM
- 5.9
CMA / ARV
No comps found within radius.
Projected returns pro-forma
-3.0% appreciation · 3.0% rent growth · sell at horizon
- IRR
- 10.2%
- Equity multiple
- 1.40×
- Total profit
- $10,727
- Equity at exit
- $14,165
- IRR
- 19.3%
- Equity multiple
- 2.62×
- Total profit
- $43,032
- Equity at exit
- $8,214
Cash invested: $26,600 (down + closing). Projections, not guarantees.
Landlord ↔ Tenant lean methodology
- Overall (STATE)
- 91 Strongly Landlord-Friendly
- State Idaho
- 91 Strongly Landlord-Friendly · R+18
- County
- — inherits STATE
- City
- — inherits STATE
ZIP-level market 83221
- Active inventory
- 282
- Price-to-rent
- 5.9×
Monthly cashflow live
- Estimated rent
- $1,350 medium interval (Pro) →
- Mortgage (P&I)
- −$498
- Tax est. 1.5%
- −$119 /mo · $1,425/yr
- Insurance
- −$40
- HOA
- −$0
- Vacancy / Maint / Mgmt
- −$283
- Net cashflow
- $410
Break-even live
Sensitivity live
| Price | -10% $475 | -5% $443 | +0% $410 | +5% $377 | +10% $344 |
|---|---|---|---|---|---|
| Rent | -10% $303 | -5% $356 | +0% $410 | +5% $463 | +10% $516 |
| Rate | -1.0pp $458 | -0.5pp $434 | base $410 | +0.5pp $385 | +1.0pp $360 |
UW: 25.0% down · 7.5% · 30yr · 1.5% tax · 5.0% vac · 8.0% maint · 8.0% mgmt
Financing live
Cash to close
- Down payment
- $23,750
- Closing costs
- $2,850
- Reserves months
- —
- Total cash needed
- —
Loan-product check · same deal, 3 products live
Conventional
25% down · 7.5% · 30yr
- Down + closing
- —
- Monthly P&I
- —
- Monthly cashflow
- —
- DSCR
- —
- Eligible?
- —
Personal DTI + credit; lowest rate.
DSCR
20% down · 8.5% · 30yr
- Down + closing
- —
- Monthly P&I
- —
- Monthly cashflow
- —
- DSCR
- —
- Eligible?
- —
No personal income docs; deal must DSCR.
Hard money
10% down · 12.0% · 12mo
- Down + closing
- —
- Monthly P&I
- —
- Monthly cashflow
- —
- DSCR
- —
- Eligible?
- —
Short-term bridge; refi at stabilization.
Listing history 18 events
-
2026-06-19days on market $95,000 Active 126 DOM
-
2026-06-18days on market $95,000 Active 125 DOM
-
2026-06-17days on market $95,000 Active 124 DOM
-
2026-06-16days on market $95,000 Active 123 DOM
-
2026-06-15days on market $95,000 Active 122 DOM
-
2026-06-14days on market $95,000 Active 120 DOM
-
2026-06-12days on market $95,000 Active 119 DOM
-
2026-06-09days on market $95,000 Active 116 DOM
-
2026-06-08days on market $95,000 Active 115 DOM
-
2026-06-07days on market $95,000 Active 114 DOM
-
2026-06-05days on market $95,000 Active 111 DOM
-
2026-06-03days on market $95,000 Active 110 DOM
-
2026-06-02days on market $95,000 Active 109 DOM
-
2026-06-01days on market $95,000 Active 108 DOM
-
2026-05-31days on market $95,000 Active 107 DOM
-
2026-05-30days on market $95,000 Active 106 DOM
-
2026-04-06price $105,000
-
2026-02-14$115,000 Active
ⓘ Source: listings_history table (triggers on properties + properties_extension) + one-shot
backfill from property_details.listing_events for pre-trigger history.
Climate risk First Street
- Flood 1/10 Low FEMA zone X · 0% chance over 30 yrs
- Wildfire 1/10 Low
- Heat 3/10 Moderate 7 d/yr ≥92°F today · 17 d/yr by 30 yrs out
- Wind 1/10 Low
- Air quality 5/10 Major 8 unhealthy d/yr today · 8 by 30 yrs out
Nearby sold comps map
Loading sold comps map…
Walkable amenities ~0.75 mi
Loading nearby amenities…
Taxation est. · year 1
- Rental income
- $16,197
- − Mortgage interest
- −$5,321
- − Property taxes
- −$1,425
- − Insurance
- −$475
- − Repairs & maintenance
- −$1,296
- − Management
- −$1,296
- − Depreciation
- −$2,764
- Taxable income
- $3,621
- Est. tax owed @ 24.0%
- −$869
- After-tax cash flow
- $4,049/yr
For passive investors: Depreciation is non-cash, so a rental often shows a tax loss while cash-flowing — sheltering income. Rental losses are passive: they offset passive income freely, and up to $25,000/yr can offset ordinary (W-2) income if you actively participate and your MAGI is under $100k (phasing out to $0 by $150k); unused losses carry forward. On sale, claimed depreciation is recaptured at up to 25%, and gains may owe capital-gains tax (a 1031 exchange can defer both). Figures are a year-1 estimate at your 24.0% rate — not tax advice; consult a CPA.
Condition & rehab AI · 13 photos
A well-maintained manufactured home with average condition, requiring minor repairs and cleaning to enhance its resale and rental value.
Repairs flagged
- Minor ceiling fans — need cleaning or replacement
- Minor light fixtures — need cleaning or replacement
Value-add opportunities
- Resale painting — enhances curb appeal and interior aesthetics
- Both cleaning — improves overall appearance and functionality
- Resale upgrading light fixtures — modernizes the home and improves energy efficiency
Renovation cost estimate screening
| Repair item | Severity | Est. cost |
|---|---|---|
| ceiling fans · need cleaning or replacement | Minor | $500–3,000 |
| light fixtures · need cleaning or replacement | Minor | $500–3,000 |
| Total estimated repair cost · 2 items | $1,000–6,000 |
Value-add ROI direction
- Resale painting — enhances curb appeal and interior aesthetics ↑
- Both cleaning — improves overall appearance and functionality ↑
- Resale upgrading light fixtures — modernizes the home and improves energy efficiency ↑
ⓘ Cost ranges are severity-bucket heuristics (US national rule-of-thumb). Get contractor quotes + a written scope before underwriting a rehab budget.
Schools (NCES district)
- District
- Blackfoot District
- NCES district ID
- 1600270
- Math proficiency
- 34% ▼ -4.00%
- Reading proficiency
- 45% ▲ 1.00%
- Median HH income
- $43,903
- Composite
- 33.46/100
- National rank
- #5455
- State rank
- #69 of 92 in ID
Livability — Blackfoot
- Score
- 83/100
- State rank
- #8
- US rank
- #904
Category grades
Schools grade is shown separately in the Schools card above.
Census & demographics
- Census place
- Blackfoot, ID
- County
- Bingham County · 29,081 people
- City population
- 29,081
- Metro
- Blackfoot, ID
- Population (ZIP)
- 29,081
- Household income
- $75,172
- Rent vs Own
- Severe rent burden
- 286.0
Population outlook (Bingham County) Hauer SSP2
- Today (2025)
- 42,176 people
- By 2030
- 40,396 · -4.2%
- By 2040
- 36,693 · -13.0%
- By 2050
- 32,485 · -23.0%
- By 2075
- 21,927 · -48.0%
- By 2100
- 12,716 · -69.9%
Race, ethnicity, and origin ACS 2023
- Neighborhood character
- Predominantly White (74%)
- Race & ethnicity
- White 74% Hispanic / Latino 18% Two or more races 8% Native American 5%
- Hispanic origin (detail)
- Mexican 15%
- Common ancestry
- Slovak 4% Italian 3% Lithuanian 1%
- Foreign-born
- 4% · Canada
- Languages at home
- 89% English-only · Spanish 10%
Political lean MEDSL · Bingham
- 2024 margin
- Solid R (+59.6) · D 18.8% · R 78.4% · Other 2.8%
- 2008→2024 swing
- -14.1pp toward R · 2008: -45.5pp · 2024: -59.6pp
- All cycles
- 2024: R+59.6 2020: R+55.6 2016: R+48.0 2012: R+54.6 2008: R+45.5
Not yet ingested
- Civics
- —
Market trends
- HPI YoY
- ▼ -176.20%
- Current HPI
- 252.1938
- Rent YoY
- —
- Metro
- Blackfoot, ID
- State GDP YoY
- ▲ 4.51%
- F500 in state
- 6
Industry mix (Fortune 500 HQ in ID)
| Industry | F500 HQs | Revenue |
|---|---|---|
| Retail | 1 | $79B |
|
||
| Technology | 1 | $25B |
|
||
| Food / Agriculture | 1 | $6B |
|
||
Price history
-8.7% since first listed2 events — show timeline
- 2026-04-06 Price Changed $105,000 SRMLS
- 2026-02-14 Listed $115,000 SRMLS
Cash-flow waterfall
monthlySold comps — $/sqft
last 12 mo · ≤1 miLoading sold comps…