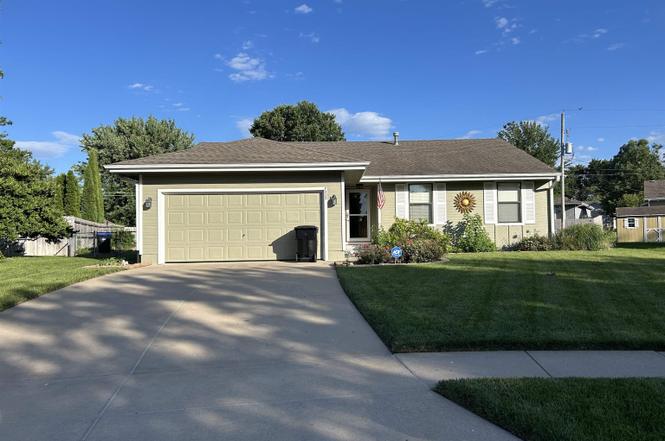
7325 SW 26th Ct · Topeka, KS
Flood risk 1/10 · Minimal
- FEMA flood zone
- X (unshaded)
- Chance of flooding over 30 yrs
- 0.0%
- Est. flood insurance / yr
- $473 – $860
Fire risk 5/10 · Moderate
- Est. fire insurance / yr
- $1,154 – $2,142
Heat risk 5/10 · Moderate
- Hot days now (above 107°F)
- 7 days/yr
- Hot days in 30 yrs
- 17 days/yr
Wind risk 2/10 · Minimal
- Chance of severe wind over 30 yrs
- —
Air-quality risk 3/10 · Minor
- Unhealthy air days now
- 3 days/yr
- Unhealthy air days in 30 yrs
- 3 days/yr
Risk factors via First Street. Map © Google.
Why this score? — see what drove the D- grade
The composite is a weighted blend of 9 inputs, each scored 0–100. Each bar is that input's sub-score; the figure is the points it added to the 100-point composite (weight × sub-score).
- Cash flow +9.4/30.0
- ARV discount +7.5/15.0
- Rent growth +5.0/5.0
- Schools +3.5/10.0
- Livability +3.5/5.0
- 1% rule +2.9/10.0
- DSCR +2.6/10.0
- Condition / age +2.5/5.0
- Appreciation +0.0/10.0
$268,000
🖨 Deal sheet (PDF) 📄 Offer letter ✓ Due diligence
Key facts
- 0.34 acre lot
- 2 garage spots
- Built 1993
Neighborhood map
What this means for you Summary
Snapshot
- This is a 3-bed/2.0-bath single-family listed at $268k.
Deal economics
- At list price, monthly cash flow is $-191 ($-2k/yr) — negative.
- To cash-flow at today's rent, offer at most $234k (12.6% below list).
- To meet the 1% rule (rent ≥ 1% of price), the offer needs to be $211k (21.2% below list).
- Recommended offer: $211k (21.2% below list) — sets the bar for 1% rule.
- Cap rate 5.4% vs local median 4.3% in Topeka — meaningfully above typical; check what's discounted (condition, days-on-market, listing class) to confirm the premium yield is real.
Location & tenants
- Location reads 69/100 on livability (#195 in KS) — a middle-class / working-renter tenant base. Strengths: cost of living A+, housing A+, health & safety A+; Watch: employment C-, crime F, commute F.
- Auburn Washburn (rural): math 34% / reading 42% proficiency, ranked #29 of 169 in KS (top 17%) — families likely to look elsewhere, expect single-tenant / working-renter base with shorter leases.
- Zoned schools: Indian Hills Elementary (math 44% / reading 52%, grade D, #196 of 684 statewide, top 29%, 474 students, 21% FRL); Washburn Rural Middle School (math 28% / reading 31%, grade F, #72 of 219 statewide, top 38%, 943 students, 36% FRL); Washburn Rural High (math 25% / reading 30%, grade F, #83 of 327 statewide, top 25%, 1,884 students, 31% FRL) — zoned schools at 29% FRL track the district average.
- Market conditions: Rents rising fast (+9.9%/yr); 142 active listings in the ZIP; 1 comparable units currently listed for rent nearby; 219 units permitted in Shawnee County in 2024 (25 in 5+ unit buildings).
- This rent runs 35% of the median local income ($71k/yr) — at the standard rent-burdened threshold; future hikes will face affordability resistance.
Forward outlook
- Local home prices are declining (-3.0%/yr); year-one equity from $2k of loan paydown is wiped out by about $8k of value loss. Plan a longer hold.
- Shawnee County population projected to shrink 7% by 2050 — rents likely to lag national; underwrite the cash flow, not the appreciation.
Negotiation context
- Only 0 days on market — expect competitive offers; lowballing is unlikely to land.
- Current owner paid $18k; list at $268k implies a 1349% gain — meaningful room to come down on a strong offer.
Risks & watch-outs
- Climate carrying-cost: moderate wildfire risk; extreme-heat days projected 7→17/yr by 2055 (HVAC capex compounding) — expect insurance premiums to compound above CPI over the hold.
Questions for the listing agent
- What do current leases actually rent for vs. the listed asking? Can we see a recent rent roll and the last 12 months of T-12 income?
- Is there a deadline driving the sale (1031 exchange, divorce, estate, relocation)? That informs how much negotiation room exists.
- Schools are D-rated, which usually means shorter tenancies and higher turnover. Who's the typical renter profile here, and what's been the actual vacancy rate?
- Crime grade is F in this area — have there been break-ins, vandalism, or insurance claims at this property in the last 3 years? What carrier currently insures it and at what premium?
- The area grade is low — what's the realistic commute time and amenity access for the typical tenant pool here? Any planned neighborhood developments (good or bad) we should know about?
- What's the average days-on-market for RENTAL listings here right now (not sales)? A rising rental-DOM trend means longer vacancies and softer asking-rent achievability than the comps imply.
- What's the recent tenant-quality profile in this submarket — average credit score on applications, eviction rate, late-payment / NSF rate, and stable-employment percentage? A property-management company in the area should have these aggregated.
- How much new for-sale + rental construction is in the pipeline within 1–3 miles? Heavy new supply typically softens prices + rents 12–24 months out; constrained supply supports both.
Investment metrics
- 1% rule
- 0.79% ✗
- Cap rate
- 5.44%
- Cash-on-cash
- -3.06%
- DSCR
- 0.86
- GRM
- 10.6
CMA / ARV
No comps found within radius.
Projected returns pro-forma
-3.0% appreciation · 8.0% rent growth · sell at horizon
- IRR
- -15.9%
- Equity multiple
- 0.41×
- Total profit
- $-44,414
- Equity at exit
- $39,960
- IRR
- -0.5%
- Equity multiple
- 0.95×
- Total profit
- $-3,425
- Equity at exit
- $23,172
Cash invested: $75,040 (down + closing). Projections, not guarantees.
Landlord ↔ Tenant lean methodology
- Overall (STATE)
- 83 Strongly Landlord-Friendly
- State Kansas
- 83 Strongly Landlord-Friendly · R+10
- County
- — inherits STATE
- City
- — inherits STATE
ZIP-level market 66614
- Rents YoY
- 9.9%
- Active inventory
- 142
- Price-to-rent
- 10.6×
Monthly cashflow live
- Estimated rent
- $2,111 medium interval (Pro) →
- Mortgage (P&I)
- −$1,405
- Tax from tax record
- −$342 /mo · $4,106/yr
- Insurance
- −$112
- HOA
- −$0
- Vacancy / Maint / Mgmt
- −$443
- Net cashflow
- $-191
Break-even live
Sensitivity live
| Price | -10% $-40 | -5% $-115 | +0% $-191 | +5% $-267 | +10% $-343 |
|---|---|---|---|---|---|
| Rent | -10% $-358 | -5% $-275 | +0% $-191 | +5% $-108 | +10% $-24 |
| Rate | -1.0pp $-56 | -0.5pp $-123 | base $-191 | +0.5pp $-261 | +1.0pp $-331 |
UW: 25.0% down · 7.5% · 30yr · 1.5% tax · 5.0% vac · 8.0% maint · 8.0% mgmt
Financing live
Cash to close
- Down payment
- $67,000
- Closing costs
- $8,040
- Reserves months
- —
- Total cash needed
- —
Loan-product check · same deal, 3 products live
Conventional
25% down · 7.5% · 30yr
- Down + closing
- —
- Monthly P&I
- —
- Monthly cashflow
- —
- DSCR
- —
- Eligible?
- —
Personal DTI + credit; lowest rate.
DSCR
20% down · 8.5% · 30yr
- Down + closing
- —
- Monthly P&I
- —
- Monthly cashflow
- —
- DSCR
- —
- Eligible?
- —
No personal income docs; deal must DSCR.
Hard money
10% down · 12.0% · 12mo
- Down + closing
- —
- Monthly P&I
- —
- Monthly cashflow
- —
- DSCR
- —
- Eligible?
- —
Short-term bridge; refi at stabilization.
Rent comps 1 comps
| Address | Beds | Baths | Sqft | Rent | $/sqft | DOM | Units | Dist |
|---|---|---|---|---|---|---|---|---|
| 7616 SW Lowell Ln Topeka, KS | 4.0 | 3.0 | 2691 | $3,700 | $1.37 | 22d | 1 | 0.42mi |
Listing history 1 events
-
2026-06-16$268,000 Pending
ⓘ Source: listings_history table (triggers on properties + properties_extension) + one-shot
backfill from property_details.listing_events for pre-trigger history.
Tax reassessment forecast KS · Resets to sale price
- Current annual tax
- $4,106 · $342/mo
- Projected year-2 tax
- $4,106 · $342/mo
- Expected delta
- $0/yr ($0/mo · 0.0%)
ⓘ Screening estimate from a state-policy table — verify with the county assessor before closing.
Climate risk First Street
- Flood 1/10 Low FEMA zone X (unshaded) · 0% chance over 30 yrs
- Wildfire 5/10 Major
- Heat 5/10 Major 7 d/yr ≥107°F today · 17 d/yr by 30 yrs out
- Wind 2/10 Low
- Air quality 3/10 Moderate 3 unhealthy d/yr today · 3 by 30 yrs out
Nearby sold comps map
Loading sold comps map…
Walkable amenities ~0.75 mi
Loading nearby amenities…
Taxation est. · year 1
- Rental income
- $25,337
- − Mortgage interest
- −$15,012
- − Property taxes
- −$4,106
- − Insurance
- −$1,340
- − Repairs & maintenance
- −$2,027
- − Management
- −$2,027
- − Depreciation
- −$7,796
- Taxable loss
- −$6,972
- Est. tax savings @ 24.0%
- +$1,673
- After-tax cash flow
- $-622/yr
For passive investors: Depreciation is non-cash, so a rental often shows a tax loss while cash-flowing — sheltering income. Rental losses are passive: they offset passive income freely, and up to $25,000/yr can offset ordinary (W-2) income if you actively participate and your MAGI is under $100k (phasing out to $0 by $150k); unused losses carry forward. On sale, claimed depreciation is recaptured at up to 25%, and gains may owe capital-gains tax (a 1031 exchange can defer both). Figures are a year-1 estimate at your 24.0% rate — not tax advice; consult a CPA.
Schools (NCES district)
- District
- Auburn Washburn
- NCES district ID
- 2003200
- Math proficiency
- 34% ▼ -8.00%
- Reading proficiency
- 42% ▼ -5.00%
- Median HH income
- $71,903
- Composite
- 34.91/100
- National rank
- #5073
- State rank
- #29 of 169 in KS
Livability — Topeka
- Score
- 69/100
- State rank
- #195
- US rank
- #8848
Category grades
Schools grade is shown separately in the Schools card above.
Census & demographics
- Census place
- Topeka, KS
- County
- Shawnee County · 118,130 people
- City population
- 118,130
- Metro
- Topeka, KS
- Population (ZIP)
- 32,538
- Household income
- $71,377
- Rent vs Own
- Severe rent burden
- 852.0
Population outlook (Shawnee County) Hauer SSP2
- Today (2025)
- 179,277 people
- By 2030
- 177,762 · -0.8%
- By 2040
- 172,341 · -3.9%
- By 2050
- 166,330 · -7.2%
- By 2075
- 152,417 · -15.0%
- By 2100
- 134,782 · -24.8%
Race, ethnicity, and origin ACS 2023
- Neighborhood character
- Predominantly White (79%)
- Race & ethnicity
- White 79% Hispanic / Latino 9% Two or more races 7% Black 4% Asian 3%
- Hispanic origin (detail)
- Mexican 8%
- Common ancestry
- Italian 3% Slovak 2% Romanian 2%
- Foreign-born
- 5% · Canada, China
- Languages at home
- 94% English-only · Spanish 3% Other Asian/Pacific 1% Other Indo-European 1%
Political lean MEDSL · Shawnee
- 2024 margin
- Toss-up / Even · D 49.3% · R 48.8% · Other 2.0%
- 2008→2024 swing
- +0.8pp no change · 2008: -0.3pp · 2024: 0.5pp
- All cycles
- 2024: D+0.5 2020: D+3.0 2016: R+2.8 2012: R+1.7 2008: R+0.3
Not yet ingested
- Civics
- —
Market trends
- HPI YoY
- ▼ -160.56%
- Current HPI
- 225.5592
- Rent YoY
- ▲ 9.88%
- Metro
- Topeka, KS
- State GDP YoY
- —
- F500 in state
- 0
Price history
+1348.6% since first listed4 events — show timeline
- 2026-06-15 Delisted — Sunflower MLS as distributed by MLS GRID
- 2026-05-28 Listed $268,000 Sunflower MLS as distributed by MLS GRID
- 2011-09-07 Sold (Public Records) — Public Records
- 1993-02-01 Sold (Public Records) $18,500 Public Records
Property tax history
+4.7%/yrLatest (2025): $4,106 · +3.4% YoY. Source: county tax records.
Cash-flow waterfall
monthlySold comps — $/sqft
last 12 mo · ≤1 miLoading sold comps…