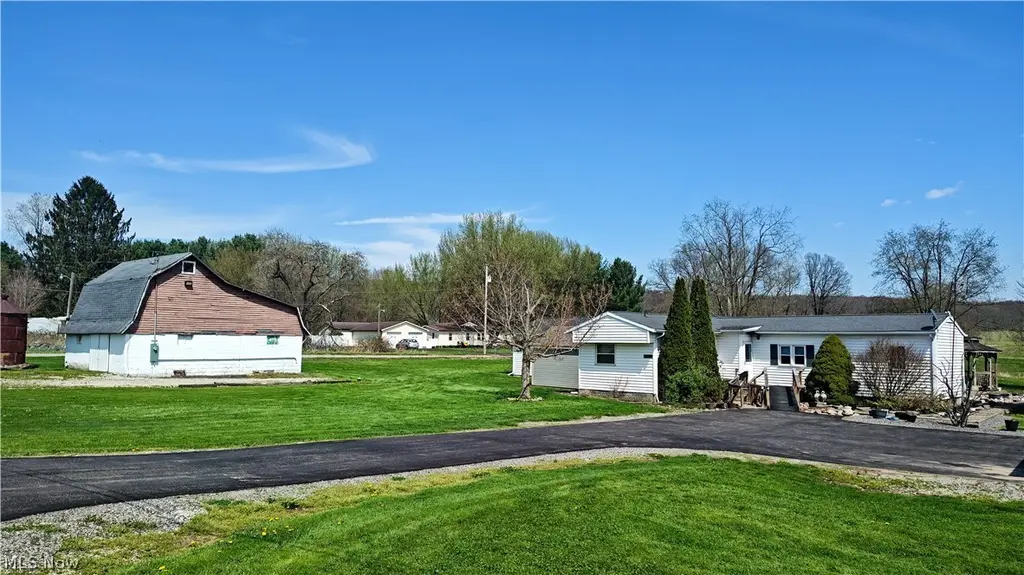
5122 Orangeville Kinsman Rd · Orangeville, OH
Flood risk 1/10 · Minimal
- FEMA flood zone
- X (unshaded)
- Chance of flooding over 30 yrs
- 0.0%
- Est. flood insurance / yr
- $473 – $860
Fire risk 1/10 · Minimal
- Est. fire insurance / yr
- $713 – $1,323
Heat risk 3/10 · Minor
- Hot days now (above 96°F)
- 7 days/yr
- Hot days in 30 yrs
- 18 days/yr
Wind risk 1/10 · Minimal
- Chance of severe wind over 30 yrs
- —
Air-quality risk 2/10 · Minimal
- Unhealthy air days now
- 1 days/yr
- Unhealthy air days in 30 yrs
- 3 days/yr
Risk factors via First Street. Map © Google.
Why this score? — see what drove the C+ grade
The composite is a weighted blend of 9 inputs, each scored 0–100. Each bar is that input's sub-score; the figure is the points it added to the 100-point composite (weight × sub-score).
- Cash flow +21.0/30.0
- ARV discount +15.0/15.0
- DSCR +6.7/10.0
- 1% rule +5.1/10.0
- Schools +4.5/10.0
- Appreciation +4.0/10.0
- Livability +3.1/5.0
- Rent growth +2.5/5.0
- Condition / age +2.5/5.0
$129,000
🖨 Deal sheet (PDF) 📄 Offer letter ✓ Due diligence
Listing remarks
Tucked away on 3 scenic acres, this country property offers the space, privacy, and versatility rural buyers are looking for. With mature trees, open yard space and a peaceful stream winding along the back of the property, the setting delivers a quiet country atmosphere that’s becoming harder to find. The home offers a functional single level layout with 4 bedrooms, 2 full bathrooms, spacious living and dining areas, a large kitchen, first-floor laundry and an oversized multi-purpose room with endless possibilities for additional living space or a home-based business, as it has a separate side entrance that provides added flexibility for business use, guests or private access. Recent
Key facts
- 3 scenic acres
- Peaceful stream
- Mature trees
Tags
Neighborhood map
What this means for you Summary
Snapshot
- This is a 4-bed/2.0-bath manufactured listed at $129k.
Deal economics
- At list price, monthly cash flow is $183 ($2k/yr) — positive.
- The deal already cash-flows at list — no discount required.
- Meets the 1% rule at list price ($1k rent vs $129k).
- Recommended offer: $127k (1.5% below list) — sets the bar for market timing.
Location & tenants
- Location reads 62/100 on livability (#873 in OH) — a middle-class / working-renter tenant base. Strengths: cost of living A+, housing A+; Watch: crime C-, employment D+, amenities F.
- Joseph Badger Local (rural): math 46% / reading 60% proficiency, ranked #397 of 656 in OH (top 60%) — acceptable for families but not a draw, mixed tenant base, ~2y average lease.
- Market conditions: 3 active listings in the ZIP; 129 units permitted in Trumbull County in 2024 (0 in 5+ unit buildings).
- This rent runs 33% of the median local income ($47k/yr) — at the standard rent-burdened threshold; future hikes will face affordability resistance.
Forward outlook
- Local home prices are declining (-2.0%/yr); year-one equity from $892 of loan paydown is wiped out by about $3k of value loss. Plan a longer hold.
- Trumbull County population projected at -22% by 2050 — secular population decline; favor cash flow + early exit over multi-decade hold.
Negotiation context
- It's been on market 19 days — a 2% lower offer ($127k) is reasonable based on typical stale-listing flexibility.
- 3 sale attempts; this cycle's ask has dropped $66k (34%) from the opening price — seller is motivated, your offer sets the floor, not the list.
Questions for the listing agent
- Built in 1979 — when were the roof, HVAC, electrical panel, plumbing, and water heater last replaced?
- Is there a deadline driving the sale (1031 exchange, divorce, estate, relocation)? That informs how much negotiation room exists.
- What's the average days-on-market for RENTAL listings here right now (not sales)? A rising rental-DOM trend means longer vacancies and softer asking-rent achievability than the comps imply.
- What's the recent tenant-quality profile in this submarket — average credit score on applications, eviction rate, late-payment / NSF rate, and stable-employment percentage? A property-management company in the area should have these aggregated.
- How much new for-sale + rental construction is in the pipeline within 1–3 miles? Heavy new supply typically softens prices + rents 12–24 months out; constrained supply supports both.
Investment metrics
- 1% rule
- 1.01% ✓
- Cap rate
- 7.99%
- Cash-on-cash
- 6.06%
- DSCR
- 1.27
- GRM
- 8.2
CMA / ARV
- ARV (median comp)
- $220,630
- List price
- $129,000
- Delta
- 19.66%
- Verdict
- OVERPRICED
- Comps
- 2 within 2.0 mi
Projected returns pro-forma
-2.02% appreciation · 3.0% rent growth · sell at horizon
- IRR
- -2.7%
- Equity multiple
- 0.89×
- Total profit
- $-3,917
- Equity at exit
- $24,944
- IRR
- 5.4%
- Equity multiple
- 1.45×
- Total profit
- $16,317
- Equity at exit
- $21,213
Cash invested: $36,120 (down + closing). Projections, not guarantees.
Landlord ↔ Tenant lean methodology
- Overall (STATE)
- 73 Landlord-Friendly
- State Ohio
- 73 Landlord-Friendly · R+6
- County
- — inherits STATE
- City
- — inherits STATE
ZIP-level market 44404
- Home prices YoY
- -1.4%
- Active inventory
- 3
- Price-to-rent
- 8.2×
Monthly cashflow live
- Estimated rent
- $1,307 medium interval (Pro) →
- Mortgage (P&I)
- −$676
- Tax from tax record
- −$120 /mo · $1,436/yr
- Insurance
- −$54
- HOA
- −$0
- Vacancy / Maint / Mgmt
- −$274
- Net cashflow
- $183
Break-even live
Sensitivity live
| Price | -10% $256 | -5% $219 | +0% $183 | +5% $146 | +10% $109 |
|---|---|---|---|---|---|
| Rent | -10% $79 | -5% $131 | +0% $183 | +5% $234 | +10% $286 |
| Rate | -1.0pp $247 | -0.5pp $215 | base $183 | +0.5pp $149 | +1.0pp $115 |
UW: 25.0% down · 7.5% · 30yr · 1.5% tax · 5.0% vac · 8.0% maint · 8.0% mgmt
Financing live
Cash to close
- Down payment
- $32,250
- Closing costs
- $3,870
- Reserves months
- —
- Total cash needed
- —
Loan-product check · same deal, 3 products live
Conventional
25% down · 7.5% · 30yr
- Down + closing
- —
- Monthly P&I
- —
- Monthly cashflow
- —
- DSCR
- —
- Eligible?
- —
Personal DTI + credit; lowest rate.
DSCR
20% down · 8.5% · 30yr
- Down + closing
- —
- Monthly P&I
- —
- Monthly cashflow
- —
- DSCR
- —
- Eligible?
- —
No personal income docs; deal must DSCR.
Hard money
10% down · 12.0% · 12mo
- Down + closing
- —
- Monthly P&I
- —
- Monthly cashflow
- —
- DSCR
- —
- Eligible?
- —
Short-term bridge; refi at stabilization.
Listing history 14 events
-
2026-06-21days on market $129,000 Active 19 DOM
-
2026-06-18days on market $129,000 Active 17 DOM
-
2026-06-17days on market $129,000 Active 16 DOM
-
2026-06-16days on market $129,000 Active 15 DOM
-
2026-06-15days on market $129,000 Active 14 DOM
-
2026-06-13days on market $129,000 Active 12 DOM
-
2026-06-12days on market $129,000 Active 11 DOM
-
2026-06-09days on market $129,000 Active 8 DOM
-
2026-06-08days on market $129,000 Active 7 DOM
-
2026-06-08pricestatusdays on market $129,000 Active 6 DOM
-
2026-05-18historical
-
2026-05-18$195,000 Active 1679-char remark
-
2026-04-10price $264,000
-
2026-04-02$274,000 Active
ⓘ Source: listings_history table (triggers on properties + properties_extension) + one-shot
backfill from property_details.listing_events for pre-trigger history.
Tax reassessment forecast OH · Partial reset (capped growth)
- Current annual tax
- $1,436 · $120/mo
- Projected year-2 tax
- $1,724 · $144/mo
- Expected delta
- +$288/yr (+$24/mo · 20.1%)
ⓘ Screening estimate from a state-policy table — verify with the county assessor before closing.
Climate risk First Street
- Flood 1/10 Low FEMA zone X (unshaded) · 0% chance over 30 yrs
- Wildfire 1/10 Low
- Heat 3/10 Moderate 7 d/yr ≥96°F today · 18 d/yr by 30 yrs out
- Wind 1/10 Low
- Air quality 2/10 Low 1 unhealthy d/yr today · 3 by 30 yrs out
Nearby sold comps map
Loading sold comps map…
Walkable amenities ~0.75 mi
Loading nearby amenities…
Taxation est. · year 1
- Rental income
- $15,683
- − Mortgage interest
- −$7,226
- − Property taxes
- −$1,436
- − Insurance
- −$645
- − Repairs & maintenance
- −$1,255
- − Management
- −$1,255
- − Depreciation
- −$3,753
- Taxable income
- $114
- Est. tax owed @ 24.0%
- −$27
- After-tax cash flow
- $2,163/yr
For passive investors: Depreciation is non-cash, so a rental often shows a tax loss while cash-flowing — sheltering income. Rental losses are passive: they offset passive income freely, and up to $25,000/yr can offset ordinary (W-2) income if you actively participate and your MAGI is under $100k (phasing out to $0 by $150k); unused losses carry forward. On sale, claimed depreciation is recaptured at up to 25%, and gains may owe capital-gains tax (a 1031 exchange can defer both). Figures are a year-1 estimate at your 24.0% rate — not tax advice; consult a CPA.
Schools (NCES district)
- District
- Joseph Badger Local
- NCES district ID
- 3905017
- Math proficiency
- 46% ▼ -23.00%
- Reading proficiency
- 60% ▼ -9.00%
- Median HH income
- $50,379
- Composite
- 45.26/100
- National rank
- #2659
- State rank
- #397 of 656 in OH
Livability — Orangeville
- Score
- 62/100
- State rank
- #873
- US rank
- #16571
Category grades
Schools grade is shown separately in the Schools card above.
Census & demographics
- County
- Trumbull · 193,293 people
- Metro
- Youngstown-Warren, OH
- Population (ZIP)
- 1,712
- Household income
- $47,058
- Rent vs Own
Population outlook (Trumbull County) Hauer SSP2
- Today (2025)
- 191,696 people
- By 2030
- 184,015 · -4.0%
- By 2040
- 166,810 · -13.0%
- By 2050
- 149,857 · -21.8%
- By 2075
- 115,769 · -39.6%
- By 2100
- 83,617 · -56.4%
Race, ethnicity, and origin ACS 2023
- Neighborhood character
- Predominantly White (97%)
- Race & ethnicity
- White 97% Two or more races 2% Black 1%
- Common ancestry
- Subsaharan African 2% Serbian 2% Iranian 1%
- Languages at home
- 99% English-only · Other Asian/Pacific 1%
Political lean MEDSL · Trumbull
- 2024 margin
- R (+16.8) · D 41.2% · R 58.0%
- 2008→2024 swing
- -39.2pp toward R · 2008: 22.4pp · 2024: -16.8pp
- All cycles
- 2024: R+16.8 2020: R+10.6 2016: R+6.4 2012: D+22.2 2008: D+22.4
Not yet ingested
- Civics
- —
Market trends
- HPI YoY
- ▼ -2.02%
- Current HPI
- 138.76
- Rent YoY
- —
- Metro
- —
- State GDP YoY
- ▲ 1.98%
- F500 in state
- 48
Industry mix (Fortune 500 HQ in OH)
| Industry | F500 HQs | Revenue |
|---|---|---|
| Insurance | 3 | $145B |
|
||
| Industrial Machinery | 3 | $49B |
|
||
| Financial Services | 3 | $24B |
|
||
| Consumer Goods | 2 | $93B |
|
||
| Aerospace / Defense | 2 | $47B |
|
||
| Utilities | 2 | $33B |
|
||
Price history
-52.9% since first listed6 events — show timeline
- 2026-06-05 Relisted — MLSNOW
- 2026-06-05 Price Changed $129,000 MLSNOW
- 2026-05-18 Listing Removed — MLSNOW
- 2026-05-18 Listed $195,000 MLSNOW
- 2026-04-10 Price Changed $264,000 MLSNOW
- 2026-04-02 Listed $274,000 MLSNOW
Property tax history
+5.6%/yrLatest (2025): $1,436 · +2.8% YoY. Source: county tax records.
Cash-flow waterfall
monthlySold comps — $/sqft
last 12 mo · ≤1 miLoading sold comps…