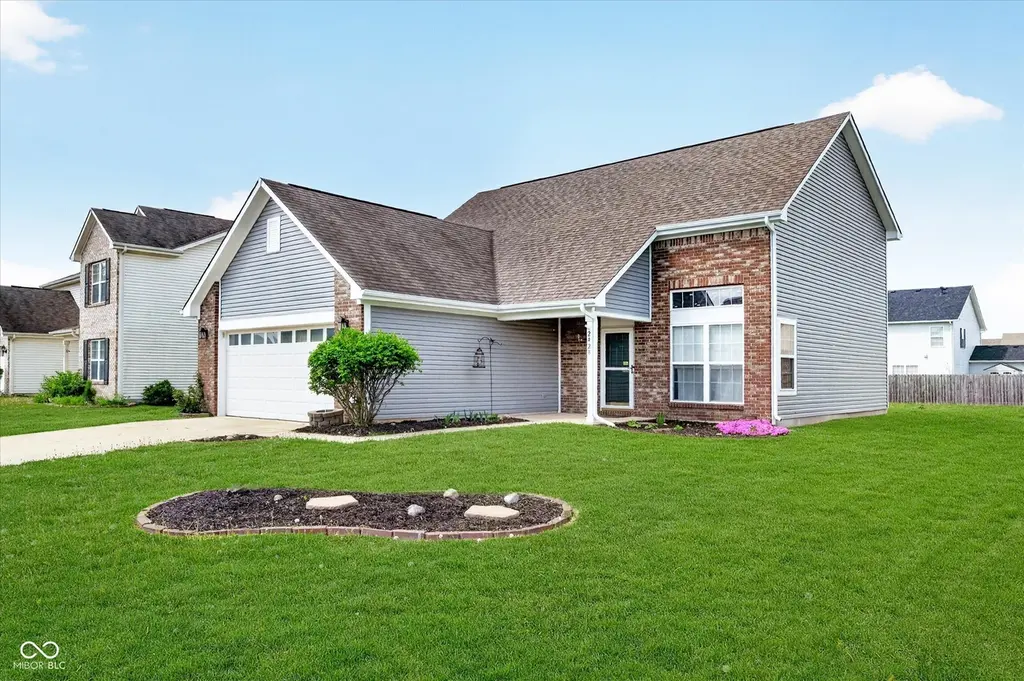
2428 Foxtail Dr · Avon, IN
Flood risk 1/10 · Minimal
- FEMA flood zone
- X (unshaded)
- Chance of flooding over 30 yrs
- 0.0%
- Est. flood insurance / yr
- $507 – $1,088
Fire risk 1/10 · Minimal
- Est. fire insurance / yr
- $717 – $1,331
Heat risk 4/10 · Minor
- Hot days now (above 101°F)
- 7 days/yr
- Hot days in 30 yrs
- 19 days/yr
Wind risk 2/10 · Minimal
- Chance of severe wind over 30 yrs
- 1.0%
Air-quality risk 3/10 · Minor
- Unhealthy air days now
- 2 days/yr
- Unhealthy air days in 30 yrs
- 3 days/yr
Risk factors via First Street. Map © Google.
Why this score? — see what drove the D- grade
The composite is a weighted blend of 9 inputs, each scored 0–100. Each bar is that input's sub-score; the figure is the points it added to the 100-point composite (weight × sub-score).
- ARV discount +9.7/15.0
- Cash flow +9.3/30.0
- Schools +4.7/10.0
- Livability +3.7/5.0
- Rent growth +3.4/5.0
- DSCR +2.6/10.0
- Condition / age +2.5/5.0
- 1% rule +2.4/10.0
- Appreciation +0.0/10.0
$315,000
🖨 Deal sheet (PDF) 📄 Offer letter ✓ Due diligence
Listing remarks
Welcome to this charming, move-in ready home in the highly desirable Settlement neighborhood in Avon! This spacious 3-bedroom, 2.5-bath home also features a dedicated office and a versatile bonus room or potential 4th bedroom, offering flexibility to fit your lifestyle. Step inside to an inviting open-concept layout with beautiful flooring throughout. The spacious great room boasts vaulted ceilings, creating a bright and airy feel, while the kitchen is equipped with stainless steel appliances, ample counter space, a pantry, and plenty of storage-perfect for both everyday living and entertaining. The main-level primary suite provides comfort and convenience, complete with a private ensuite b
Key facts
- Ample counter space
- Dedicated office
- Versatile bonus room
Tags
Property features AI
Finance
- Other: Mandatory fee ownership interest
- HOA & community: Homeowner association with quarterly fee; Quarterly HOA fee (amount provided); Community amenities include clubhouse, maintenance, park, playground, tennis courts, trails, snow removal and management
Exterior
- Parking: Attached 2-car garage (approx. 440 sq ft)
- Utilities: Public water; Municipal sewer connected; 200+ amp electrical service; Cable, electricity, sewer and water connected
- Home design: Single family residence; Two levels; East-facing
- Construction: Built by Arbor Homes; Vinyl with brick exterior; Slab foundation
- Exterior features: Lot under 1/4 acre (0.22 acre)
Interior
- Kitchen: Electric cooktop; Electric oven; Microwave with hood; Dishwasher; Disposal
- Bedrooms: Three bedrooms total — one on the main level and two on the upper level; Upper level also includes an office and a bonus room
- Bathrooms: Two full bathrooms (one on main level, one on upper level); One half bath on the main level; Primary bathroom includes a full tub
- Heating & cooling: Electric heating; Central air conditioning
- Interior features: High ceilings; Primary bedroom with walk-in closet
- Laundry & utility: Washer; Dryer; Electric water heater
Neighborhood map
What this means for you Summary
Snapshot
- This is a 3-bed/2.0-bath single-family listed at $315k.
Deal economics
- At list price, monthly cash flow is $-228 ($-3k/yr) — negative.
- To cash-flow at today's rent, offer at most $275k (12.8% below list).
- To meet the 1% rule (rent ≥ 1% of price), the offer needs to be $235k (25.5% below list).
- Recommended offer: $235k (25.5% below list) — sets the bar for 1% rule.
- Cap rate 5.4% vs local median 3.8% in Avon — top-decile yield for the area; either an underpriced asset or a hidden risk that comps aren't pricing in. Stress-test before assuming the spread holds.
Location & tenants
- Location reads 74/100 on livability (#75 in IN, #4,686 nationally) — a middle-class / working-renter tenant base. Strengths: employment A+, cost of living A+, housing A+; Watch: amenities F, commute F.
- Avon Community School Corporation (suburban): math 51% / reading 53% proficiency, ranked #32 of 301 in IN (top 11%) — acceptable for families but not a draw, mixed tenant base, ~2y average lease; only 20% free/reduced lunch — higher-income household profile.
- Zoned schools: Cedar Elementary School (math 63% / reading 40%, grade C-, #256 of 994 statewide, top 26%, 703 students, 51% FRL); Avon Middle School South (math 48% / reading 54%, grade C, #40 of 330 statewide, top 12%, 835 students, 44% FRL); Avon High School (math 44% / reading 76%, grade C+, #46 of 369 statewide, top 13%, 3,348 students, 38% FRL) — zoned schools average 45% FRL vs 20% district-wide (25 pts higher); higher-poverty schools than district average — tighter screening recommended.
- Market conditions: Rents rising (+3.6%/yr); 291 active listings in the ZIP; 14 comparable units currently listed for rent nearby; rentals leasing fast (median 13d on market — plan ~1-2 weeks tenant-placement turnaround); solid renter incomes; 1,294 units permitted in Hendricks County in 2024 (18 in 5+ unit buildings).
- This rent runs 31% of the median local income ($90k/yr) — at the standard rent-burdened threshold; future hikes will face affordability resistance.
Forward outlook
- Local home prices are declining (-3.0%/yr); year-one equity from $2k of loan paydown is wiped out by about $9k of value loss. Plan a longer hold.
- Hendricks County population projected at +35% by 2050 — long-run rental-demand tailwind backs the buy-and-hold thesis.
Negotiation context
- It's been on market 43 days — a 3% lower offer ($306k) is reasonable based on typical stale-listing flexibility.
Questions for the listing agent
- What do current leases actually rent for vs. the listed asking? Can we see a recent rent roll and the last 12 months of T-12 income?
- It's been on market 43 days. Have you received any prior offers? Is the seller open to a 26% concession, seller financing, or rate buy-down credit?
- What does the HOA fee cover, when was the last increase, and are there any pending special assessments or reserve-fund shortfalls?
- Is there a deadline driving the sale (1031 exchange, divorce, estate, relocation)? That informs how much negotiation room exists.
- Schools are A-rated — typically a magnet for longer-tenancy family renters. What's the average tenant stay here, and is there a school-zone premium baked into asking?
- The area grade is low — what's the realistic commute time and amenity access for the typical tenant pool here? Any planned neighborhood developments (good or bad) we should know about?
- What's the average days-on-market for RENTAL listings here right now (not sales)? A rising rental-DOM trend means longer vacancies and softer asking-rent achievability than the comps imply.
- What's the recent tenant-quality profile in this submarket — average credit score on applications, eviction rate, late-payment / NSF rate, and stable-employment percentage? A property-management company in the area should have these aggregated.
- How much new for-sale + rental construction is in the pipeline within 1–3 miles? Heavy new supply typically softens prices + rents 12–24 months out; constrained supply supports both.
Investment metrics
- 1% rule
- 0.74% ✗
- Cap rate
- 5.42%
- Cash-on-cash
- -3.10%
- DSCR
- 0.86
- GRM
- 11.2
CMA / ARV
- ARV (median comp)
- $331,518
- List price
- $315,000
- Delta
- -4.98%
- Verdict
- FAIR
- Comps
- 20 within 1.0 mi
Show comp detail 12 sales within ~0.75 mi
| Address | Dist | Beds/Ba | Sqft | Sold | Price | $/sf | Match |
|---|---|---|---|---|---|---|---|
| 2422 Solidago Dr | 0.13mi | 3/2.5 | 1,779 (+6%) | 4mo | $300,000 | $169 | 78 |
| 2841 Piper Pl | 0.39mi | 3/2.0 | 1,609 (-4%) | 5mo | $325,000 | $202 | 71 |
| 2226 Galleone Way | 0.69mi | 2/2.0 (-1) | 1,674 (-0%) | 2mo | $365,000 | $218 | 61 |
| 2206 Galleone Way | 0.70mi | 2/2.0 (-1) | 1,674 (-0%) | 2mo | $387,000 | $231 | 61 |
| 521 Seagrape Ln | 0.75mi | 3/2.0 | 1,674 (-0%) | 5mo | $377,000 | $225 | 61 |
| 529 Regatta Ln | 0.74mi | 3/2.0 | 1,674 (-0%) | 6mo | $365,000 | $218 | 60 |
| 8045 Melbourne Ln | 0.74mi | 3/2.0 | 1,657 (-1%) | 8mo | $309,900 | $187 | 57 |
| 9136 Anthem Ave | 0.64mi | 3/2.5 | 1,722 (+3%) | 8mo | $347,500 | $202 | 56 |
| 2350 Trefoil Dr | 0.39mi | 3/2.0 | 1,462 (-13%) | 8mo | $301,500 | $206 | 54 |
| 2271 Hampton Ct | 0.63mi | 3/2.0 | 1,505 (-10%) | 3mo | $270,000 | $179 | 51 |
| 2253 Summerfield Dr | 0.68mi | 3/2.0 | 1,505 (-10%) | 3mo | $266,000 | $177 | 49 |
| 545 Regatta Ln | 0.73mi | 2/2.0 (-1) | 1,915 (+14%) | 1mo | $365,000 | $191 | 37 |
Match score weights: distance 35% · size 25% · config 20% · recency 20%. Top-matched comps best support the ARV.
Projected returns pro-forma
-3.0% appreciation · 3.65% rent growth · sell at horizon
- IRR
- -20.8%
- Equity multiple
- 0.27×
- Total profit
- $-64,049
- Equity at exit
- $46,968
- IRR
- -12.8%
- Equity multiple
- 0.23×
- Total profit
- $-68,151
- Equity at exit
- $27,235
Cash invested: $88,200 (down + closing). Projections, not guarantees.
Landlord ↔ Tenant lean methodology
- Overall (STATE)
- 90 Strongly Landlord-Friendly
- State Indiana
- 90 Strongly Landlord-Friendly · R+11
- County
- — inherits STATE
- City
- — inherits STATE
ZIP-level market 46168
- Rents YoY
- 3.6%
- Active inventory
- 291
- Price-to-rent
- 11.2×
Monthly cashflow live
- Estimated rent
- $2,346 high interval (Pro) →
- Mortgage (P&I)
- −$1,652
- Tax from tax record
- −$239 /mo · $2,873/yr
- Insurance
- −$131
- HOA
- −$59
- Vacancy / Maint / Mgmt
- −$493
- Net cashflow
- $-228
Break-even live
Sensitivity live
| Price | -10% $-50 | -5% $-139 | +0% $-228 | +5% $-317 | +10% $-406 |
|---|---|---|---|---|---|
| Rent | -10% $-413 | -5% $-321 | +0% $-228 | +5% $-135 | +10% $-43 |
| Rate | -1.0pp $-69 | -0.5pp $-148 | base $-228 | +0.5pp $-310 | +1.0pp $-393 |
UW: 25.0% down · 7.5% · 30yr · 1.5% tax · 5.0% vac · 8.0% maint · 8.0% mgmt
Financing live
Cash to close
- Down payment
- $78,750
- Closing costs
- $9,450
- Reserves months
- —
- Total cash needed
- —
Loan-product check · same deal, 3 products live
Conventional
25% down · 7.5% · 30yr
- Down + closing
- —
- Monthly P&I
- —
- Monthly cashflow
- —
- DSCR
- —
- Eligible?
- —
Personal DTI + credit; lowest rate.
DSCR
20% down · 8.5% · 30yr
- Down + closing
- —
- Monthly P&I
- —
- Monthly cashflow
- —
- DSCR
- —
- Eligible?
- —
No personal income docs; deal must DSCR.
Hard money
10% down · 12.0% · 12mo
- Down + closing
- —
- Monthly P&I
- —
- Monthly cashflow
- —
- DSCR
- —
- Eligible?
- —
Short-term bridge; refi at stabilization.
Rent comps 14 comps
| Address | Beds | Baths | Sqft | Rent | $/sqft | DOM | Units | Dist |
|---|---|---|---|---|---|---|---|---|
| 8325 Bluestem Ln Plainfield, IN | 4.0 | 2.5 | 2160 | $2,495 | $1.16 | 23d | 1 | 0.34mi |
| 8151 Lupine Dr Plainfield, IN | 3.0 | 2.5 | 2003 | $2,450 | $1.22 | 45d | 1 | 0.43mi |
| 9074 Anthem Ave Plainfield, IN | 3.0 | 2.5 | 1722 | $2,450 | $1.42 | 0d | 1 | 0.59mi |
| 2514 Grand Central BLVD Cartersburg, IN | 1.0–3.0 | 1.0–2.5 | 1324 | $3,499 | $2.64 | 0d | 282 | 0.66mi |
| 2870 Pearson Pkwy Plainfield, IN | 3.0 | 1.0–2.0 | 918 | $2,199 | $2.40 | 19d | 18 | 0.72mi |
| 2155 Shadowbrook Dr Unit 1228635P Plainfield, IN | 3.0 | 2.0 | 1560 | $2,803 | $1.80 | 0d | 1 | 0.83mi |
| 2145 Shadowbrook Dr Plainfield, IN | 3.0 | 2.0 | 1408 | $2,100 | $1.49 | 4d | 1 | 0.84mi |
| 8140 Elsen Rdg Avon, IN | 3.0 | 2.0 | 1506 | $2,049 | $1.36 | 23d | 1 | 1.10mi |
| 311 Harpers Xing Plainfield, IN | 1.0–3.0 | 1.0–1.5 | 882 | $1,350 | $1.53 | 13d | 8 | 1.12mi |
| 1995 Crown Plaza Blvd Plainfield, IN | 1.0–3.0 | 1.0–2.0 | 924 | $1,700 | $1.84 | 0d | 5 | 1.32mi |
| 311 Country Ln Plainfield, IN | 1.0–3.0 | 1.0–2.0 | 920 | $1,700 | $1.85 | 0d | 9 | 1.32mi |
| 8060 Clarks Creek Ct Avon, IN | 3.0 | 2.0 | 1643 | $2,125 | $1.29 | 45d | 1 | 1.34mi |
| 8060 Clarks Creek Ct Avon, IN | 3.0 | 2.0 | 1643 | $2,125 | $1.29 | 46d | 1 | 1.34mi |
| 584 Stone Table Blvd Plainfield, IN | 1.0–2.0 | 1.0–2.0 | 1168 | $2,295 | $1.96 | 0d | 5 | 1.45mi |
HOA detail
- Monthly dues
- $59 · $708/yr
Listing history 6 events
-
2026-06-07statusdays on market $315,000 Pending 43 DOM
-
2026-06-03days on market $315,000 Active 41 DOM
-
2026-06-02days on market $315,000 Active 40 DOM
-
2026-06-01days on market $315,000 Active 39 DOM
-
2026-05-31days on market $315,000 Active 38 DOM
-
2026-04-23$315,000 Active 1315-char remark
ⓘ Source: listings_history table (triggers on properties + properties_extension) + one-shot
backfill from property_details.listing_events for pre-trigger history.
Tax reassessment forecast IN · Partial reset (capped growth)
- Current annual tax
- $2,873 · $239/mo
- Projected year-2 tax
- $2,873 · $239/mo
- Expected delta
- $0/yr ($0/mo · 0.0%)
ⓘ Screening estimate from a state-policy table — verify with the county assessor before closing.
Climate risk First Street
- Flood 1/10 Low FEMA zone X (unshaded) · 0% chance over 30 yrs
- Wildfire 1/10 Low
- Heat 4/10 Moderate 7 d/yr ≥101°F today · 19 d/yr by 30 yrs out
- Wind 2/10 Low 100% chance of damaging wind over 30 yrs
- Air quality 3/10 Moderate 2 unhealthy d/yr today · 3 by 30 yrs out
Nearby sold comps map
Loading sold comps map…
Walkable amenities ~0.75 mi
Loading nearby amenities…
Taxation est. · year 1
- Rental income
- $28,154
- − Mortgage interest
- −$17,645
- − Property taxes
- −$2,873
- − Insurance
- −$1,575
- − Repairs & maintenance
- −$2,252
- − Management
- −$2,252
- − HOA
- −$708
- − Depreciation
- −$9,164
- Taxable loss
- −$8,315
- Est. tax savings @ 24.0%
- +$1,996
- After-tax cash flow
- $-741/yr
For passive investors: Depreciation is non-cash, so a rental often shows a tax loss while cash-flowing — sheltering income. Rental losses are passive: they offset passive income freely, and up to $25,000/yr can offset ordinary (W-2) income if you actively participate and your MAGI is under $100k (phasing out to $0 by $150k); unused losses carry forward. On sale, claimed depreciation is recaptured at up to 25%, and gains may owe capital-gains tax (a 1031 exchange can defer both). Figures are a year-1 estimate at your 24.0% rate — not tax advice; consult a CPA.
Schools (NCES district)
- District
- Avon Community School Corporation
- NCES district ID
- 1800270
- Math proficiency
- 51% ▼ -8.00%
- Reading proficiency
- 53% ▼ -8.00%
- Median HH income
- $75,987
- Composite
- 46.93/100
- National rank
- #2362
- State rank
- #32 of 301 in IN
Livability — Avon
- Score
- 74/100
- State rank
- #75
- US rank
- #4686
Category grades
Schools grade is shown separately in the Schools card above.
Census & demographics
- Census place
- Avon, IN
- County
- Hendricks County · 143,373 people
- City population
- 43,353
- Metro
- Indianapolis-Carmel-Anderson, IN
- Population (ZIP)
- 38,826
- Household income
- $90,000
- Rent vs Own
- Severe rent burden
- 1029.0
Population outlook (Hendricks County) Hauer SSP2
- Today (2025)
- 187,418 people
- By 2030
- 201,494 · +7.5%
- By 2040
- 228,487 · +21.9%
- By 2050
- 253,068 · +35.0%
- By 2075
- 308,920 · +64.8%
- By 2100
- 336,510 · +79.6%
Race, ethnicity, and origin ACS 2023
- Neighborhood character
- Predominantly White (76%)
- Race & ethnicity
- White 76% Black 9% Two or more races 8% Hispanic / Latino 6% Asian 4%
- Hispanic origin (detail)
- Mexican 3%
- Common ancestry
- Italian 2% Lithuanian 1% Romanian 1%
- Foreign-born
- 7% · Canada, China
- Languages at home
- 90% English-only · Spanish 4% Other Indo-European 3% French/Haitian/Cajun 1%
Political lean MEDSL · Hendricks
- 2024 margin
- Strong R (+21.5) · D 38.4% · R 59.9% · Other 1.7%
- 2008→2024 swing
- +1.9pp toward D · 2008: -23.4pp · 2024: -21.5pp
- All cycles
- 2024: R+21.5 2020: R+23.9 2016: R+34.2 2012: R+34.9 2008: R+23.4
Not yet ingested
- Civics
- —
Market trends
- HPI YoY
- ▼ -136.23%
- Current HPI
- 205.5963
- Rent YoY
- ▲ 3.65%
- Metro
- Indianapolis-Carmel-Anderson, IN
- State GDP YoY
- ▲ 2.90%
- F500 in state
- 18
Industry mix (Fortune 500 HQ in IN)
| Industry | F500 HQs | Revenue |
|---|---|---|
| Industrial Machinery | 2 | $37B |
|
||
| Healthcare | 1 | $177B |
|
||
| Pharmaceuticals | 1 | $45B |
|
||
| Metals / Steel | 1 | $18B |
|
||
| Agriculture | 1 | $17B |
|
||
| Packaging | 1 | $12B |
|
||
Price history
2 events — show timeline
- 2026-06-05 Pending — MIBOR as Distributed by MLS Grid
- 2026-04-23 Listed $315,000 MIBOR as Distributed by MLS Grid
Property tax history
+6.1%/yrLatest (2025): $2,873 · +10.7% YoY. Source: county tax records.
Cash-flow waterfall
monthlySold comps — $/sqft
last 12 mo · ≤1 miLoading sold comps…