 13-Plex
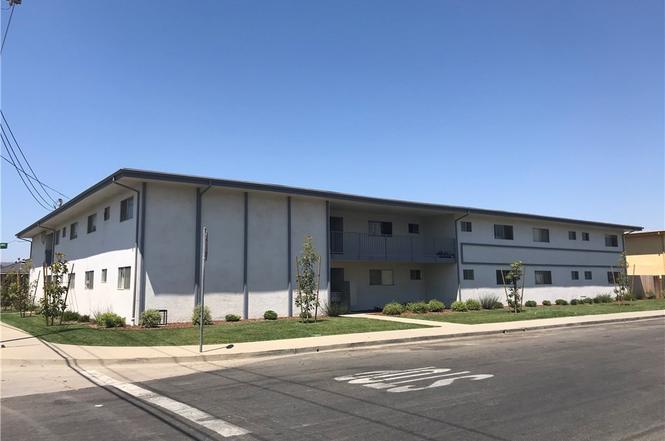
127 Agnes Ave · Santa Maria, CA
Flood risk 5/10 · Moderate
- FEMA flood zone
- X (unshaded)
- Chance of flooding over 30 yrs
- 0.24%
- Est. flood insurance / yr
- $507 – $1,088
Fire risk 4/10 · Minor
- Est. fire insurance / yr
- $659 – $1,223
Heat risk 4/10 · Minor
- Hot days now (above 84°F)
- 7 days/yr
- Hot days in 30 yrs
- 17 days/yr
Wind risk 1/10 · Minimal
- Chance of severe wind over 30 yrs
- —
Air-quality risk 6/10 · Moderate
- Unhealthy air days now
- 11 days/yr
- Unhealthy air days in 30 yrs
- 12 days/yr
Risk factors via First Street. Map © Google.
Why this score? — see what drove the F grade
The composite is a weighted blend of 9 inputs, each scored 0–100. Each bar is that input's sub-score; the figure is the points it added to the 100-point composite (weight × sub-score).
- Cash flow +9.5/30.0
- ARV discount +7.5/15.0
- Livability +3.6/5.0
- Rent growth +3.1/5.0
- Schools +2.9/10.0
- DSCR +2.7/10.0
- Condition / age +2.5/5.0
- 1% rule +2.0/10.0
- Appreciation +0.0/10.0
$3,500,000
🖨 Deal sheet (PDF) 📄 Offer letter ✓ Due diligence
Multi-family units
County records classify this as Multi-Family (5+ Unit). Listing-text estimate: 13 units. confirmed
5+ unit building — per-unit beds/baths from public records are typically unavailable; the breakdown below (if shown) is an estimate from the listing text.
Listing remarks MLS
Fully leased! Positive Leverage From Day 1 w/ 3.77% Interest Only Assumable Agency Loan! Agnes Apartments is a 13-unit multifamily community located in Santa Maria, offering a well-positioned residential investment with immediate cash flow. The property features an ideal unit mix consisting of studios, one-bedroom, and two-bedroom units, allow-ing for broad tenant appeal. Units are arranged around a central courtyard with open green space, providing a functional common area for residents. The property includes a shared on-site washer and dryer room and covered carport parking, with one parking space provided per unit. Recent lighting upgrades have improved visibility and safety throughout the parking areas. **Part of a portfolio sale - 511 W Cook Street (11 units) is available under same ownership.**
Key facts
- Open green space
- Central courtyard
- 0.43 acre lot
Tags
Property features AI
Finance
- Financial info: Sample reported rents: Unit type totals include $4,699 for one 2-bedroom unit group and $10,827 for a group of 6 one-bedroom units
Exterior
- Parking: 13 carport spaces
- Home design: Multi-unit property (13 total units); Zoned R-3
Interior
- Bedrooms: Two 2-bedroom units; Six 1-bedroom units; Five studio/other units (bath count only listed)
- Bathrooms: Multiple units with one bathroom each
- Interior features: Laundry room
- Laundry & utility: Laundry room available
Neighborhood map
What this means for you Summary
Snapshot
- This is a 13 × 1-bed/1.0-bath units multifamily listed at $3.50M.
Deal economics
- At list price, monthly cash flow is $-2k ($-30k/yr) — negative. Per door: $-189/mo.
- To cash-flow at today's rent, offer at most $3.07M (12.4% below list).
- To meet the 1% rule (rent ≥ 1% of price), the offer needs to be $2.44M (30.2% below list).
- Recommended offer: $2.44M (30.2% below list) — sets the bar for 1% rule.
- Cap rate 5.4% vs local median 3.5% in Santa Maria — top-decile yield for the area; either an underpriced asset or a hidden risk that comps aren't pricing in. Stress-test before assuming the spread holds.
Location & tenants
- Location reads 71/100 on livability (#202 in CA) — a middle-class / working-renter tenant base. Strengths: amenities A+, commute A+, health & safety A; Watch: crime F, cost of living F.
- Santa Maria-Bonita (urban): math 26% / reading 34% proficiency, ranked #1,023 of 1,400 in CA (top 73%) — families likely to look elsewhere, expect single-tenant / working-renter base with shorter leases; 72% free/reduced lunch — lower-income household profile, screen leases tightly.
- Zoned schools: Bruce (Robert) Elementary (951 students, 83% FRL); El Camino Junior High (779 students, 91% FRL); Pioneer Valley High (3,220 students, 74% FRL).
- Market conditions: Rents rising (+2.3%/yr); 56 active listings in the ZIP; solid renter incomes; 719 units permitted in Santa Barbara County in 2024 (217 in 5+ unit buildings).
- At $24,421/mo this rent would consume 389% of the median local household income ($75k/yr) (locally 2583% of renters already pay >50% of income on rent) — very limited rent-growth headroom before tenants either downsize or default.
Forward outlook
- Local home prices are declining (-3.0%/yr); year-one equity from $24k of loan paydown is wiped out by about $105k of value loss. Plan a longer hold.
- Santa Barbara County population projected at +20% by 2050 — long-run rental-demand tailwind backs the buy-and-hold thesis.
Negotiation context
- It's been on market 127 days — a 12% lower offer ($3.08M) is reasonable based on typical stale-listing flexibility.
- 5 sale attempts since 11y ago with the ask held roughly flat each time — persistent listings suggest the price (not the market) is what's stuck; bring a comps-based counter.
- Current owner paid $1.86M; list at $3.50M implies a 88% gain — meaningful room to come down on a strong offer.
Risks & watch-outs
- Climate carrying-cost: moderate flood risk — expect insurance premiums to compound above CPI over the hold.
Questions for the listing agent
- What do current leases actually rent for vs. the listed asking? Can we see a recent rent roll and the last 12 months of T-12 income?
- It's been on market 127 days. Have you received any prior offers? Is the seller open to a 30% concession, seller financing, or rate buy-down credit?
- Can we see the unit-by-unit rent roll, current vacancy, and any below-market leases? What's the average tenancy length?
- What capital expenditures (roof, boiler, parking lot, exteriors) have been made in the last 5 years, and what's planned in the next 2?
- Built in 1965 — when were the roof, HVAC, electrical panel, plumbing, and water heater last replaced?
- Why hasn't it sold? Are there any deal-killer items the seller is aware of (foundation, flood, title, zoning, code violations)?
- Is there a deadline driving the sale (1031 exchange, divorce, estate, relocation)? That informs how much negotiation room exists.
- Schools are F-rated, which usually means shorter tenancies and higher turnover. Who's the typical renter profile here, and what's been the actual vacancy rate?
- Crime grade is F in this area — have there been break-ins, vandalism, or insurance claims at this property in the last 3 years? What carrier currently insures it and at what premium?
- The area grade is low — what's the realistic commute time and amenity access for the typical tenant pool here? Any planned neighborhood developments (good or bad) we should know about?
- What's the average days-on-market for RENTAL listings here right now (not sales)? A rising rental-DOM trend means longer vacancies and softer asking-rent achievability than the comps imply.
- What's the recent tenant-quality profile in this submarket — average credit score on applications, eviction rate, late-payment / NSF rate, and stable-employment percentage? A property-management company in the area should have these aggregated.
- How much new apartment / multifamily construction is in the pipeline within 1–3 miles? Heavy new supply (>2% of stock underway) typically softens rents 12–24 months out; light construction supports rent growth.
Investment metrics
- 1% rule
- 0.70% ✗
- Cap rate
- 5.45%
- Cash-on-cash
- -3.02%
- DSCR
- 0.87
- GRM
- 11.9
CMA / ARV
No comps found within radius.
Projected returns pro-forma
-3.0% appreciation · 2.31% rent growth · sell at horizon
- IRR
- -22.1%
- Equity multiple
- 0.24×
- Total profit
- $-741,947
- Equity at exit
- $521,861
- IRR
- -17.7%
- Equity multiple
- 0.06×
- Total profit
- $-920,738
- Equity at exit
- $302,616
Cash invested: $980,000 (down + closing). Projections, not guarantees.
Landlord ↔ Tenant lean methodology
- Overall (STATE)
- 18 Strongly Tenant-Friendly
- State California
- 18 Strongly Tenant-Friendly · D+13
- County
- — inherits STATE
- City
- — inherits STATE
ZIP-level market 93458
- Rents YoY
- 2.3%
- Active inventory
- 56
- Price-to-rent
- 155.3×
Monthly cashflow live
- Estimated rent
- $24,421 high interval (Pro) →
- Mortgage (P&I)
- −$18,354
- Tax from tax record
- −$1,942 /mo · $23,307/yr
- Insurance
- −$1,458
- HOA
- −$0
- Vacancy / Maint / Mgmt
- −$5,128
- Net cashflow
- $-2,462
Break-even live
Sensitivity live
| Price | -10% $-481 | -5% $-1,472 | +0% $-2,462 | +5% $-3,453 | +10% $-4,444 |
|---|---|---|---|---|---|
| Rent | -10% $-4,392 | -5% $-3,427 | +0% $-2,462 | +5% $-1,498 | +10% $-533 |
| Rate | -1.0pp $-700 | -0.5pp $-1,572 | base $-2,462 | +0.5pp $-3,369 | +1.0pp $-4,292 |
13-unit breakdown (identical units grouped — click to expand)
| Units | Beds | Baths | Est. rent |
|---|---|---|---|
| 13× units | 1 | 1 | $24,427 |
| #1 | 1 | 1 | $1,879 |
| #2 | 1 | 1 | $1,879 |
| #3 | 1 | 1 | $1,879 |
| #4 | 1 | 1 | $1,879 |
| #5 | 1 | 1 | $1,879 |
| #6 | 1 | 1 | $1,879 |
| #7 | 1 | 1 | $1,879 |
| #8 | 1 | 1 | $1,879 |
| #9 | 1 | 1 | $1,879 |
| #10 | 1 | 1 | $1,879 |
| #11 | 1 | 1 | $1,879 |
| #12 | 1 | 1 | $1,879 |
| #13 | 1 | 1 | $1,879 |
| Total (13 units) | $24,421 | ||
UW: 25.0% down · 7.5% · 30yr · 1.5% tax · 5.0% vac · 8.0% maint · 8.0% mgmt
Financing live
Cash to close
- Down payment
- $875,000
- Closing costs
- $105,000
- Reserves months
- —
- Total cash needed
- —
Loan-product check · same deal, 3 products live
Conventional
25% down · 7.5% · 30yr
- Down + closing
- —
- Monthly P&I
- —
- Monthly cashflow
- —
- DSCR
- —
- Eligible?
- —
Personal DTI + credit; lowest rate.
DSCR
20% down · 8.5% · 30yr
- Down + closing
- —
- Monthly P&I
- —
- Monthly cashflow
- —
- DSCR
- —
- Eligible?
- —
No personal income docs; deal must DSCR.
Hard money
10% down · 12.0% · 12mo
- Down + closing
- —
- Monthly P&I
- —
- Monthly cashflow
- —
- DSCR
- —
- Eligible?
- —
Short-term bridge; refi at stabilization.
Listing history 17 events
-
2026-06-03days on market $3,500,000 Active 127 DOM
-
2026-06-02days on market $3,500,000 Active 126 DOM
-
2026-06-01days on market $3,500,000 Active 125 DOM
-
2026-05-31days on market $3,500,000 Active 124 DOM
-
2026-05-30days on market $3,500,000 Active 123 DOM
-
2026-01-27$3,500,000 Active 811-char remark
Show marketing remark (811 chars)
Fully leased! Positive Leverage From Day 1 w/ 3.77% Interest Only Assumable Agency Loan! Agnes Apartments is a 13-unit multifamily community located in Santa Maria, offering a well-positioned residential investment with immediate cash flow. The property features an ideal unit mix consisting of studios, one-bedroom, and two-bedroom units, allow-ing for broad tenant appeal. Units are arranged around a central courtyard with open green space, providing a functional common area for residents. The property includes a shared on-site washer and dryer room and covered carport parking, with one parking space provided per unit. Recent lighting upgrades have improved visibility and safety throughout the parking areas. **Part of a portfolio sale - 511 W Cook Street (11 units) is available under same ownership.**
-
2026-01-27$3,500,000 Active
Show marketing remark (811 chars)
Fully leased! Positive Leverage From Day 1 w/ 3.77% Interest Only Assumable Agency Loan! Agnes Apartments is a 13-unit multifamily community located in Santa Maria, offering a well-positioned residential investment with immediate cash flow. The property features an ideal unit mix consisting of studios, one-bedroom, and two-bedroom units, allow-ing for broad tenant appeal. Units are arranged around a central courtyard with open green space, providing a functional common area for residents. The property includes a shared on-site washer and dryer room and covered carport parking, with one parking space provided per unit. Recent lighting upgrades have improved visibility and safety throughout the parking areas. **Part of a portfolio sale - 511 W Cook Street (11 units) is available under same ownership.**
-
2018-11-13soldstatus $1,860,000
-
2018-11-09soldstatus $1,860,000 510-char remark
Show marketing remark (510 chars)
Recently updated 13 unit apartment complex located in Santa Maria just off Broadway Avenue, a major arterial. Property is located in close proximity to several local markets, restaurants and retail outlets. Alvin Elementary School and El Camino Junior High School are located within a third of a mile and the Santa Maria town center is located under a mile, placing this complex in a great location. The property provides 13 covered off-street parking places and has just completed an extensive remodel includi
-
2018-11-09soldstatus $1,860,000 Closed Sale
Show marketing remark (510 chars)
Recently updated 13 unit apartment complex located in Santa Maria just off Broadway Avenue, a major arterial. Property is located in close proximity to several local markets, restaurants and retail outlets. Alvin Elementary School and El Camino Junior High School are located within a third of a mile and the Santa Maria town center is located under a mile, placing this complex in a great location. The property provides 13 covered off-street parking places and has just completed an extensive remodel includi
-
2018-09-11status Pending Sale
-
2018-08-13$1,950,000 510-char remark
Show marketing remark (510 chars)
Recently updated 13 unit apartment complex located in Santa Maria just off Broadway Avenue, a major arterial. Property is located in close proximity to several local markets, restaurants and retail outlets. Alvin Elementary School and El Camino Junior High School are located within a third of a mile and the Santa Maria town center is located under a mile, placing this complex in a great location. The property provides 13 covered off-street parking places and has just completed an extensive remodel includi
-
2018-08-13$1,950,000 Active
Show marketing remark (510 chars)
Recently updated 13 unit apartment complex located in Santa Maria just off Broadway Avenue, a major arterial. Property is located in close proximity to several local markets, restaurants and retail outlets. Alvin Elementary School and El Camino Junior High School are located within a third of a mile and the Santa Maria town center is located under a mile, placing this complex in a great location. The property provides 13 covered off-street parking places and has just completed an extensive remodel includi
-
2017-04-04historical
-
2016-06-10soldstatus $1,500,000
-
2015-11-25soldstatus $1,500,000
-
2015-01-05$1,499,950
ⓘ Source: listings_history table (triggers on properties + properties_extension) + one-shot
backfill from property_details.listing_events for pre-trigger history.
Tax reassessment forecast CA · Resets to sale price
- Current annual tax
- $23,307 · $1,942/mo
- Projected year-2 tax
- $26,600 · $2,217/mo
- Expected delta
- +$3,293/yr (+$274/mo · 14.1%)
ⓘ Screening estimate from a state-policy table — verify with the county assessor before closing.
Climate risk First Street
- Flood 5/10 Major FEMA zone X (unshaded) · 24% chance over 30 yrs
- Wildfire 4/10 Moderate
- Heat 4/10 Moderate 7 d/yr ≥84°F today · 17 d/yr by 30 yrs out
- Wind 1/10 Low
- Air quality 6/10 Major 11 unhealthy d/yr today · 12 by 30 yrs out
Nearby sold comps map
Loading sold comps map…
Walkable amenities ~0.75 mi
Loading nearby amenities…
Taxation est. · year 1
- Rental income
- $293,052
- − Mortgage interest
- −$196,054
- − Property taxes
- −$23,307
- − Insurance
- −$17,500
- − Repairs & maintenance
- −$23,444
- − Management
- −$23,444
- − Depreciation
- −$101,818
- Taxable loss
- −$92,516
- Est. tax savings @ 24.0%
- +$22,204
- After-tax cash flow
- $-7,345/yr
For passive investors: Depreciation is non-cash, so a rental often shows a tax loss while cash-flowing — sheltering income. Rental losses are passive: they offset passive income freely, and up to $25,000/yr can offset ordinary (W-2) income if you actively participate and your MAGI is under $100k (phasing out to $0 by $150k); unused losses carry forward. On sale, claimed depreciation is recaptured at up to 25%, and gains may owe capital-gains tax (a 1031 exchange can defer both). Figures are a year-1 estimate at your 24.0% rate — not tax advice; consult a CPA.
Schools (NCES district)
- District
- Santa Maria-Bonita
- NCES district ID
- 0605580
- Math proficiency
- 26% ▲ 3.00%
- Reading proficiency
- 34% ▲ 3.00%
- Median HH income
- $50,959
- Composite
- 29.11/100
- National rank
- #11891
- State rank
- #1023 of 1400 in CA
Livability — Santa Maria
- Score
- 71/100
- State rank
- #202
- US rank
- #6519
Category grades
Schools grade is shown separately in the Schools card above.
Census & demographics
- Census place
- Santa Maria, CA
- County
- Santa Barbara County · 410,380 people
- City population
- 145,655
- Metro
- Santa Maria-Santa Barbara, CA
- Population (ZIP)
- 59,148
- Household income
- $75,257
- Rent vs Own
- Severe rent burden
- 2583.0
Population outlook (Santa Barbara County) Hauer SSP2
- Today (2025)
- 484,679 people
- By 2030
- 505,323 · +4.3%
- By 2040
- 545,783 · +12.6%
- By 2050
- 584,263 · +20.5%
- By 2075
- 682,586 · +40.8%
- By 2100
- 723,188 · +49.2%
Race, ethnicity, and origin ACS 2023
- Neighborhood character
- Predominantly Hispanic (87%)
- Race & ethnicity
- Hispanic / Latino 87% Two or more races 41% White 8% Asian 4% Native American 4%
- Hispanic origin (detail)
- Mexican 83%
- Common ancestry
- Lithuanian 1%
- Foreign-born
- 40% · Canada, Jamaica
- Languages at home
- 21% English-only · Spanish 72% Tagalog/Filipino 2% Other Asian/Pacific 1%
Political lean MEDSL · Santa Barbara
- 2024 margin
- Strong D (+26.7) · D 61.8% · R 35.1% · Other 3.1%
- 2008→2024 swing
- +3.8pp toward D · 2008: 22.9pp · 2024: 26.7pp
- All cycles
- 2024: D+26.7 2020: D+32.1 2016: D+28.2 2012: D+17.1 2008: D+22.9
Not yet ingested
- Civics
- —
Market trends
- HPI YoY
- ▼ -422.91%
- Current HPI
- 347.9281
- Rent YoY
- ▲ 2.31%
- Metro
- Santa Maria-Santa Barbara, CA
- State GDP YoY
- ▲ 3.21%
- F500 in state
- 116
Industry mix (Fortune 500 HQ in CA)
| Industry | F500 HQs | Revenue |
|---|---|---|
| Technology | 27 | $1,492B |
|
||
| Financial Services | 3 | $174B |
|
||
| Retail | 3 | $44B |
|
||
| Insurance | 3 | $26B |
|
||
| Media / Entertainment | 2 | $115B |
|
||
| Pharmaceuticals / Biotech | 2 | $62B |
|
||
Price history
+133.3% since first listed12 events — show timeline
- 2026-01-27 Listed $3,500,000 SBMLS
- 2026-01-27 Listed $3,500,000 NSBCRMLS
- 2018-11-13 Sold (Public Records) $1,860,000 Public Records
- 2018-11-09 Sold (MLS) $1,860,000 CRMLS
- 2018-11-09 Sold (MLS) $1,860,000 SDMLS
- 2018-09-11 Pending — CRMLS
- 2018-08-13 Listed $1,950,000 CRMLS
- 2018-08-13 Listed $1,950,000 SDMLS
- 2017-04-04 Listing Removed — NSBCRMLS
- 2016-06-10 Sold (Public Records) $1,500,000 Public Records
- 2015-11-25 Sold (Public Records) $1,500,000 Public Records
- 2015-01-05 Listed $1,499,950 NSBCRMLS
Property tax history
+13.4%/yrLatest (2025): $23,307 · +4.7% YoY. Source: county tax records.
Cash-flow waterfall
monthlySold comps — $/sqft
last 12 mo · ≤1 miLoading sold comps…