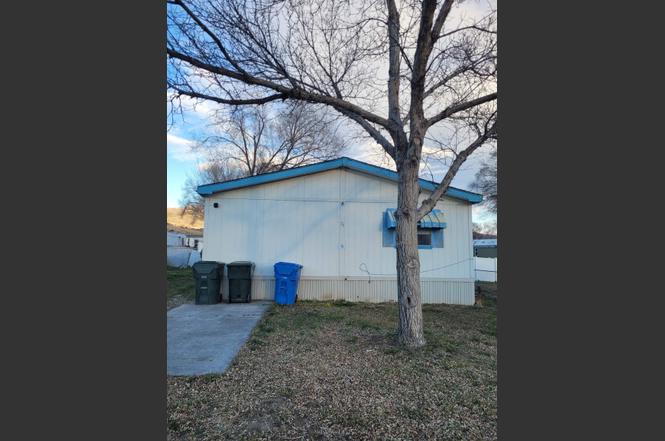
845 Barton Rd #79 Rd · Pocatello, ID
Flood risk 1/10 · Minimal
- FEMA flood zone
- X (unshaded)
- Chance of flooding over 30 yrs
- 0.0%
- Est. flood insurance / yr
- $473 – $860
Fire risk 9/10 · Severe
- Est. fire insurance / yr
- $584 – $1,086
Heat risk 4/10 · Minor
- Hot days now (above 93°F)
- 7 days/yr
- Hot days in 30 yrs
- 18 days/yr
Wind risk 1/10 · Minimal
- Chance of severe wind over 30 yrs
- —
Air-quality risk 4/10 · Minor
- Unhealthy air days now
- 5 days/yr
- Unhealthy air days in 30 yrs
- 6 days/yr
Risk factors via First Street. Map © Google.
Why this score? — see what drove the D grade
The composite is a weighted blend of 9 inputs, each scored 0–100. Each bar is that input's sub-score; the figure is the points it added to the 100-point composite (weight × sub-score).
- 1% rule +10.0/10.0
- Cash flow +7.6/30.0
- ARV discount +7.5/15.0
- Schools +4.3/10.0
- Livability +4.2/5.0
- Rent growth +3.5/5.0
- Condition / age +2.5/5.0
- DSCR +1.7/10.0
- Appreciation +0.0/10.0
$67,000
🖨 Deal sheet (PDF) 📄 Offer letter ✓ Due diligence
Listing remarks MLS
EASY TO SHOW. ALL APPLIANCES INCLUDED PLUS WASHER AND DRYER ALSO INCLUDES $3000.00 BULLY BARN. CLEA N, CLEAN, CLEAN. SPACE RENT AT THE TIME OF LISTING IS $180.00 PER MONTH.
Key facts
- Built 1999
- Listed 108 days
Property features AI
Finance
- HOA & community: Homeowners association with a $495 monthly fee
Exterior
- Utilities: Public water; Public sewer
- Home design: Manufactured home (manufactured without land); Residential property
- Construction: Wood siding construction; 999 above-grade finished area
- Exterior features: Located in the Cowboy Trailer Park subdivision
Interior
- Kitchen: Includes dishwasher, range, oven, refrigerator
- Bedrooms: 3 main-level bedrooms
- Bathrooms: 2 full bathrooms, both on the main level
- Heating & cooling: Electric forced-air heating
- Interior features: Dishwasher; Range; Oven; Refrigerator; Electric water heater
- Laundry & utility: Electric water heater
Neighborhood map
What this means for you Summary
Snapshot
- This is a 3-bed/2.0-bath single-family listed at $67k.
Deal economics
- At list price, monthly cash flow is $-81 ($-969/yr) — negative.
- To cash-flow at today's rent, offer at most $55k (17.4% below list).
- Meets the 1% rule at list price ($1k rent vs $67k).
- Recommended offer: $55k (17.4% below list) — sets the bar for cash-flow.
Location & tenants
- Location reads 84/100 on livability (#7 in ID, #758 nationally) — a professional / high-income tenant draw. Strengths: commute A+, cost of living A+, housing A+; Watch: amenities C-, employment D.
- Pocatello District (urban): math 45% / reading 58% proficiency, ranked #26 of 92 in ID (top 28%) — acceptable for families but not a draw, mixed tenant base, ~2y average lease.
- Zoned schools: Indian Hills Elementary School (math 44% / reading 60%, grade C-, #130 of 357 statewide, top 38%, 539 students, 42% FRL); Irving Middle School (math 33% / reading 54%, grade D, #60 of 109 statewide, top 56%, 712 students, 39% FRL); Century High School (math 41% / reading 71%, grade C, #24 of 169 statewide, top 14%, 1,092 students, 33% FRL) — zoned schools at 38% FRL track the district average.
- Market conditions: Rents rising fast (+4.0%/yr); 188 active listings in the ZIP; 325 units permitted in Bannock County in 2024 (6 in 5+ unit buildings).
Forward outlook
- Local home prices are declining (-3.0%/yr); year-one equity from $463 of loan paydown is wiped out by about $2k of value loss. Plan a longer hold.
Negotiation context
- It's been on market 108 days — a 9% lower offer ($61k) is reasonable based on typical stale-listing flexibility.
- 5 sale attempts since 27y ago; this cycle's ask has dropped $33k (33%) from the opening price — seller is motivated, your offer sets the floor, not the list.
Risks & watch-outs
- Watch-outs: HOA is 45% of rent.
- Climate carrying-cost: severe wildfire risk — expect insurance premiums to compound above CPI over the hold.
Questions for the listing agent
- What do current leases actually rent for vs. the listed asking? Can we see a recent rent roll and the last 12 months of T-12 income?
- It's been on market 108 days. Have you received any prior offers? Is the seller open to a 17% concession, seller financing, or rate buy-down credit?
- What does the HOA fee cover, when was the last increase, and are there any pending special assessments or reserve-fund shortfalls?
- Why hasn't it sold? Are there any deal-killer items the seller is aware of (foundation, flood, title, zoning, code violations)?
- Is there a deadline driving the sale (1031 exchange, divorce, estate, relocation)? That informs how much negotiation room exists.
- The area grade is low — what's the realistic commute time and amenity access for the typical tenant pool here? Any planned neighborhood developments (good or bad) we should know about?
- What's the average days-on-market for RENTAL listings here right now (not sales)? A rising rental-DOM trend means longer vacancies and softer asking-rent achievability than the comps imply.
- What's the recent tenant-quality profile in this submarket — average credit score on applications, eviction rate, late-payment / NSF rate, and stable-employment percentage? A property-management company in the area should have these aggregated.
- How much new for-sale + rental construction is in the pipeline within 1–3 miles? Heavy new supply typically softens prices + rents 12–24 months out; constrained supply supports both.
Investment metrics
- 1% rule
- 1.66% ✓
- Cap rate
- 4.85%
- Cash-on-cash
- -5.16%
- DSCR
- 0.77
- GRM
- 5.0
CMA / ARV
No comps found within radius.
Projected returns pro-forma
-3.0% appreciation · 4.01% rent growth · sell at horizon
- IRR
- -21.9%
- Equity multiple
- 0.23×
- Total profit
- $-14,538
- Equity at exit
- $9,990
- IRR
- -10.4%
- Equity multiple
- 0.30×
- Total profit
- $-13,201
- Equity at exit
- $5,793
Cash invested: $18,760 (down + closing). Projections, not guarantees.
Landlord ↔ Tenant lean methodology
- Overall (STATE)
- 91 Strongly Landlord-Friendly
- State Idaho
- 91 Strongly Landlord-Friendly · R+18
- County
- — inherits STATE
- City
- — inherits STATE
ZIP-level market 83204
- Rents YoY
- 4.0%
- Active inventory
- 188
- Price-to-rent
- 5.0×
Monthly cashflow live
- Estimated rent
- $1,110 medium interval (Pro) →
- Mortgage (P&I)
- −$351
- Tax est. 1.5%
- −$84 /mo · $1,005/yr
- Insurance
- −$28
- HOA
- −$495
- Vacancy / Maint / Mgmt
- −$233
- Net cashflow
- $-81
Break-even live
Sensitivity live
| Price | -10% $-34 | -5% $-58 | +0% $-81 | +5% $-104 | +10% $-127 |
|---|---|---|---|---|---|
| Rent | -10% $-168 | -5% $-125 | +0% $-81 | +5% $-37 | +10% $7 |
| Rate | -1.0pp $-47 | -0.5pp $-64 | base $-81 | +0.5pp $-98 | +1.0pp $-116 |
UW: 25.0% down · 7.5% · 30yr · 1.5% tax · 5.0% vac · 8.0% maint · 8.0% mgmt
Financing live
Cash to close
- Down payment
- $16,750
- Closing costs
- $2,010
- Reserves months
- —
- Total cash needed
- —
Loan-product check · same deal, 3 products live
Conventional
25% down · 7.5% · 30yr
- Down + closing
- —
- Monthly P&I
- —
- Monthly cashflow
- —
- DSCR
- —
- Eligible?
- —
Personal DTI + credit; lowest rate.
DSCR
20% down · 8.5% · 30yr
- Down + closing
- —
- Monthly P&I
- —
- Monthly cashflow
- —
- DSCR
- —
- Eligible?
- —
No personal income docs; deal must DSCR.
Hard money
10% down · 12.0% · 12mo
- Down + closing
- —
- Monthly P&I
- —
- Monthly cashflow
- —
- DSCR
- —
- Eligible?
- —
Short-term bridge; refi at stabilization.
HOA detail
- Monthly dues
- $495 · $5,940/yr
Listing history 28 events
-
2026-06-22days on market $67,000 Active 108 DOM
-
2026-06-19days on market $67,000 Active 106 DOM
-
2026-06-18days on market $67,000 Active 105 DOM
-
2026-06-17days on market $67,000 Active 104 DOM
-
2026-06-16days on market $67,000 Active 103 DOM
-
2026-06-15days on market $67,000 Active 102 DOM
-
2026-06-14days on market $67,000 Active 100 DOM
-
2026-06-13days on market $67,000 Active 99 DOM
-
2026-06-10days on market $67,000 Active 97 DOM
-
2026-06-09days on market $67,000 Active 96 DOM
-
2026-06-08days on market $67,000 Active 95 DOM
-
2026-06-07days on market $67,000 Active 94 DOM
-
2026-06-03days on market $67,000 Active 90 DOM
-
2026-06-02days on market $67,000 Active 89 DOM
-
2026-06-01days on market $67,000 Active 88 DOM
-
2026-05-31days on market $67,000 Active 87 DOM
-
2026-05-30days on market $67,000 Active 86 DOM
-
2026-03-13price $67,000
-
2026-03-06$100,000 Active
-
2026-03-02historical $1,250
-
2025-10-24$1,250
-
2024-08-23historical $1,250
-
2024-08-06$1,250
-
2024-07-25historical $1,250
-
2024-07-24$1,250
-
2022-12-02historical
-
1999-05-20soldstatus 172-char remark
Show marketing remark (172 chars)
EASY TO SHOW. ALL APPLIANCES INCLUDED PLUS WASHER AND DRYER ALSO INCLUDES $3000.00 BULLY BARN. CLEA N, CLEAN, CLEAN. SPACE RENT AT THE TIME OF LISTING IS $180.00 PER MONTH.
-
1999-03-02$15,500 172-char remark
Show marketing remark (172 chars)
EASY TO SHOW. ALL APPLIANCES INCLUDED PLUS WASHER AND DRYER ALSO INCLUDES $3000.00 BULLY BARN. CLEA N, CLEAN, CLEAN. SPACE RENT AT THE TIME OF LISTING IS $180.00 PER MONTH.
ⓘ Source: listings_history table (triggers on properties + properties_extension) + one-shot
backfill from property_details.listing_events for pre-trigger history.
Climate risk First Street
- Flood 1/10 Low FEMA zone X (unshaded) · 0% chance over 30 yrs
- Wildfire 9/10 Extreme
- Heat 4/10 Moderate 7 d/yr ≥93°F today · 18 d/yr by 30 yrs out
- Wind 1/10 Low
- Air quality 4/10 Moderate 5 unhealthy d/yr today · 6 by 30 yrs out
Nearby sold comps map
Loading sold comps map…
Walkable amenities ~0.75 mi
Loading nearby amenities…
Taxation est. · year 1
- Rental income
- $13,326
- − Mortgage interest
- −$3,753
- − Property taxes
- −$1,005
- − Insurance
- −$335
- − Repairs & maintenance
- −$1,066
- − Management
- −$1,066
- − HOA
- −$5,940
- − Depreciation
- −$1,949
- Taxable loss
- −$1,788
- Est. tax savings @ 24.0%
- +$429
- After-tax cash flow
- $-540/yr
For passive investors: Depreciation is non-cash, so a rental often shows a tax loss while cash-flowing — sheltering income. Rental losses are passive: they offset passive income freely, and up to $25,000/yr can offset ordinary (W-2) income if you actively participate and your MAGI is under $100k (phasing out to $0 by $150k); unused losses carry forward. On sale, claimed depreciation is recaptured at up to 25%, and gains may owe capital-gains tax (a 1031 exchange can defer both). Figures are a year-1 estimate at your 24.0% rate — not tax advice; consult a CPA.
Schools (NCES district)
- District
- Pocatello District
- NCES district ID
- 1602640
- Math proficiency
- 45% ▼ -6.00%
- Reading proficiency
- 58% ▼ -1.00%
- Median HH income
- $44,478
- Composite
- 43.46/100
- National rank
- #3003
- State rank
- #26 of 92 in ID
Livability — Pocatello
- Score
- 84/100
- State rank
- #7
- US rank
- #758
Category grades
Schools grade is shown separately in the Schools card above.
Census & demographics
- Census place
- Pocatello, ID
- County
- Bannock County · 82,995 people
- City population
- 58,482
- Metro
- Pocatello, ID
- Population (ZIP)
- 18,580
- Household income
- $57,146
- Rent vs Own
- Severe rent burden
- 435.0
Population outlook (Bannock County) Hauer SSP2
- Today (2025)
- 86,173 people
- By 2030
- 86,575 · +0.5%
- By 2040
- 86,235 · +0.1%
- By 2050
- 86,090 · -0.1%
- By 2075
- 85,032 · -1.3%
- By 2100
- 85,103 · -1.2%
Race, ethnicity, and origin ACS 2023
- Neighborhood character
- Predominantly White (84%)
- Race & ethnicity
- White 84% Two or more races 7% Hispanic / Latino 7% Native American 3% Black 1%
- Hispanic origin (detail)
- Mexican 5%
- Common ancestry
- Portuguese 4% Slovak 3% Italian 2%
- Foreign-born
- 2% · Canada
- Languages at home
- 95% English-only · Spanish 3% Other Indo-European 1% German/W. Germanic 1%
Political lean MEDSL · Bannock
- 2024 margin
- Strong R (+25.1) · D 35.8% · R 60.9% · Other 3.3%
- 2008→2024 swing
- -12.1pp toward R · 2008: -13.0pp · 2024: -25.1pp
- All cycles
- 2024: R+25.1 2020: R+21.9 2016: R+20.5 2012: R+22.1 2008: R+13.0
Not yet ingested
- Civics
- —
Market trends
- HPI YoY
- ▼ -151.01%
- Current HPI
- 232.7208
- Rent YoY
- ▲ 4.01%
- Metro
- Pocatello, ID
- State GDP YoY
- ▲ 4.51%
- F500 in state
- 6
Industry mix (Fortune 500 HQ in ID)
| Industry | F500 HQs | Revenue |
|---|---|---|
| Retail | 1 | $79B |
|
||
| Technology | 1 | $25B |
|
||
| Food / Agriculture | 1 | $6B |
|
||
Price history
+332.3% since first listed11 events — show timeline
- 2026-03-13 Price Changed $67,000 PCTMLS
- 2026-03-06 Listed $100,000 PCTMLS
- 2026-03-02 Rental Removed $1,250 APPFOLIO
- 2025-10-24 Listed for Rent $1,250 APPFOLIO
- 2024-08-23 Rental Removed $1,250 APPFOLIO
- 2024-08-06 Listed for Rent $1,250 APPFOLIO
- 2024-07-25 Rental Removed $1,250 APPFOLIO
- 2024-07-24 Listed for Rent $1,250 APPFOLIO
- 2022-12-02 Rental Removed — RENT.
- 1999-05-20 Sold (MLS) — SRMLS
- 1999-03-02 Listed $15,500 SRMLS
Cash-flow waterfall
monthlySold comps — $/sqft
last 12 mo · ≤1 miLoading sold comps…