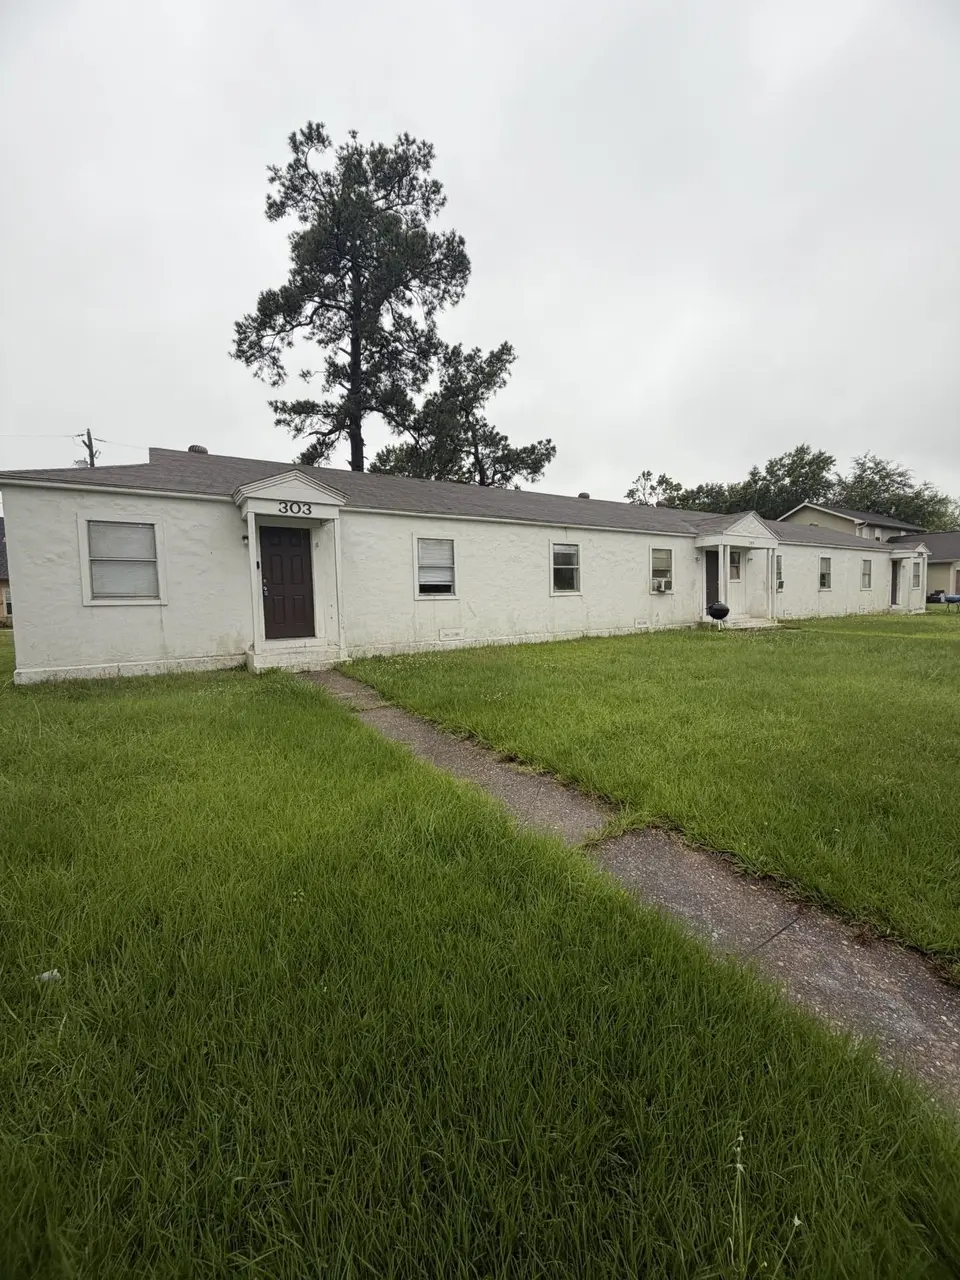
303 W Dewey Ave · Orange, TX
Flood risk 8/10 · Major
- FEMA flood zone
- X (shaded)
- Chance of flooding over 30 yrs
- 0.96%
- Est. flood insurance / yr
- $507 – $1,088
Fire risk 2/10 · Minimal
- Est. fire insurance / yr
- $1,222 – $2,270
Heat risk 9/10 · Severe
- Hot days now (above 109°F)
- 7 days/yr
- Hot days in 30 yrs
- 24 days/yr
Wind risk 9/10 · Severe
- Chance of severe wind over 30 yrs
- 99.0%
Air-quality risk 3/10 · Minor
- Unhealthy air days now
- 2 days/yr
- Unhealthy air days in 30 yrs
- 3 days/yr
Risk factors via First Street. Map © Google.
Why this score? — see what drove the D grade
The composite is a weighted blend of 9 inputs, each scored 0–100. Each bar is that input's sub-score; the figure is the points it added to the 100-point composite (weight × sub-score).
- Cash flow +11.9/30.0
- ARV discount +7.5/15.0
- Appreciation +5.5/10.0
- Rent growth +3.9/5.0
- 1% rule +3.8/10.0
- Livability +3.6/5.0
- DSCR +3.5/10.0
- Condition / age +2.5/5.0
- Schools +1.6/10.0
$199,000
🖨 Deal sheet (PDF) 📄 Offer letter ✓ Due diligence
Listing remarks MLS
Investor -ready triplex offering exceptional cash flow potential in Orange , Texas. This unique multi-family opportunity features THREE separately metered units totaling10 bedrooms, including one 4 bedroom/1-bath units. Strong fit for traditional or section 8 investors seeking high yield potential. Recent improvements include updated plank flooring, interior repainting, serviced HVAC systems , updated window glass, and newer roof approximately within 10 years per seller. Units feature laundry hookups, appliances. separate electric, water, gas meters, and ample out door space. One unit is currently occupied at $1200 /month with projected gross rental income exceeding $4500/month. Previous Sec 8 occupancy history provides flexibility for voucher backed rental strategies. Opportunities with this bedroom count and income potential at this price point are increasingly hard to find. Ideal for local investors or out of state cash flow buyers, or buyers looking to expand portfolio.
Key facts
- Listed 64 days
Neighborhood map
What this means for you Summary
Snapshot
- This is a 9-bed/?-bath other listed at $199k.
Deal economics
- At list price, monthly cash flow is $-117 ($-1k/yr) — negative.
- To cash-flow at today's rent, offer at most $178k (10.3% below list).
- To meet the 1% rule (rent ≥ 1% of price), the offer needs to be $175k (11.9% below list).
- Recommended offer: $175k (11.9% below list) — sets the bar for 1% rule.
- Cap rate 6.0% vs local median 3.9% in Orange — top-decile yield for the area; either an underpriced asset or a hidden risk that comps aren't pricing in. Stress-test before assuming the spread holds.
Location & tenants
- Location reads 71/100 on livability (#286 in TX) — a middle-class / working-renter tenant base. Strengths: cost of living A+, housing A+, health & safety A+; Watch: crime D+, employment D+, schools D-.
- West Orange-Cove CISD (suburban): math 17% / reading 21% proficiency, ranked #784 of 826 in TX (top 95%) — low school quality limits family demand, transient renter base, plan for 1-2y turnover; 79% free/reduced lunch — lower-income household profile, screen leases tightly.
- Market conditions: Rents rising fast (+5.7%/yr); 337 active listings in the ZIP; 235 units permitted in Orange County in 2024 (50 in 5+ unit buildings).
- This rent runs 33% of the median local income ($64k/yr) — at the standard rent-burdened threshold; future hikes will face affordability resistance.
Forward outlook
- In year one you build about $3k of equity ($1k loan paydown + $2k appreciation (1.0% local appreciation)).
- Orange County population projected at +6% by 2050 — modest demand growth; plan on rents tracking national, not racing it.
- By year 9, paydown + projected appreciation supports a ~$31k cash-out refi (75% LTV) — recoverable capital for the next deal without selling this one.
Negotiation context
- It's been on market 64 days — a 6% lower offer ($187k) is reasonable based on typical stale-listing flexibility.
- 4 sale attempts since 13y ago with the ask held roughly flat each time — persistent listings suggest the price (not the market) is what's stuck; bring a comps-based counter.
Risks & watch-outs
- Watch-outs: flood insurance adds $66/mo; built in 1941 — expect roof / HVAC / electrical / plumbing capex.
- Climate carrying-cost: severe flood risk; severe wind risk, 99% chance of damaging wind over 30y; extreme-heat days projected 7→24/yr by 2055 (HVAC capex compounding) — expect insurance premiums to compound above CPI over the hold.
Questions for the listing agent
- What do current leases actually rent for vs. the listed asking? Can we see a recent rent roll and the last 12 months of T-12 income?
- It's been on market 64 days. Have you received any prior offers? Is the seller open to a 12% concession, seller financing, or rate buy-down credit?
- Built in 1941 — when were the roof, HVAC, electrical panel, plumbing, and water heater last replaced?
- What's the actual annual flood-insurance premium (NFIP or private), and is the property in a SFHA with mandatory coverage?
- Why hasn't it sold? Are there any deal-killer items the seller is aware of (foundation, flood, title, zoning, code violations)?
- Is there a deadline driving the sale (1031 exchange, divorce, estate, relocation)? That informs how much negotiation room exists.
- Schools are D-rated, which usually means shorter tenancies and higher turnover. Who's the typical renter profile here, and what's been the actual vacancy rate?
- Crime grade is D in this area — have there been break-ins, vandalism, or insurance claims at this property in the last 3 years? What carrier currently insures it and at what premium?
- The area grade is low — what's the realistic commute time and amenity access for the typical tenant pool here? Any planned neighborhood developments (good or bad) we should know about?
- What's the average days-on-market for RENTAL listings here right now (not sales)? A rising rental-DOM trend means longer vacancies and softer asking-rent achievability than the comps imply.
- What's the recent tenant-quality profile in this submarket — average credit score on applications, eviction rate, late-payment / NSF rate, and stable-employment percentage? A property-management company in the area should have these aggregated.
- How much new for-sale + rental construction is in the pipeline within 1–3 miles? Heavy new supply typically softens prices + rents 12–24 months out; constrained supply supports both.
Investment metrics
- 1% rule
- 0.88% ✗
- Cap rate
- 5.99%
- Cash-on-cash
- -1.08%
- DSCR
- 0.95
- GRM
- 9.5
CMA / ARV
No comps found within radius.
Projected returns pro-forma
1.01% appreciation · 5.71% rent growth · sell at horizon
- IRR
- 0.5%
- Equity multiple
- 1.03×
- Total profit
- $1,409
- Equity at exit
- $68,038
- IRR
- 7.0%
- Equity multiple
- 1.91×
- Total profit
- $50,881
- Equity at exit
- $90,496
Cash invested: $55,720 (down + closing). Projections, not guarantees.
Landlord ↔ Tenant lean methodology
- Overall (STATE)
- 87 Strongly Landlord-Friendly
- State Texas
- 87 Strongly Landlord-Friendly · R+5
- County
- — inherits STATE
- City
- — inherits STATE
ZIP-level market 77630
- Home prices YoY
- 0.4%
- Rents YoY
- 5.7%
- Active inventory
- 337
- Price-to-rent
- 9.5×
Monthly cashflow live
- Estimated rent
- $1,753 medium interval (Pro) →
- Mortgage (P&I)
- −$1,044
- Tax from tax record
- −$309 /mo · $3,704/yr
- Insurance
- −$83
- Flood insurance flood zone
- −$66 /mo · $798/yr
- HOA
- −$0
- Vacancy / Maint / Mgmt
- −$368
- Net cashflow
- $-117
Break-even live
Sensitivity live
| Price | -10% $-4 | -5% $-60 | +0% $-117 | +5% $-173 | +10% $-229 |
|---|---|---|---|---|---|
| Rent | -10% $-255 | -5% $-186 | +0% $-117 | +5% $-47 | +10% $22 |
| Rate | -1.0pp $-16 | -0.5pp $-66 | base $-117 | +0.5pp $-168 | +1.0pp $-221 |
UW: 25.0% down · 7.5% · 30yr · 1.5% tax · 5.0% vac · 8.0% maint · 8.0% mgmt
Financing live
Cash to close
- Down payment
- $49,750
- Closing costs
- $5,970
- Reserves months
- —
- Total cash needed
- —
Loan-product check · same deal, 3 products live
Conventional
25% down · 7.5% · 30yr
- Down + closing
- —
- Monthly P&I
- —
- Monthly cashflow
- —
- DSCR
- —
- Eligible?
- —
Personal DTI + credit; lowest rate.
DSCR
20% down · 8.5% · 30yr
- Down + closing
- —
- Monthly P&I
- —
- Monthly cashflow
- —
- DSCR
- —
- Eligible?
- —
No personal income docs; deal must DSCR.
Hard money
10% down · 12.0% · 12mo
- Down + closing
- —
- Monthly P&I
- —
- Monthly cashflow
- —
- DSCR
- —
- Eligible?
- —
Short-term bridge; refi at stabilization.
Listing history 27 events
-
2026-06-18days on market $199,000 Active 64 DOM
-
2026-06-17days on market $199,000 Active 63 DOM
-
2026-06-16days on market $199,000 Active 62 DOM
-
2026-06-15days on market $199,000 Active 61 DOM
-
2026-06-14days on market $199,000 Active 59 DOM
-
2026-06-13days on market $199,000 Active 58 DOM
-
2026-06-10days on market $199,000 Active 56 DOM
-
2026-06-09days on market $199,000 Active 55 DOM
-
2026-06-08days on market $199,000 Active 54 DOM
-
2026-06-07days on market $199,000 Active 53 DOM
-
2026-06-03days on market $199,000 Active 49 DOM
-
2026-06-02days on market $199,000 Active 48 DOM
-
2026-06-01days on market $199,000 Active 47 DOM
-
2026-05-31days on market $199,000 Active 46 DOM
-
2026-05-30days on market $199,000 Active 45 DOM
-
2026-04-15$199,000 Active 988-char remark
Show marketing remark (988 chars)
Investor -ready triplex offering exceptional cash flow potential in Orange , Texas. This unique multi-family opportunity features THREE separately metered units totaling10 bedrooms, including one 4 bedroom/1-bath units. Strong fit for traditional or section 8 investors seeking high yield potential. Recent improvements include updated plank flooring, interior repainting, serviced HVAC systems , updated window glass, and newer roof approximately within 10 years per seller. Units feature laundry hookups, appliances. separate electric, water, gas meters, and ample out door space. One unit is currently occupied at $1200 /month with projected gross rental income exceeding $4500/month. Previous Sec 8 occupancy history provides flexibility for voucher backed rental strategies. Opportunities with this bedroom count and income potential at this price point are increasingly hard to find. Ideal for local investors or out of state cash flow buyers, or buyers looking to expand portfolio.
-
2024-09-11soldstatus Closed 247-char remark
Show marketing remark (247 chars)
Opportunity to own 3 units Totaling 10 Beds / 3 Baths * * * (Triplex - 303 Dewey--4 Bed 1 Bath, 305 Dewey---3 Bed 1 Bath, 309 Dewey--- 3 Bed 1 Bath), The property has a new roof, fresh exterior paint, updated cabinets, electrical, and flooring.
-
2024-09-11soldstatus
Show marketing remark (247 chars)
Opportunity to own 3 units Totaling 10 Beds / 3 Baths * * * (Triplex - 303 Dewey--4 Bed 1 Bath, 305 Dewey---3 Bed 1 Bath, 309 Dewey--- 3 Bed 1 Bath), The property has a new roof, fresh exterior paint, updated cabinets, electrical, and flooring.
-
2024-08-12status Pending 247-char remark
Show marketing remark (247 chars)
Opportunity to own 3 units Totaling 10 Beds / 3 Baths * * * (Triplex - 303 Dewey--4 Bed 1 Bath, 305 Dewey---3 Bed 1 Bath, 309 Dewey--- 3 Bed 1 Bath), The property has a new roof, fresh exterior paint, updated cabinets, electrical, and flooring.
-
2024-07-10status Active 247-char remark
Show marketing remark (247 chars)
Opportunity to own 3 units Totaling 10 Beds / 3 Baths * * * (Triplex - 303 Dewey--4 Bed 1 Bath, 305 Dewey---3 Bed 1 Bath, 309 Dewey--- 3 Bed 1 Bath), The property has a new roof, fresh exterior paint, updated cabinets, electrical, and flooring.
-
2024-07-08price $144,990 247-char remark
Show marketing remark (247 chars)
Opportunity to own 3 units Totaling 10 Beds / 3 Baths * * * (Triplex - 303 Dewey--4 Bed 1 Bath, 305 Dewey---3 Bed 1 Bath, 309 Dewey--- 3 Bed 1 Bath), The property has a new roof, fresh exterior paint, updated cabinets, electrical, and flooring.
-
2024-04-03status Pending 247-char remark
Show marketing remark (247 chars)
Opportunity to own 3 units Totaling 10 Beds / 3 Baths * * * (Triplex - 303 Dewey--4 Bed 1 Bath, 305 Dewey---3 Bed 1 Bath, 309 Dewey--- 3 Bed 1 Bath), The property has a new roof, fresh exterior paint, updated cabinets, electrical, and flooring.
-
2024-02-19price $199,990 247-char remark
Show marketing remark (247 chars)
Opportunity to own 3 units Totaling 10 Beds / 3 Baths * * * (Triplex - 303 Dewey--4 Bed 1 Bath, 305 Dewey---3 Bed 1 Bath, 309 Dewey--- 3 Bed 1 Bath), The property has a new roof, fresh exterior paint, updated cabinets, electrical, and flooring.
-
2024-01-30price $239,990 247-char remark
Show marketing remark (247 chars)
Opportunity to own 3 units Totaling 10 Beds / 3 Baths * * * (Triplex - 303 Dewey--4 Bed 1 Bath, 305 Dewey---3 Bed 1 Bath, 309 Dewey--- 3 Bed 1 Bath), The property has a new roof, fresh exterior paint, updated cabinets, electrical, and flooring.
-
2023-09-30historical
-
2023-07-31$249,990 Active 247-char remark
Show marketing remark (247 chars)
Opportunity to own 3 units Totaling 10 Beds / 3 Baths * * * (Triplex - 303 Dewey--4 Bed 1 Bath, 305 Dewey---3 Bed 1 Bath, 309 Dewey--- 3 Bed 1 Bath), The property has a new roof, fresh exterior paint, updated cabinets, electrical, and flooring.
-
2013-09-13$45,000
ⓘ Source: listings_history table (triggers on properties + properties_extension) + one-shot
backfill from property_details.listing_events for pre-trigger history.
Tax reassessment forecast TX · Resets to sale price
- Current annual tax
- $3,704 · $309/mo
- Projected year-2 tax
- $3,704 · $309/mo
- Expected delta
- $0/yr ($0/mo · 0.0%)
ⓘ Screening estimate from a state-policy table — verify with the county assessor before closing.
Climate risk First Street
- Flood 8/10 Severe FEMA zone X (shaded) · 96% chance over 30 yrs
- Wildfire 2/10 Low
- Heat 9/10 Extreme 7 d/yr ≥109°F today · 24 d/yr by 30 yrs out
- Wind 9/10 Extreme 99% chance of damaging wind over 30 yrs
- Air quality 3/10 Moderate 2 unhealthy d/yr today · 3 by 30 yrs out
Nearby sold comps map
Loading sold comps map…
Walkable amenities ~0.75 mi
Loading nearby amenities…
Taxation est. · year 1
- Rental income
- $21,039
- − Mortgage interest
- −$11,147
- − Property taxes
- −$3,704
- − Insurance
- −$1,792
- − Repairs & maintenance
- −$1,683
- − Management
- −$1,683
- − Depreciation
- −$5,789
- Taxable loss
- −$4,760
- Est. tax savings @ 24.0%
- +$1,142
- After-tax cash flow
- $-256/yr
For passive investors: Depreciation is non-cash, so a rental often shows a tax loss while cash-flowing — sheltering income. Rental losses are passive: they offset passive income freely, and up to $25,000/yr can offset ordinary (W-2) income if you actively participate and your MAGI is under $100k (phasing out to $0 by $150k); unused losses carry forward. On sale, claimed depreciation is recaptured at up to 25%, and gains may owe capital-gains tax (a 1031 exchange can defer both). Figures are a year-1 estimate at your 24.0% rate — not tax advice; consult a CPA.
Schools (NCES district)
- District
- West Orange-Cove CISD
- NCES district ID
- 4845090
- Math proficiency
- 17% ▼ -7.00%
- Reading proficiency
- 21% ▼ -2.00%
- Median HH income
- $37,329
- Composite
- 15.86/100
- National rank
- #9260
- State rank
- #784 of 826 in TX
Livability — Orange
- Score
- 71/100
- State rank
- #286
- US rank
- #6456
Category grades
Schools grade is shown separately in the Schools card above.
Census & demographics
- Census place
- Orange, TX
- County
- Orange County · 87,112 people
- City population
- 22,976
- Metro
- Beaumont-Port Arthur, TX
- Population (ZIP)
- 28,983
- Household income
- $64,373
- Rent vs Own
- Severe rent burden
- 1018.0
Population outlook (Orange County) Hauer SSP2
- Today (2025)
- 88,065 people
- By 2030
- 89,591 · +1.7%
- By 2040
- 91,982 · +4.4%
- By 2050
- 93,023 · +5.6%
- By 2075
- 94,871 · +7.7%
- By 2100
- 88,155 · +0.1%
Race, ethnicity, and origin ACS 2023
- Neighborhood character
- Majority White (64%)
- Race & ethnicity
- White 64% Black 21% Hispanic / Latino 11% Two or more races 9%
- Hispanic origin (detail)
- Mexican 7%
- Common ancestry
- Lithuanian 13% Italian 1% Slovak 1%
- Foreign-born
- 5% · Canada
- Languages at home
- 91% English-only · Spanish 7% French/Haitian/Cajun 1% Other Asian/Pacific 1%
Political lean MEDSL · Orange
- 2024 margin
- Solid R (+66.8) · D 16.4% · R 83.1%
- 2008→2024 swing
- -19.6pp toward R · 2008: -47.1pp · 2024: -66.8pp
- All cycles
- 2024: R+66.8 2020: R+63.4 2016: R+61.9 2012: R+54.3 2008: R+47.1
Not yet ingested
- Civics
- —
Market trends
- HPI YoY
- ▲ 1.01%
- Current HPI
- 264.14
- Rent YoY
- ▲ 5.71%
- Metro
- Beaumont-Port Arthur, TX
- State GDP YoY
- ▲ 3.95%
- F500 in state
- 110
Industry mix (Fortune 500 HQ in TX)
| Industry | F500 HQs | Revenue |
|---|---|---|
| Energy | 16 | $1,198B |
|
||
| Technology | 5 | $198B |
|
||
| Engineering / Construction | 4 | $72B |
|
||
| Energy Services | 3 | $60B |
|
||
| Utilities | 3 | $41B |
|
||
| Healthcare | 2 | $330B |
|
||
Price history
+342.2% since first listed12 events — show timeline
- 2026-04-15 Listed $199,000 BBOR
- 2024-09-11 Sold (Public Records) — Public Records
- 2024-09-11 Sold (MLS) — BBOR
- 2024-08-12 Pending — BBOR
- 2024-07-10 Relisted — BBOR
- 2024-07-08 Price Changed $144,990 BBOR
- 2024-04-03 Pending — BBOR
- 2024-02-19 Price Changed $199,990 BBOR
- 2024-01-30 Price Changed $239,990 BBOR
- 2023-09-30 Delisted — BBOR
- 2023-07-31 Listed $249,990 BBOR
- 2013-09-13 Listed $45,000 BBOR
Property tax history
+10.6%/yrLatest (2025): $3,704 · -23.3% YoY. Source: county tax records.
Cash-flow waterfall
monthlySold comps — $/sqft
last 12 mo · ≤1 miLoading sold comps…