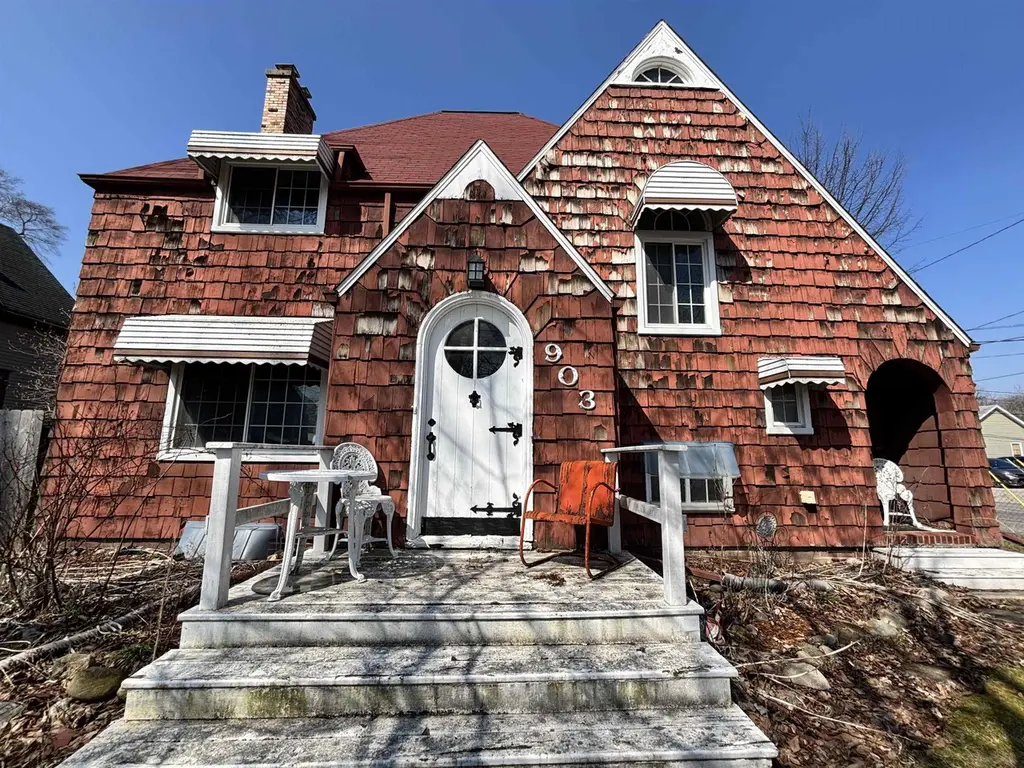
903 S Michigan Ave · Saginaw, MI
Flood risk 1/10 · Minimal
- FEMA flood zone
- X (unshaded)
- Chance of flooding over 30 yrs
- 0.0%
- Est. flood insurance / yr
- $473 – $860
Fire risk 1/10 · Minimal
- Est. fire insurance / yr
- $784 – $1,456
Heat risk 2/10 · Minimal
- Hot days now (above 100°F)
- 7 days/yr
- Hot days in 30 yrs
- 14 days/yr
Wind risk 1/10 · Minimal
- Chance of severe wind over 30 yrs
- —
Air-quality risk 2/10 · Minimal
- Unhealthy air days now
- 1 days/yr
- Unhealthy air days in 30 yrs
- 2 days/yr
Risk factors via First Street. Map © Google.
Why this score? — see what drove the B grade
The composite is a weighted blend of 9 inputs, each scored 0–100. Each bar is that input's sub-score; the figure is the points it added to the 100-point composite (weight × sub-score).
- Cash flow +30.0/30.0
- 1% rule +10.0/10.0
- DSCR +10.0/10.0
- ARV discount +9.5/15.0
- Rent growth +3.5/5.0
- Livability +3.2/5.0
- Condition / age +2.5/5.0
- Schools +2.0/10.0
- Appreciation +0.0/10.0
$77,700
🖨 Deal sheet 📄 Offer letter ✓ Due diligence
Listing remarks MLS
Home or Office- zoned for both! 3 large bedrooms with hardwood floors, 1.5 baths, dining room, large living room with a fireplace, a small den or study, open staircase, 3 entrances, full basement with plenty of storage area plus a newer boiler and water heater. Wonderful opportunity for a family, attorney or an accountant. Call today! Bank owned.
Key facts
- Classic staircase
- Unfinished basement
- Vintage cabinets
Tags
Property features AI
Exterior
- Parking: Detached 2-car garage (20 x 20); Paved driveway
- Utilities: Public water; Public sanitary sewer; Natural gas service
- Home design: Residential 2-story structure; Built in 1927; Facing road
- Construction: Block foundation; Full basement
- Exterior features: Cedar exterior; Front porch; Corner lot within city limits; Shed outbuilding; Road frontage
Interior
- Kitchen: Main-level kitchen (9 x 19) with linoleum flooring
- Bedrooms: Main-level primary bedroom (13 x 11) with wood flooring; Second-level bedroom (12 x 12) with wood flooring; Second-level bedroom (approx. 7' width) with wood flooring
- Flooring: Wood flooring in bedrooms and dining room; Carpet in living room; Linoleum in kitchen
- Bathrooms: One full bathroom; One lavatory (two total baths/lavatories)
- Heating & cooling: Boiler heating; Natural gas fuel; Gas water heater
- Interior features: Living room with fireplace; Den/Study/Library; Formal dining room; Total of 8 rooms; Full basement (block foundation)
- Laundry & utility: Basement utility space
Neighborhood map
What this means for you Summary
Snapshot
- This is a 3-bed/1.5-bath single-family listed at $78k.
Deal economics
- At list price, monthly cash flow is $376 ($5k/yr) — positive.
- The deal already cash-flows at list — no discount required.
- Meets the 1% rule at list price ($1k rent vs $78k).
- Recommended offer: $73k (6.0% below list) — sets the bar for market timing.
- Cap rate 12.1% vs local median 8.3% in Saginaw — top-decile yield for the area; either an underpriced asset or a hidden risk that comps aren't pricing in. Stress-test before assuming the spread holds.
Location & tenants
- Location reads 63/100 on livability (#521 in MI) — a middle-class / working-renter tenant base. Strengths: cost of living A+, housing A+, health & safety A+; Watch: crime F, amenities F, commute F.
- Saginaw School District (urban): math 20% / reading 29% proficiency, ranked #444 of 540 in MI (top 82%) — low school quality limits family demand, transient renter base, plan for 1-2y turnover; 76% free/reduced lunch — lower-income household profile, screen leases tightly.
- Zoned schools: Merrill Park Elementary School (math 5% / reading 5%, grade F, #1,325 of 1,397 statewide, top 99%, 321 students, 98% FRL) — zoned schools average 98% FRL vs 76% district-wide (22 pts higher); higher-poverty schools than district average — tighter screening recommended.
- Zoned-school proficiency averages 5% at this address vs 24% district-wide (-20 pts) — the specific schools serving this property underperform the Saginaw School District average; the district grade overstates school quality for this exact location.
- Market conditions: Rents rising (+4.0%/yr); 250 active listings in the ZIP; 154 units permitted in Saginaw County in 2024 (0 in 5+ unit buildings).
Forward outlook
- Local home prices are declining (-3.0%/yr); year-one equity from $537 of loan paydown is wiped out by about $2k of value loss. Plan a longer hold.
- Saginaw County population projected at -25% by 2050 — secular population decline; favor cash flow + early exit over multi-decade hold.
- At projected returns (-3.0% appreciation + 4.0% rent growth), your $22k cash investment doubles in ~6 years — after that, you're playing with house money.
Negotiation context
- It's been on market 83 days — a 6% lower offer ($73k) is reasonable based on typical stale-listing flexibility.
- 8 sale attempts since 23y ago with the ask held roughly flat each time — persistent listings suggest the price (not the market) is what's stuck; bring a comps-based counter.
Risks & watch-outs
- Watch-outs: built in 1927 — expect roof / HVAC / electrical / plumbing capex.
Questions for the listing agent
- It's been on market 83 days. Have you received any prior offers? Is the seller open to a 6% concession, seller financing, or rate buy-down credit?
- Built in 1927 — when were the roof, HVAC, electrical panel, plumbing, and water heater last replaced?
- Why hasn't it sold? Are there any deal-killer items the seller is aware of (foundation, flood, title, zoning, code violations)?
- Is there a deadline driving the sale (1031 exchange, divorce, estate, relocation)? That informs how much negotiation room exists.
- Schools are F-rated, which usually means shorter tenancies and higher turnover. Who's the typical renter profile here, and what's been the actual vacancy rate?
- Crime grade is F in this area — have there been break-ins, vandalism, or insurance claims at this property in the last 3 years? What carrier currently insures it and at what premium?
- What's the average days-on-market for RENTAL listings here right now (not sales)? A rising rental-DOM trend means longer vacancies and softer asking-rent achievability than the comps imply.
- What's the recent tenant-quality profile in this submarket — average credit score on applications, eviction rate, late-payment / NSF rate, and stable-employment percentage? A property-management company in the area should have these aggregated.
- How much new for-sale + rental construction is in the pipeline within 1–3 miles? Heavy new supply typically softens prices + rents 12–24 months out; constrained supply supports both.
Investment metrics
- 1% rule
- 1.50% ✓
- Cap rate
- 12.10%
- Cash-on-cash
- 20.74%
- DSCR
- 1.92
- GRM
- 5.6
CMA / ARV
- ARV (on-the-fly)
- $81,263
- Comps found
- 12
Show comp detail 12 sales within ~0.75 mi
| Address | Dist | Beds/Ba | Sqft | Sold | Price | $/sf | Match |
|---|---|---|---|---|---|---|---|
| 613 Williams St | 0.09mi | 3/1.0 | 1,526 (-12%) | 2mo | $40,000 | $26 | 73 |
| 709 S Granger St | 0.25mi | 3/1.5 | 1,633 (-6%) | 8mo | $32,500 | $20 | 73 |
| 616 S Oakley St | 0.40mi | 3/1.0 | 1,836 (+6%) | 7mo | $36,000 | $20 | 63 |
| 1118 Cass St | 0.52mi | 3/1.5 | 1,617 (-6%) | 7mo | $46,500 | $29 | 59 |
| 203 N Webster St | 0.61mi | 3/2.0 | 1,607 (-7%) | 4mo | $115,000 | $72 | 54 |
| 407 S Oakley St | 0.49mi | 3/1.0 | 1,495 (-14%) | 4mo | $58,000 | $39 | 50 |
| 1544 Maine St | 0.72mi | 3/1.0 | 1,632 (-6%) | 8mo | $76,000 | $47 | 49 |
| 1403 Cypress St | 0.65mi | 4/2.0 (+1) | 1,603 (-7%) | 2mo | $63,000 | $39 | 49 |
| 412 S Granger St | 0.34mi | 4/1.0 (+1) | 1,546 (-11%) | 14mo | $80,500 | $52 | 48 |
| 1556 Marquette St | 0.71mi | 3/2.0 | 1,612 (-7%) | 13mo | $120,000 | $74 | 43 |
| 1112 Brockway Rd | 0.36mi | 4/2.0 (+1) | 1,472 (-15%) | 11mo | $98,500 | $67 | 42 |
| 1536 Greenwich St | 0.66mi | 4/1.5 (+1) | 1,536 (-11%) | 10mo | $100,000 | $65 | 38 |
Match score weights: distance 35% · size 25% · config 20% · recency 20%. Top-matched comps best support the ARV.
Projected returns pro-forma
-3.0% appreciation · 3.98% rent growth · sell at horizon
- IRR
- 14.2%
- Equity multiple
- 1.58×
- Total profit
- $12,540
- Equity at exit
- $11,585
- IRR
- 23.8%
- Equity multiple
- 3.15×
- Total profit
- $46,701
- Equity at exit
- $6,718
Cash invested: $21,756 (down + closing). Projections, not guarantees.
Landlord ↔ Tenant lean methodology
- Overall (STATE)
- 62 Landlord-Friendly
- State Michigan
- 62 Landlord-Friendly · EVEN
- County
- — inherits STATE
- City
- — inherits STATE
ZIP-level market 48602
- Home prices YoY
- -19.7%
- Rents YoY
- 4.0%
- Active inventory
- 250
- Price-to-rent
- 5.6×
Monthly cashflow live
- Estimated rent
- $1,165 medium interval (Pro) →
- Mortgage (P&I)
- −$407
- Tax from tax record
- −$104 /mo · $1,249/yr
- Insurance
- −$32
- HOA
- −$0
- Vacancy / Maint / Mgmt
- −$245
- Net cashflow
- $376
Break-even live
UW: 25.0% down · 7.5% · 30yr · 1.5% tax · 5.0% vac · 8.0% maint · 8.0% mgmt
Financing live
Cash to close
- Down payment
- $19,425
- Closing costs
- $2,331
- Reserves months
- —
- Total cash needed
- —
Loan-product check · same deal, 3 products live
Conventional
25% down · 7.5% · 30yr
- Down + closing
- —
- Monthly P&I
- —
- Monthly cashflow
- —
- DSCR
- —
- Eligible?
- —
Personal DTI + credit; lowest rate.
DSCR
20% down · 8.5% · 30yr
- Down + closing
- —
- Monthly P&I
- —
- Monthly cashflow
- —
- DSCR
- —
- Eligible?
- —
No personal income docs; deal must DSCR.
Hard money
10% down · 12.0% · 12mo
- Down + closing
- —
- Monthly P&I
- —
- Monthly cashflow
- —
- DSCR
- —
- Eligible?
- —
Short-term bridge; refi at stabilization.
Listing history 32 events
-
2026-06-19days on market $77,700 Active 83 DOM
-
2026-06-18days on market $77,700 Active 82 DOM
-
2026-06-17days on market $77,700 Active 81 DOM
-
2026-06-16days on market $77,700 Active 80 DOM
-
2026-06-15days on market $77,700 Active 79 DOM
-
2026-06-14days on market $77,700 Active 77 DOM
-
2026-06-12days on market $77,700 Active 76 DOM
-
2026-06-09days on market $77,700 Active 73 DOM
-
2026-06-08days on market $77,700 Active 72 DOM
-
2026-06-07days on market $77,700 Active 71 DOM
-
2026-06-05days on market $77,700 Active 68 DOM
-
2026-06-03days on market $77,700 Active 67 DOM
-
2026-06-02days on market $77,700 Active 66 DOM
-
2026-06-01days on market $77,700 Active 65 DOM
-
2026-05-31days on market $77,700 Active 64 DOM
-
2026-05-30days on market $77,700 Active 63 DOM
-
2026-03-27$77,700 Active
-
2006-05-31soldstatus $70,500 348-char remark
Show marketing remark (348 chars)
Home or Office- zoned for both! 3 large bedrooms with hardwood floors, 1.5 baths, dining room, large living room with a fireplace, a small den or study, open staircase, 3 entrances, full basement with plenty of storage area plus a newer boiler and water heater. Wonderful opportunity for a family, attorney or an accountant. Call today! Bank owned.
-
2006-05-05historical 348-char remark
Show marketing remark (348 chars)
Home or Office- zoned for both! 3 large bedrooms with hardwood floors, 1.5 baths, dining room, large living room with a fireplace, a small den or study, open staircase, 3 entrances, full basement with plenty of storage area plus a newer boiler and water heater. Wonderful opportunity for a family, attorney or an accountant. Call today! Bank owned.
-
2006-03-18$64,900 348-char remark
Show marketing remark (348 chars)
Home or Office- zoned for both! 3 large bedrooms with hardwood floors, 1.5 baths, dining room, large living room with a fireplace, a small den or study, open staircase, 3 entrances, full basement with plenty of storage area plus a newer boiler and water heater. Wonderful opportunity for a family, attorney or an accountant. Call today! Bank owned.
-
2006-03-09historical
-
2006-03-09historical
-
2005-09-09$65,000
-
2005-09-09$65,000
-
2004-06-16historical
-
2004-06-16historical
-
2004-03-16$99,900
-
2004-03-16$99,900
-
2003-08-13historical
-
2003-08-13historical
-
2003-05-13$119,900
-
2003-05-13$119,900
ⓘ Source: listings_history table (triggers on properties + properties_extension) + one-shot
backfill from property_details.listing_events for pre-trigger history.
Tax reassessment forecast MI · Partial reset (capped growth)
- Current annual tax
- $1,249 · $104/mo
- Projected year-2 tax
- $1,249 · $104/mo
- Expected delta
- $0/yr ($0/mo · 0.0%)
ⓘ Screening estimate from a state-policy table — verify with the county assessor before closing.
Climate risk First Street
- Flood 1/10 Low FEMA zone X (unshaded) · 0% chance over 30 yrs
- Wildfire 1/10 Low
- Heat 2/10 Low 7 d/yr ≥100°F today · 14 d/yr by 30 yrs out
- Wind 1/10 Low
- Air quality 2/10 Low 1 unhealthy d/yr today · 2 by 30 yrs out
Nearby sold comps map
Loading sold comps map…
Walkable amenities ~0.75 mi
Loading nearby amenities…
Taxation est. · year 1
- Rental income
- $13,974
- − Mortgage interest
- −$4,352
- − Property taxes
- −$1,249
- − Insurance
- −$388
- − Repairs & maintenance
- −$1,118
- − Management
- −$1,118
- − Depreciation
- −$2,260
- Taxable income
- $3,488
- Est. tax owed @ 24.0%
- −$837
- After-tax cash flow
- $3,675/yr
For passive investors: Depreciation is non-cash, so a rental often shows a tax loss while cash-flowing — sheltering income. Rental losses are passive: they offset passive income freely, and up to $25,000/yr can offset ordinary (W-2) income if you actively participate and your MAGI is under $100k (phasing out to $0 by $150k); unused losses carry forward. On sale, claimed depreciation is recaptured at up to 25%, and gains may owe capital-gains tax (a 1031 exchange can defer both). Figures are a year-1 estimate at your 24.0% rate — not tax advice; consult a CPA.
Schools (NCES district)
- District
- Saginaw School District
- NCES district ID
- 2630390
- Math proficiency
- 20% ▼ -5.00%
- Reading proficiency
- 29% ▼ -3.00%
- Median HH income
- $28,940
- Composite
- 19.6/100
- National rank
- #8755
- State rank
- #444 of 540 in MI
Livability — Saginaw
- Score
- 63/100
- State rank
- #521
- US rank
- #15424
Category grades
Schools grade is shown separately in the Schools card above.
Census & demographics
- Census place
- Saginaw, MI
- County
- Saginaw County · 54,884 people
- City population
- 54,884
- Metro
- Saginaw, MI
- Population (ZIP)
- 27,127
- Household income
- $46,984
- Rent vs Own
- Severe rent burden
- 1416.0
Population outlook (Saginaw County) Hauer SSP2
- Today (2025)
- 180,568 people
- By 2030
- 172,302 · -4.6%
- By 2040
- 153,919 · -14.8%
- By 2050
- 135,519 · -24.9%
- By 2075
- 97,199 · -46.2%
- By 2100
- 65,037 · -64.0%
Race, ethnicity, and origin ACS 2023
- Neighborhood character
- Diverse neighborhood (Simpson 0.64)
- Race & ethnicity
- White 50% Black 27% Hispanic / Latino 17% Two or more races 12%
- Hispanic origin (detail)
- Mexican 14% Puerto Rican 1%
- Common ancestry
- Romanian 4% Lithuanian 3% Italian 2%
- Foreign-born
- 1% · Canada
- Languages at home
- 96% English-only · Spanish 3%
Political lean MEDSL · Saginaw
- 2024 margin
- Toss-up / Even · D 47.7% · R 51.0% · Other 1.4%
- 2008→2024 swing
- -20.6pp toward R · 2008: 17.3pp · 2024: -3.3pp
- All cycles
- 2024: R+3.3 2020: D+0.3 2016: R+1.1 2012: D+11.9 2008: D+17.3
Not yet ingested
- Civics
- —
Market trends
- HPI YoY
- ▼ -39.15%
- Current HPI
- 159.8807
- Rent YoY
- ▲ 3.98%
- Metro
- Saginaw, MI
- State GDP YoY
- ▲ 1.37%
- F500 in state
- 28
Industry mix (Fortune 500 HQ in MI)
| Industry | F500 HQs | Revenue |
|---|---|---|
| Automotive Parts | 3 | $48B |
|
||
| Automotive | 2 | $372B |
|
||
| Chemicals | 1 | $45B |
|
||
| Automotive Retail | 1 | $29B |
|
||
| Healthcare / Medical Devices | 1 | $23B |
|
||
| Automotive Technology | 1 | $20B |
|
||
Price history
-35.2% since first listed16 events — show timeline
- 2026-03-27 Listed $77,700 MiRealSource-MiMLS
- 2006-05-31 Sold (MLS) $70,500 MiRealSource-MiMLS
- 2006-05-05 Listing Removed — MiRealSource-MiMLS
- 2006-03-18 Listed $64,900 MiRealSource-MiMLS
- 2006-03-09 Listing Removed — REALCOMP
- 2006-03-09 Listing Removed — MiRealSource-MiMLS
- 2005-09-09 Listed $65,000 REALCOMP
- 2005-09-09 Listed $65,000 MiRealSource-MiMLS
- 2004-06-16 Listing Removed — MiRealSource-MiMLS
- 2004-06-16 Listing Removed — REALCOMP
- 2004-03-16 Listed $99,900 MiRealSource-MiMLS
- 2004-03-16 Listed $99,900 REALCOMP
- 2003-08-13 Listing Removed — REALCOMP
- 2003-08-13 Listing Removed — MiRealSource-MiMLS
- 2003-05-13 Listed $119,900 REALCOMP
- 2003-05-13 Listed $119,900 MiRealSource-MiMLS
Property tax history
+1.5%/yrLatest (2025): $1,249 · -22.5% YoY. Source: county tax records.
Cash-flow waterfall
monthlySold comps — $/sqft
last 12 mo · ≤1 miLoading sold comps…