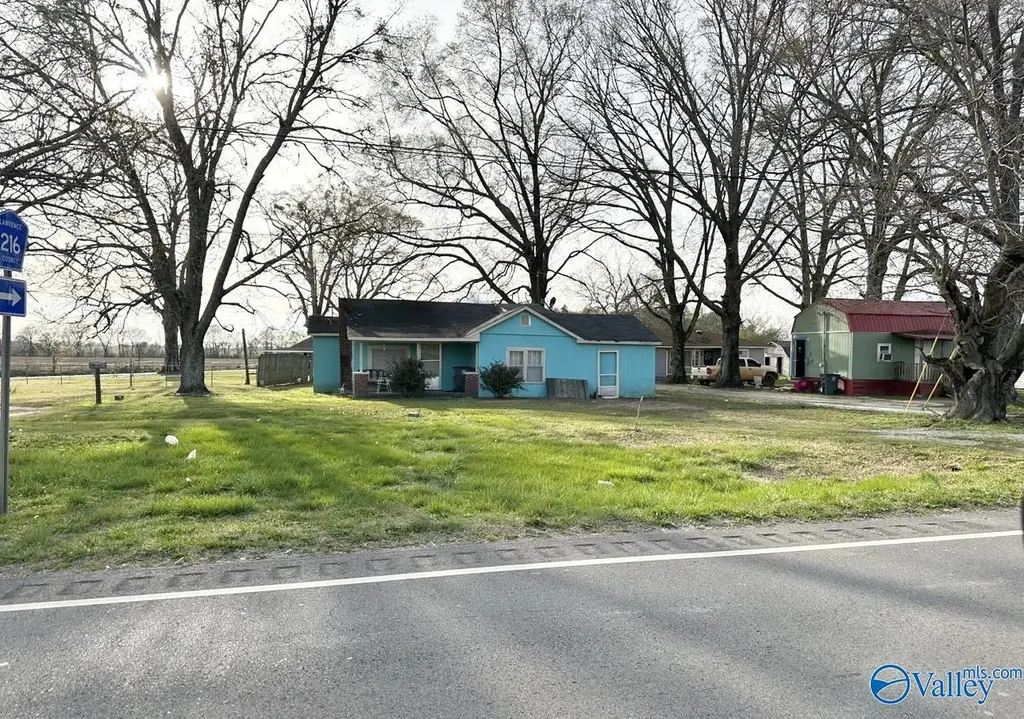
16617 Main St · Town Creek, AL
Flood risk 1/10 · Minimal
- FEMA flood zone
- X (unshaded)
- Chance of flooding over 30 yrs
- 0.0%
- Est. flood insurance / yr
- $507 – $1,088
Fire risk 1/10 · Minimal
- Est. fire insurance / yr
- $916 – $1,700
Heat risk 6/10 · Moderate
- Hot days now (above 107°F)
- 7 days/yr
- Hot days in 30 yrs
- 20 days/yr
Wind risk 6/10 · Moderate
- Chance of severe wind over 30 yrs
- 27.0%
Air-quality risk 2/10 · Minimal
- Unhealthy air days now
- 0 days/yr
- Unhealthy air days in 30 yrs
- 1 days/yr
Risk factors via First Street. Map © Google.
Why this score? — see what drove the B- grade
The composite is a weighted blend of 9 inputs, each scored 0–100. Each bar is that input's sub-score; the figure is the points it added to the 100-point composite (weight × sub-score).
- Cash flow +30.0/30.0
- 1% rule +10.0/10.0
- DSCR +10.0/10.0
- ARV discount +7.5/15.0
- Livability +3.2/5.0
- Rent growth +2.5/5.0
- Schools +2.2/10.0
- Condition / age +1.0/5.0
- Appreciation +0.0/10.0
$30,000
🖨 Deal sheet 📄 Offer letter ✓ Due diligence
Listing remarks
SOLD AS IS! This is a Medicaid sale! Cash only!! 2 bedroom, 1 bath home. Ceiling collapsing in one room and floors collapsed in another. This property is on septic but needs to be pumped. No central unit, just gas heater. Foundation issues. Water off. Conveniently located to Wheeler Dam and just off Highway 20 which is convenient to wok in the Shoals or Huntsville area.
Key facts
- 8,712 sq ft lot
- Built 1955
- Listed 1176 days
Property features AI
Finance
- Other: Property listed as residential, lot approximately 0.2 acres (about 8,712 sq ft); No fireplaces
- HOA & community: No homeowners association
Exterior
- Parking: No designated parking
- Utilities: Public water; Public sewer
- Home design: Single-family residence; One-level home; Built in 1955
- Construction: 1955 construction
- Exterior features: Gravel driveway; Covered front porch
Interior
- Kitchen: Electric water heater
- Bathrooms: 1 full bathroom
- Heating & cooling: Propane heating; No central cooling
- Interior features: Crawl space foundation; Five total rooms
Neighborhood map
What this means for you Summary
Snapshot
- This is a 2-bed/1.0-bath single-family listed at $30k. Condition is rated poor.
Deal economics
- At list price, monthly cash flow is $592 ($7k/yr) — positive.
- The deal already cash-flows at list — no discount required.
- Meets the 1% rule at list price ($1k rent vs $30k).
- Recommended offer: $26k (12.0% below list) — sets the bar for market timing.
Location & tenants
- Location reads 63/100 on livability (#192 in AL) — a middle-class / working-renter tenant base. Strengths: crime A+, cost of living A+, housing A+; Watch: employment D+, amenities F, commute F.
- Lawrence County (rural): math 14% / reading 38% proficiency, ranked #85 of 129 in AL (top 66%) — low school quality limits family demand, transient renter base, plan for 1-2y turnover.
- Zoned schools: Hatton High School (math 9% / reading 29%, grade F, #181 of 305 statewide, top 60%, 543 students, 60% FRL).
- Market conditions: 41 active listings in the ZIP; 5 units permitted in Lawrence County in 2024 (0 in 5+ unit buildings).
Forward outlook
- Local home prices are declining (-3.0%/yr); year-one equity from $207 of loan paydown is wiped out by about $900 of value loss. Plan a longer hold.
- Lawrence County population projected at -25% by 2050 — secular population decline; favor cash flow + early exit over multi-decade hold.
- At projected returns (-3.0% appreciation + 3.0% rent growth), your $8k cash investment doubles in ~2 years — after that, you're playing with house money.
Negotiation context
- It's been on market 1177 days — a 12% lower offer ($26k) is reasonable based on typical stale-listing flexibility.
Risks & watch-outs
- Watch-outs: built in 1955 — expect roof / HVAC / electrical / plumbing capex.
- Climate carrying-cost: major wind risk, 27% chance of damaging wind over 30y; extreme-heat days projected 7→20/yr by 2055 (HVAC capex compounding) — expect insurance premiums to compound above CPI over the hold.
Questions for the listing agent
- It's been on market 1177 days. Have you received any prior offers? Is the seller open to a 12% concession, seller financing, or rate buy-down credit?
- Have any recent inspections been done? Can we get a copy of the seller's disclosures and any deferred-maintenance estimates?
- Built in 1955 — when were the roof, HVAC, electrical panel, plumbing, and water heater last replaced?
- Why hasn't it sold? Are there any deal-killer items the seller is aware of (foundation, flood, title, zoning, code violations)?
- Is there a deadline driving the sale (1031 exchange, divorce, estate, relocation)? That informs how much negotiation room exists.
- Schools are D-rated, which usually means shorter tenancies and higher turnover. Who's the typical renter profile here, and what's been the actual vacancy rate?
- What's the average days-on-market for RENTAL listings here right now (not sales)? A rising rental-DOM trend means longer vacancies and softer asking-rent achievability than the comps imply.
- What's the recent tenant-quality profile in this submarket — average credit score on applications, eviction rate, late-payment / NSF rate, and stable-employment percentage? A property-management company in the area should have these aggregated.
- How much new for-sale + rental construction is in the pipeline within 1–3 miles? Heavy new supply typically softens prices + rents 12–24 months out; constrained supply supports both.
Investment metrics
- 1% rule
- 3.37% ✓
- Cap rate
- 29.97%
- Cash-on-cash
- 84.56%
- DSCR
- 4.76
- GRM
- 2.5
CMA / ARV
- ARV (median comp)
- $123,232
- List price
- $30,000
- Delta
- -75.66%
- Verdict
- UNDERPRICED
- Comps
- 9 within 1.0 mi
Show comp detail 2 sales within ~0.75 mi
| Address | Dist | Beds/Ba | Sqft | Sold | Price | $/sf | Match |
|---|---|---|---|---|---|---|---|
| 555 Church St | 0.48mi | 2/1.0 | 1,070 (-11%) | 11mo | $123,750 | $116 | 51 |
| 407 Church St | 0.63mi | 2/1.0 | 1,080 (-10%) | 9mo | $45,000 | $42 | 47 |
Match score weights: distance 35% · size 25% · config 20% · recency 20%. Top-matched comps best support the ARV.
Projected returns pro-forma
-3.0% appreciation · 3.0% rent growth · sell at horizon
- IRR
- 85.0%
- Equity multiple
- 4.91×
- Total profit
- $32,855
- Equity at exit
- $4,473
- IRR
- 88.2%
- Equity multiple
- 10.19×
- Total profit
- $77,217
- Equity at exit
- $2,594
Cash invested: $8,400 (down + closing). Projections, not guarantees.
Landlord ↔ Tenant lean methodology
- Overall (STATE)
- 90 Strongly Landlord-Friendly
- State Alabama
- 90 Strongly Landlord-Friendly · R+15
- County
- — inherits STATE
- City
- — inherits STATE
ZIP-level market 35672
- Home prices YoY
- -21.4%
- Active inventory
- 41
- Price-to-rent
- 2.5×
Monthly cashflow live
- Estimated rent
- $1,012 medium interval (Pro) →
- Mortgage (P&I)
- −$157
- Tax est. 1.5%
- −$38 /mo · $450/yr
- Insurance
- −$12
- HOA
- −$0
- Vacancy / Maint / Mgmt
- −$212
- Net cashflow
- $592
Break-even live
UW: 25.0% down · 7.5% · 30yr · 1.5% tax · 5.0% vac · 8.0% maint · 8.0% mgmt
Financing live
Cash to close
- Down payment
- $7,500
- Closing costs
- $900
- Reserves months
- —
- Total cash needed
- —
Loan-product check · same deal, 3 products live
Conventional
25% down · 7.5% · 30yr
- Down + closing
- —
- Monthly P&I
- —
- Monthly cashflow
- —
- DSCR
- —
- Eligible?
- —
Personal DTI + credit; lowest rate.
DSCR
20% down · 8.5% · 30yr
- Down + closing
- —
- Monthly P&I
- —
- Monthly cashflow
- —
- DSCR
- —
- Eligible?
- —
No personal income docs; deal must DSCR.
Hard money
10% down · 12.0% · 12mo
- Down + closing
- —
- Monthly P&I
- —
- Monthly cashflow
- —
- DSCR
- —
- Eligible?
- —
Short-term bridge; refi at stabilization.
Listing history 17 events
-
2026-06-19days on market $30,000 Active 1177 DOM
-
2026-06-18days on market $30,000 Active 1176 DOM
-
2026-06-17days on market $30,000 Active 1175 DOM
-
2026-06-16days on market $30,000 Active 1174 DOM
-
2026-06-15days on market $30,000 Active 1173 DOM
-
2026-06-14days on market $30,000 Active 1171 DOM
-
2026-06-13days on market $30,000 Active 1170 DOM
-
2026-06-10days on market $30,000 Active 1168 DOM
-
2026-06-09days on market $30,000 Active 1167 DOM
-
2026-06-08days on market $30,000 Active 1166 DOM
-
2026-06-07days on market $30,000 Active 1165 DOM
-
2026-06-05days on market $30,000 Active 1162 DOM
-
2026-06-02days on market $30,000 Active 1160 DOM
-
2026-06-01days on market $30,000 Active 1159 DOM
-
2026-05-31days on market $30,000 Active 1158 DOM
-
2026-05-30days on market $30,000 Active 1157 DOM
-
2023-03-30$30,000 Active
ⓘ Source: listings_history table (triggers on properties + properties_extension) + one-shot
backfill from property_details.listing_events for pre-trigger history.
Climate risk First Street
- Flood 1/10 Low FEMA zone X (unshaded) · 0% chance over 30 yrs
- Wildfire 1/10 Low
- Heat 6/10 Major 7 d/yr ≥107°F today · 20 d/yr by 30 yrs out
- Wind 6/10 Major 27% chance of damaging wind over 30 yrs
- Air quality 2/10 Low 0 unhealthy d/yr today · 1 by 30 yrs out
Nearby sold comps map
Loading sold comps map…
Walkable amenities ~0.75 mi
Loading nearby amenities…
Taxation est. · year 1
- Rental income
- $12,141
- − Mortgage interest
- −$1,680
- − Property taxes
- −$450
- − Insurance
- −$150
- − Repairs & maintenance
- −$971
- − Management
- −$971
- − Depreciation
- −$873
- Taxable income
- $7,045
- Est. tax owed @ 24.0%
- −$1,691
- After-tax cash flow
- $5,412/yr
For passive investors: Depreciation is non-cash, so a rental often shows a tax loss while cash-flowing — sheltering income. Rental losses are passive: they offset passive income freely, and up to $25,000/yr can offset ordinary (W-2) income if you actively participate and your MAGI is under $100k (phasing out to $0 by $150k); unused losses carry forward. On sale, claimed depreciation is recaptured at up to 25%, and gains may owe capital-gains tax (a 1031 exchange can defer both). Figures are a year-1 estimate at your 24.0% rate — not tax advice; consult a CPA.
Condition & rehab AI · 4 photos
This property requires extensive repairs and maintenance, including major structural and systems issues. Significant investment is needed to bring it up to a livable condition.
Repairs flagged
- Major ceiling — Collapsing in one room.
- Major floors — Collapsed in another room.
- Major septic system — Needs to be pumped.
- Major heating system — No central unit, only gas heater.
- Major foundation — Issues present.
- Major water supply — Water off.
Value-add opportunities
- Resale ceiling repair and replacement — Fixes a major safety hazard and improves the home's appearance.
- Resale floor repair and replacement — Fixes a major safety hazard and improves the home's appearance.
- Resale septic system repair and replacement — Ensures the home's sanitation system is functioning properly.
- Resale central heating system installation — Improves comfort and energy efficiency.
- Resale foundation repair — Stabilizes the home and prevents further structural damage.
- Resale water supply repair — Ensures the home has a reliable water supply and prevents further damage to the property.
Renovation cost estimate screening
| Repair item | Severity | Est. cost |
|---|---|---|
| ceiling · Collapsing in one room. | Major | $15,000–50,000 |
| floors · Collapsed in another room. | Major | $15,000–50,000 |
| septic system · Needs to be pumped. | Major | $15,000–50,000 |
| heating system · No central unit, only gas heater. | Major | $15,000–50,000 |
| foundation · Issues present. | Major | $15,000–50,000 |
| water supply · Water off. | Major | $15,000–50,000 |
| Total estimated repair cost · 6 items | $90,000–300,000 |
Value-add ROI direction
- Resale ceiling repair and replacement — Fixes a major safety hazard and improves the home's appearance. ↑
- Resale floor repair and replacement — Fixes a major safety hazard and improves the home's appearance. ↑
- Resale septic system repair and replacement — Ensures the home's sanitation system is functioning properly. ↑
- Resale central heating system installation — Improves comfort and energy efficiency. ↑
- Resale foundation repair — Stabilizes the home and prevents further structural damage. ↑
- Resale water supply repair — Ensures the home has a reliable water supply and prevents further damage to the property. ↑
ⓘ Cost ranges are severity-bucket heuristics (US national rule-of-thumb). Get contractor quotes + a written scope before underwriting a rehab budget.
Schools (NCES district)
- District
- Lawrence County
- NCES district ID
- 0102040
- Math proficiency
- 14% ▼ -25.00%
- Reading proficiency
- 38% ▼ -4.00%
- Median HH income
- $40,669
- Composite
- 21.9/100
- National rank
- #8230
- State rank
- #85 of 129 in AL
Livability — Town Creek
- Score
- 63/100
- State rank
- #192
- US rank
- #15646
Category grades
Schools grade is shown separately in the Schools card above.
Census & demographics
- City population
- 5,738
- Population (ZIP)
- 5,738
Population outlook (Lawrence County) Hauer SSP2
- Today (2025)
- 30,827 people
- By 2030
- 29,343 · -4.8%
- By 2040
- 26,268 · -14.8%
- By 2050
- 23,052 · -25.2%
- By 2075
- 17,414 · -43.5%
- By 2100
- 13,600 · -55.9%
Race, ethnicity, and origin ACS 2023
- Neighborhood character
- Diverse neighborhood (Simpson 0.57)
- Race & ethnicity
- White 63% Black 17% Two or more races 11% Native American 7%
- Common ancestry
- Iranian 2% Slovak 1% Serbian 1%
- Foreign-born
- 1% · South Korea
- Languages at home
- 98% English-only · Korean 1% Other Asian/Pacific 1%
Political lean MEDSL · Lawrence
- 2024 margin
- Solid R (+62.3) · D 18.5% · R 80.8%
- 2008→2024 swing
- -34.3pp toward R · 2008: -28.0pp · 2024: -62.3pp
- All cycles
- 2024: R+62.3 2020: R+54.6 2016: R+48.7 2012: R+27.0 2008: R+28.0
Not yet ingested
- Civics
- —
Market trends
- HPI YoY
- ▼ -52.91%
- Current HPI
- 194.2849
- Rent YoY
- —
- Metro
- —
- State GDP YoY
- ▲ 2.94%
- F500 in state
- 4
Industry mix (Fortune 500 HQ in AL)
| Industry | F500 HQs | Revenue |
|---|---|---|
| Financial Services | 1 | $8B |
|
||
| Healthcare | 1 | $5B |
|
||
Price history
1 event — show timeline
- 2023-03-30 Listed $30,000 VMLS
Cash-flow waterfall
monthlySold comps — $/sqft
last 12 mo · ≤1 miLoading sold comps…