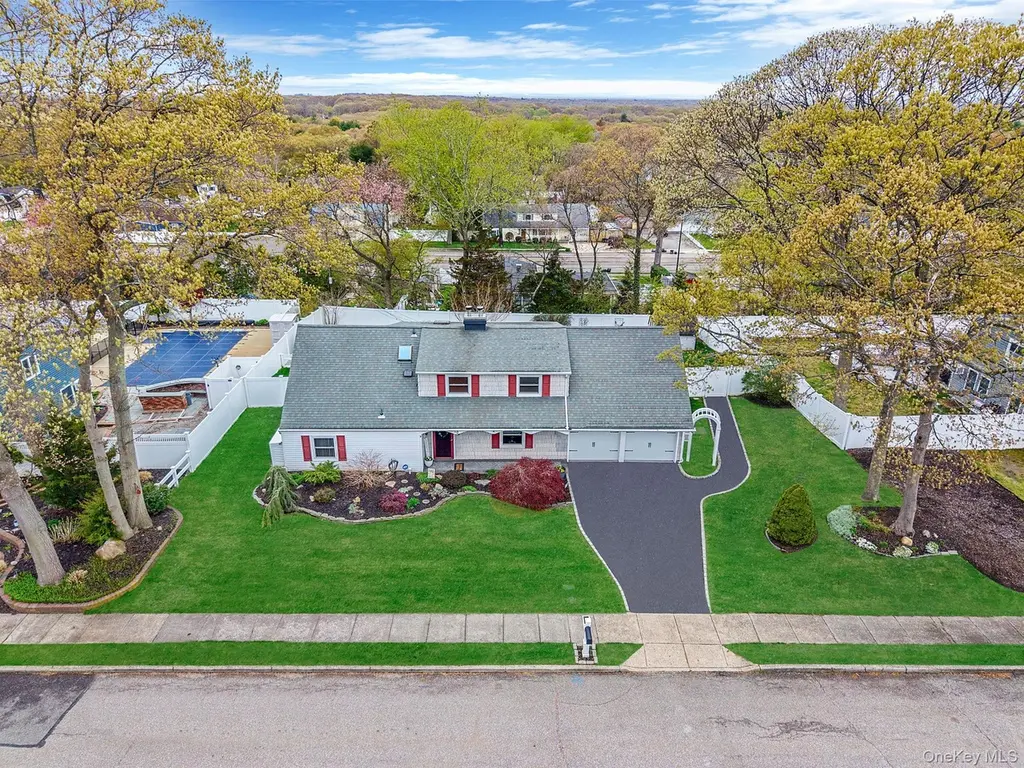
10 Lehigh Ln · Farmingville, NY
Flood risk 1/10 · Minimal
- FEMA flood zone
- X (unshaded)
- Chance of flooding over 30 yrs
- 0.0%
- Est. flood insurance / yr
- $507 – $1,088
Fire risk 2/10 · Minimal
- Est. fire insurance / yr
- $691 – $1,283
Heat risk 4/10 · Minor
- Hot days now (above 94°F)
- 6 days/yr
- Hot days in 30 yrs
- 15 days/yr
Wind risk 6/10 · Moderate
- Chance of severe wind over 30 yrs
- 72.0%
Air-quality risk 3/10 · Minor
- Unhealthy air days now
- 3 days/yr
- Unhealthy air days in 30 yrs
- 4 days/yr
Risk factors via First Street. Map © Google.
Why this score? — see what drove the D grade
The composite is a weighted blend of 9 inputs, each scored 0–100. Each bar is that input's sub-score; the figure is the points it added to the 100-point composite (weight × sub-score).
- ARV discount +15.0/15.0
- Cash flow +7.8/30.0
- Schools +6.6/10.0
- Livability +3.4/5.0
- 1% rule +2.8/10.0
- Rent growth +2.5/5.0
- Condition / age +2.5/5.0
- DSCR +1.9/10.0
- Appreciation +0.0/10.0
$599,000
🖨 Deal sheet (PDF) 📄 Offer letter ✓ Due diligence
Listing remarks
Beautiful 5 Bedroom Colonial! Located in the desirable Sachem School District, this move in ready 5 bedroom, 2 bath home offers comfort, space, and convenience with beautiful curb appeal that truly stands out. This two story home features a versatile layout with 3 bedrooms and 1 full bathroom upstairs, and 2 bedrooms with 1 full bathroom on the main level, ideal for extended family or flexible living. The property includes a fully fenced yard with durable PVC fencing, In-ground sprinklers, a covered front porch, and a rear concrete patio, perfect for relaxing or entertaining. The home offers a bright layout highlighted by a skylight, cozy fireplace, and an updated kitchen equipped with a ga
Key facts
- Covered front porch
- Gas stove
- Rear concrete patio
Tags
Property features AI
Exterior
- Parking: Garage; 2-car garage
- Utilities: Cesspool sewer; Cable connected; Electricity connected; Phone connected; Public trash collection; Water connected
- Home design: Single family residence; Living area reported from public records
- Construction: Frame construction
- Exterior features: Frame construction; Not waterfront
Interior
- Kitchen: Range; Refrigerator
- Bedrooms: Bedroom on the first floor
- Bathrooms: 2 full bathrooms
- Heating & cooling: Oil heating; Wall/window air conditioning units
- Interior features: First-floor bedroom; First-floor full bathroom; Partial attic; No basement; 11 total rooms
Neighborhood map
What this means for you Summary
Snapshot
- This is a 5-bed/2.0-bath single-family listed at $599k.
Deal economics
- At list price, monthly cash flow is $-666 ($-8k/yr) — negative.
- To cash-flow at today's rent, offer at most $481k (19.6% below list).
- To meet the 1% rule (rent ≥ 1% of price), the offer needs to be $470k (21.5% below list).
- Recommended offer: $470k (21.5% below list) — sets the bar for 1% rule.
Location & tenants
- Location reads 67/100 on livability (#592 in NY) — a middle-class / working-renter tenant base. Strengths: employment A+, housing A+, health & safety B; Watch: amenities F, commute F, cost of living F.
- Sachem Central School District (suburban): math 69% / reading 76% proficiency, ranked #86 of 590 in NY (top 15%) — strong family-tenant draw, lease renewals of 3-5y typical; only 15% free/reduced lunch — higher-income household profile.
- Zoned schools: Chippewa Elementary School (math 47% / reading 62%, grade C, #908 of 2,108 statewide, top 46%, 515 students, 25% FRL); Sagamore Middle School (math 44% / reading 57%, grade C, #259 of 729 statewide, top 36%, 933 students, 30% FRL); Sachem High School East (math 94% / reading 93%, grade A+, #131 of 1,100 statewide, top 13%, 2,082 students, 28% FRL).
- Market conditions: 68 active listings in the ZIP; 1 comparable units currently listed for rent nearby; 1,366 units permitted in Suffolk County in 2024 (216 in 5+ unit buildings).
Forward outlook
- Local home prices are declining (-3.0%/yr); year-one equity from $4k of loan paydown is wiped out by about $18k of value loss. Plan a longer hold.
- Suffolk County population projected to shrink 5% by 2050 — rents likely to lag national; underwrite the cash flow, not the appreciation.
Negotiation context
- It's been on market 19 days — a 2% lower offer ($590k) is reasonable based on typical stale-listing flexibility.
Risks & watch-outs
- Climate carrying-cost: major wind risk, 72% chance of damaging wind over 30y — expect insurance premiums to compound above CPI over the hold.
Questions for the listing agent
- What do current leases actually rent for vs. the listed asking? Can we see a recent rent roll and the last 12 months of T-12 income?
- Built in 1968 — when were the roof, HVAC, electrical panel, plumbing, and water heater last replaced?
- Is there a deadline driving the sale (1031 exchange, divorce, estate, relocation)? That informs how much negotiation room exists.
- Schools are B-rated — typically a magnet for longer-tenancy family renters. What's the average tenant stay here, and is there a school-zone premium baked into asking?
- The area grade is low — what's the realistic commute time and amenity access for the typical tenant pool here? Any planned neighborhood developments (good or bad) we should know about?
- What's the average days-on-market for RENTAL listings here right now (not sales)? A rising rental-DOM trend means longer vacancies and softer asking-rent achievability than the comps imply.
- What's the recent tenant-quality profile in this submarket — average credit score on applications, eviction rate, late-payment / NSF rate, and stable-employment percentage? A property-management company in the area should have these aggregated.
- How much new for-sale + rental construction is in the pipeline within 1–3 miles? Heavy new supply typically softens prices + rents 12–24 months out; constrained supply supports both.
Investment metrics
- 1% rule
- 0.78% ✗
- Cap rate
- 4.96%
- Cash-on-cash
- -4.76%
- DSCR
- 0.79
- GRM
- 10.6
CMA / ARV
- ARV (median comp)
- $737,407
- List price
- $599,000
- Delta
- -18.77%
- Verdict
- UNDERPRICED
- Comps
- 20 within 1.0 mi
Show comp detail 12 sales within ~0.75 mi
| Address | Dist | Beds/Ba | Sqft | Sold | Price | $/sf | Match |
|---|---|---|---|---|---|---|---|
| 11 College Hills Dr | 0.08mi | 4/1.5 (-1) | 1,794 (-2%) | 8mo | $680,000 | $379 | 79 |
| 8 Beverly Ct | 0.27mi | 4/2.5 (-1) | 1,872 (+2%) | 5mo | $775,000 | $414 | 73 |
| 8 Arlene St | 0.27mi | 4/2.5 (-1) | 1,887 (+3%) | 9mo | $798,000 | $423 | 68 |
| 50 Hillside Rd | 0.51mi | 4/2.0 (-1) | 1,824 (-0%) | 8mo | $675,000 | $370 | 63 |
| 7 Mark Ln | 0.29mi | 4/3.5 (-1) | 1,936 (+6%) | 4mo | $740,000 | $382 | 63 |
| 1314 Waverly Ave | 0.06mi | 4/2.0 (-1) | 1,624 (-11%) | 15mo | $585,000 | $360 | 61 |
| 10 Melvin Ave | 0.41mi | 4/2.0 (-1) | 1,794 (-2%) | 15mo | $735,000 | $410 | 60 |
| 18 Hofstra Dr | 0.25mi | 4/2.0 (-1) | 1,628 (-11%) | 7mo | $750,000 | $461 | 59 |
| 41 Campus Dr | 0.10mi | 4/2.0 (-1) | 1,584 (-14%) | 15mo | $615,000 | $388 | 56 |
| 41 Roberta Ave | 0.40mi | 4/2.5 (-1) | 2,000 (+9%) | 10mo | $800,000 | $400 | 50 |
| 153 Ridgewood Ave | 0.63mi | 4/2.0 (-1) | 1,750 (-4%) | 13mo | $669,000 | $382 | 47 |
| 26 Fran Ln | 0.74mi | 4/2.0 (-1) | 1,583 (-14%) | 0mo | $625,000 | $395 | 37 |
Match score weights: distance 35% · size 25% · config 20% · recency 20%. Top-matched comps best support the ARV.
Projected returns pro-forma
-3.0% appreciation · 3.0% rent growth · sell at horizon
- IRR
- -24.3%
- Equity multiple
- 0.17×
- Total profit
- $-139,248
- Equity at exit
- $89,313
- IRR
- -19.6%
- Equity multiple
- -0.04×
- Total profit
- $-174,970
- Equity at exit
- $51,791
Cash invested: $167,720 (down + closing). Projections, not guarantees.
Landlord ↔ Tenant lean methodology
- Overall (STATE)
- 15 Strongly Tenant-Friendly
- State New York
- 15 Strongly Tenant-Friendly · D+10
- County
- — inherits STATE
- City
- — inherits STATE
ZIP-level market 11738
- Active inventory
- 68
- Price-to-rent
- 10.6×
Monthly cashflow live
- Estimated rent
- $4,700 medium interval (Pro) →
- Mortgage (P&I)
- −$3,141
- Tax from tax record
- −$988 /mo · $11,855/yr
- Insurance
- −$250
- HOA
- −$0
- Vacancy / Maint / Mgmt
- −$987
- Net cashflow
- $-666
Break-even live
Sensitivity live
| Price | -10% $-327 | -5% $-496 | +0% $-666 | +5% $-835 | +10% $-1,005 |
|---|---|---|---|---|---|
| Rent | -10% $-1,037 | -5% $-851 | +0% $-666 | +5% $-480 | +10% $-294 |
| Rate | -1.0pp $-364 | -0.5pp $-513 | base $-666 | +0.5pp $-821 | +1.0pp $-979 |
UW: 25.0% down · 7.5% · 30yr · 1.5% tax · 5.0% vac · 8.0% maint · 8.0% mgmt
Financing live
Cash to close
- Down payment
- $149,750
- Closing costs
- $17,970
- Reserves months
- —
- Total cash needed
- —
Loan-product check · same deal, 3 products live
Conventional
25% down · 7.5% · 30yr
- Down + closing
- —
- Monthly P&I
- —
- Monthly cashflow
- —
- DSCR
- —
- Eligible?
- —
Personal DTI + credit; lowest rate.
DSCR
20% down · 8.5% · 30yr
- Down + closing
- —
- Monthly P&I
- —
- Monthly cashflow
- —
- DSCR
- —
- Eligible?
- —
No personal income docs; deal must DSCR.
Hard money
10% down · 12.0% · 12mo
- Down + closing
- —
- Monthly P&I
- —
- Monthly cashflow
- —
- DSCR
- —
- Eligible?
- —
Short-term bridge; refi at stabilization.
Rent comps 1 comps
| Address | Beds | Baths | Sqft | Rent | $/sqft | DOM | Units | Dist |
|---|---|---|---|---|---|---|---|---|
| 43 Tuscala St Selden, NY | 4.0 | 3.5 | 2400 | $4,700 | $1.96 | 0d | 1 | 0.98mi |
Listing history 2 events
-
2026-05-17status Pending 1030-char remark
-
2026-04-28$599,000 Active 1030-char remark
ⓘ Source: listings_history table (triggers on properties + properties_extension) + one-shot
backfill from property_details.listing_events for pre-trigger history.
Tax reassessment forecast NY · Partial reset (capped growth)
- Current annual tax
- $11,855 · $988/mo
- Projected year-2 tax
- $11,855 · $988/mo
- Expected delta
- $0/yr ($0/mo · 0.0%)
ⓘ Screening estimate from a state-policy table — verify with the county assessor before closing.
Climate risk First Street
- Flood 1/10 Low FEMA zone X (unshaded) · 0% chance over 30 yrs
- Wildfire 2/10 Low
- Heat 4/10 Moderate 6 d/yr ≥94°F today · 15 d/yr by 30 yrs out
- Wind 6/10 Major 72% chance of damaging wind over 30 yrs
- Air quality 3/10 Moderate 3 unhealthy d/yr today · 4 by 30 yrs out
Nearby sold comps map
Loading sold comps map…
Walkable amenities ~0.75 mi
Loading nearby amenities…
Taxation est. · year 1
- Rental income
- $56,400
- − Mortgage interest
- −$33,553
- − Property taxes
- −$11,855
- − Insurance
- −$2,995
- − Repairs & maintenance
- −$4,512
- − Management
- −$4,512
- − Depreciation
- −$17,425
- Taxable loss
- −$18,453
- Est. tax savings @ 24.0%
- +$4,429
- After-tax cash flow
- $-3,560/yr
For passive investors: Depreciation is non-cash, so a rental often shows a tax loss while cash-flowing — sheltering income. Rental losses are passive: they offset passive income freely, and up to $25,000/yr can offset ordinary (W-2) income if you actively participate and your MAGI is under $100k (phasing out to $0 by $150k); unused losses carry forward. On sale, claimed depreciation is recaptured at up to 25%, and gains may owe capital-gains tax (a 1031 exchange can defer both). Figures are a year-1 estimate at your 24.0% rate — not tax advice; consult a CPA.
Schools (NCES district)
- District
- Sachem Central School District
- NCES district ID
- 3625350
- Math proficiency
- 69% ▬ 0.00%
- Reading proficiency
- 76% ▲ 12.00%
- Median HH income
- $92,968
- Composite
- 65.53/100
- National rank
- #472
- State rank
- #86 of 590 in NY
Livability — Farmingville
- Score
- 67/100
- State rank
- #592
- US rank
- #10732
Category grades
Schools grade is shown separately in the Schools card above.
Census & demographics
- Census place
- Farmingville, NY
- City population
- 20,246
- Population (ZIP)
- 20,246
Population outlook (Suffolk County) Hauer SSP2
- Today (2025)
- 1,505,262 people
- By 2030
- 1,498,318 · -0.5%
- By 2040
- 1,471,101 · -2.3%
- By 2050
- 1,424,848 · -5.3%
- By 2075
- 1,337,157 · -11.2%
- By 2100
- 1,217,720 · -19.1%
Race, ethnicity, and origin ACS 2023
- Neighborhood character
- Diverse neighborhood (Simpson 0.57)
- Race & ethnicity
- White 61% Hispanic / Latino 23% Two or more races 8% Black 6% Asian 5% Native American 1%
- Hispanic origin (detail)
- Mexican 1% Puerto Rican 7% Dominican 2%
- Common ancestry
- Romanian 3% Estonian 2% Russian 2%
- Foreign-born
- 17% · Canada, Jamaica, China
- Languages at home
- 74% English-only · Spanish 13% Other Indo-European 8% Other Asian/Pacific 1%
Political lean MEDSL · Suffolk
- 2024 margin
- Lean R (+10.0) · D 45.0% · R 55.0%
- 2008→2024 swing
- -16.0pp toward R · 2008: 6.0pp · 2024: -10.0pp
- All cycles
- 2024: R+10.0 2020: R+0.0 2016: R+8.2 2012: D+2.9 2008: D+6.0
Not yet ingested
- Civics
- —
Market trends
- HPI YoY
- ▼ -605.51%
- Current HPI
- 364.6287
- Rent YoY
- —
- Metro
- —
- State GDP YoY
- ▲ 2.60%
- F500 in state
- 92
Industry mix (Fortune 500 HQ in NY)
| Industry | F500 HQs | Revenue |
|---|---|---|
| Financial Services | 10 | $950B |
|
||
| Consumer Goods | 9 | $162B |
|
||
| Insurance | 4 | $225B |
|
||
| Telecommunications | 2 | $144B |
|
||
| Pharmaceuticals | 2 | $112B |
|
||
| Media / Entertainment | 2 | $69B |
|
||
Price history
2 events — show timeline
- 2026-05-17 Pending — OneKey® MLS as Distributed by MLS Grid
- 2026-04-28 Listed $599,000 OneKey® MLS as Distributed by MLS Grid
Property tax history
+3.3%/yrLatest (2025): $11,855 · +0.0% YoY. Source: county tax records.
Cash-flow waterfall
monthlySold comps — $/sqft
last 12 mo · ≤1 miLoading sold comps…