 🏷️ Likely Rental
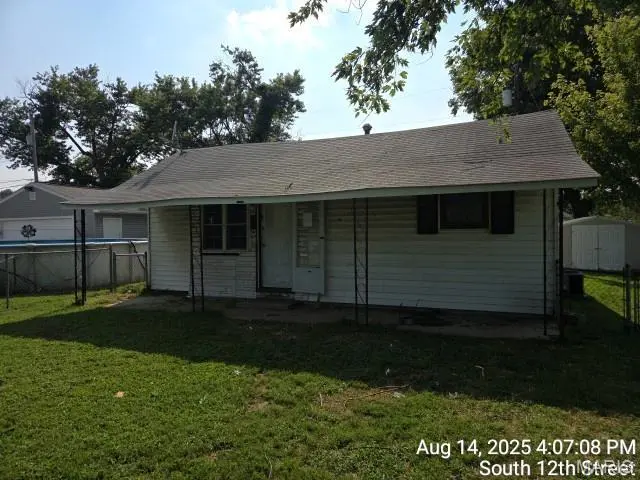
110 12th St · Wood River, IL
Flood risk 1/10 · Minimal
- FEMA flood zone
- X
- Chance of flooding over 30 yrs
- 0.0%
- Est. flood insurance / yr
- $473 – $860
Fire risk 1/10 · Minimal
- Est. fire insurance / yr
- $804 – $1,492
Heat risk 6/10 · Moderate
- Hot days now (above 107°F)
- 7 days/yr
- Hot days in 30 yrs
- 20 days/yr
Wind risk 2/10 · Minimal
- Chance of severe wind over 30 yrs
- 1.0%
Air-quality risk 3/10 · Minor
- Unhealthy air days now
- 2 days/yr
- Unhealthy air days in 30 yrs
- 4 days/yr
Risk factors via First Street. Map © Google.
Why this score? — see what drove the B+ grade
The composite is a weighted blend of 9 inputs, each scored 0–100. Each bar is that input's sub-score; the figure is the points it added to the 100-point composite (weight × sub-score).
- Cash flow +30.0/30.0
- ARV discount +15.0/15.0
- 1% rule +10.0/10.0
- DSCR +10.0/10.0
- Livability +3.8/5.0
- Rent growth +2.5/5.0
- Condition / age +2.5/5.0
- Schools +1.7/10.0
- Appreciation +0.0/10.0
$59,000
🖨 Deal sheet 📄 Offer letter ✓ Due diligence
Listing remarks MLS
Calling all investors!!! Property has a tenant in it at $900/mo!! Add this house to your portfolio today! Located in a quiet Wood River neighborhood, just minutes from shopping, restaurants, highways, etc!! This same seller has a total of 4 properties listed, so let's work out a deal! ***Seller financing available!!!***
Key facts
- 6,490 sq ft lot
- Built 1928
- Listed 114 days
Neighborhood map
What this means for you Summary
Snapshot
- This is a 2-bed/1.0-bath single-family listed at $59k.
Deal economics
- At list price, monthly cash flow is $253 ($3k/yr) — positive.
- The deal already cash-flows at list — no discount required.
- Meets the 1% rule at list price ($891 rent vs $59k).
- Recommended offer: $54k (9.0% below list) — sets the bar for market timing.
- Cap rate 11.4% vs local median 5.9% in Wood River — top-decile yield for the area; either an underpriced asset or a hidden risk that comps aren't pricing in. Stress-test before assuming the spread holds.
Location & tenants
- Location reads 75/100 on livability (#214 in IL, #4,027 nationally) — a middle-class / working-renter tenant base. Strengths: cost of living A+, housing A+, health & safety B; Watch: amenities C-, commute D+, employment D+.
- Roxana CUSD 1 (suburban): math 18% / reading 19% proficiency, ranked #440 of 620 in IL (top 71%) — low school quality limits family demand, transient renter base, plan for 1-2y turnover.
- Market conditions: 33 active listings in the ZIP; 3 comparable units currently listed for rent nearby; rentals leasing fast (median 2d on market — plan ~1-2 weeks tenant-placement turnaround); 336 units permitted in Madison County in 2024 (0 in 5+ unit buildings).
- This rent is only 16% of the median local income ($65k/yr) — well below the 30% rent-burden line; pricing power to push rent on renewal without tenant pushback.
Forward outlook
- Local home prices are declining (-3.0%/yr); year-one equity from $408 of loan paydown is wiped out by about $2k of value loss. Plan a longer hold.
- Madison County population projected at -18% by 2050 — secular population decline; favor cash flow + early exit over multi-decade hold.
- At projected returns (-3.0% appreciation + 3.0% rent growth), your $17k cash investment doubles in ~7 years — after that, you're playing with house money.
Negotiation context
- It's been on market 114 days — a 9% lower offer ($54k) is reasonable based on typical stale-listing flexibility.
- 4 sale attempts with the ask held roughly flat each time — persistent listings suggest the price (not the market) is what's stuck; bring a comps-based counter.
Risks & watch-outs
- Watch-outs: built in 1928 — expect roof / HVAC / electrical / plumbing capex.
- Climate carrying-cost: extreme-heat days projected 7→20/yr by 2055 (HVAC capex compounding) — expect insurance premiums to compound above CPI over the hold.
Questions for the listing agent
- It's been on market 114 days. Have you received any prior offers? Is the seller open to a 9% concession, seller financing, or rate buy-down credit?
- Built in 1928 — when were the roof, HVAC, electrical panel, plumbing, and water heater last replaced?
- Why hasn't it sold? Are there any deal-killer items the seller is aware of (foundation, flood, title, zoning, code violations)?
- Is there a deadline driving the sale (1031 exchange, divorce, estate, relocation)? That informs how much negotiation room exists.
- Schools are F-rated, which usually means shorter tenancies and higher turnover. Who's the typical renter profile here, and what's been the actual vacancy rate?
- What's the average days-on-market for RENTAL listings here right now (not sales)? A rising rental-DOM trend means longer vacancies and softer asking-rent achievability than the comps imply.
- What's the recent tenant-quality profile in this submarket — average credit score on applications, eviction rate, late-payment / NSF rate, and stable-employment percentage? A property-management company in the area should have these aggregated.
- How much new for-sale + rental construction is in the pipeline within 1–3 miles? Heavy new supply typically softens prices + rents 12–24 months out; constrained supply supports both.
Investment metrics
- 1% rule
- 1.51% ✓
- Cap rate
- 11.43%
- Cash-on-cash
- 18.36%
- DSCR
- 1.82
- GRM
- 5.5
CMA / ARV
- ARV (median comp)
- $86,859
- List price
- $59,000
- Delta
- -32.07%
- Verdict
- UNDERPRICED
- Comps
- 20 within 1.0 mi
Show comp detail 12 sales within ~0.75 mi
| Address | Dist | Beds/Ba | Sqft | Sold | Price | $/sf | Match |
|---|---|---|---|---|---|---|---|
| 909 Madison Ave | 0.13mi | 2/1.0 | 696 (-3%) | 6mo | $91,000 | $131 | 83 |
| 531 12th St | 0.41mi | 2/1.0 | 763 (+6%) | 10mo | $83,900 | $110 | 62 |
| 823 Tennyson Ave | 0.52mi | 2/1.0 | 748 (+4%) | 11mo | $69,000 | $92 | 60 |
| 1440 Ladd Ave | 0.26mi | 3/1.0 (+1) | 816 (+13%) | 2mo | $50,000 | $61 | 59 |
| 545 S 7th St | 0.56mi | 2/1.0 | 768 (+7%) | 7mo | $125,900 | $164 | 57 |
| 215 Doerr St | 0.70mi | 2/1.0 | 696 (-3%) | 6mo | $104,000 | $149 | 56 |
| 511 E Penning Ave | 0.58mi | 2/1.0 | 736 (+2%) | 16mo | $45,000 | $61 | 56 |
| 824 Whittier St | 0.49mi | 2/1.0 | 672 (-7%) | 12mo | $44,900 | $67 | 56 |
| 1233 Madison Ave | 0.08mi | 2/1.0 | 823 (+14%) | 21mo | $57,000 | $69 | 55 |
| 214 Reller St | 0.70mi | 2/1.0 | 720 (0%) | 15mo | $105,000 | $146 | 54 |
| 825 Hawthorne Ave | 0.41mi | 2/1.0 | 780 (+8%) | 20mo | $99,900 | $128 | 50 |
| 300 Clark St | 0.59mi | 2/1.0 | 816 (+13%) | 14mo | $82,000 | $100 | 39 |
Match score weights: distance 35% · size 25% · config 20% · recency 20%. Top-matched comps best support the ARV.
Projected returns pro-forma
-3.0% appreciation · 3.0% rent growth · sell at horizon
- IRR
- 10.1%
- Equity multiple
- 1.40×
- Total profit
- $6,581
- Equity at exit
- $8,797
- IRR
- 19.2%
- Equity multiple
- 2.61×
- Total profit
- $26,626
- Equity at exit
- $5,101
Cash invested: $16,520 (down + closing). Projections, not guarantees.
Landlord ↔ Tenant lean methodology
- Overall (STATE)
- 43 Moderately Tenant-Leaning
- State Illinois
- 43 Moderately Tenant-Leaning · D+7
- County
- — inherits STATE
- City
- — inherits STATE
ZIP-level market 62095
- Home prices YoY
- -22.9%
- Active inventory
- 33
- Price-to-rent
- 5.5×
Monthly cashflow live
- Estimated rent
- $891 medium interval (Pro) →
- Mortgage (P&I)
- −$309
- Tax from tax record
- −$117 /mo · $1,404/yr
- Insurance
- −$25
- HOA
- −$0
- Vacancy / Maint / Mgmt
- −$187
- Net cashflow
- $253
Break-even live
UW: 25.0% down · 7.5% · 30yr · 1.5% tax · 5.0% vac · 8.0% maint · 8.0% mgmt
Financing live
Cash to close
- Down payment
- $14,750
- Closing costs
- $1,770
- Reserves months
- —
- Total cash needed
- —
Loan-product check · same deal, 3 products live
Conventional
25% down · 7.5% · 30yr
- Down + closing
- —
- Monthly P&I
- —
- Monthly cashflow
- —
- DSCR
- —
- Eligible?
- —
Personal DTI + credit; lowest rate.
DSCR
20% down · 8.5% · 30yr
- Down + closing
- —
- Monthly P&I
- —
- Monthly cashflow
- —
- DSCR
- —
- Eligible?
- —
No personal income docs; deal must DSCR.
Hard money
10% down · 12.0% · 12mo
- Down + closing
- —
- Monthly P&I
- —
- Monthly cashflow
- —
- DSCR
- —
- Eligible?
- —
Short-term bridge; refi at stabilization.
Rent comps 3 comps
| Address | Beds | Baths | Sqft | Rent | $/sqft | DOM | Units | Dist |
|---|---|---|---|---|---|---|---|---|
| 226 E Lorena Ave Wood River, IL | 1.0 | 1.0 | 615 | $1,150 | $1.87 | 2d | 1 | 0.76mi |
| 111 S Central Ave Roxana, IL | 1.0 | 1.0 | 600 | $650 | $1.08 | 2d | 1 | 0.81mi |
| 103 W 1st St Unit C Roxana, IL | 1.0 | 1.0 | 700 | $650 | $0.93 | 2d | 1 | 0.85mi |
Listing history 22 events
-
2026-06-18days on market $59,000 Active 114 DOM
-
2026-06-17days on market $59,000 Active 113 DOM
-
2026-06-16days on market $59,000 Active 112 DOM
-
2026-06-15days on market $59,000 Active 111 DOM
-
2026-06-13days on market $59,000 Active 109 DOM
-
2026-06-09days on market $59,000 Active 105 DOM
-
2026-06-08days on market $59,000 Active 104 DOM
-
2026-06-07days on market $59,000 Active 103 DOM
-
2026-06-05days on market $59,000 Active 100 DOM
-
2026-06-03days on market $59,000 Active 99 DOM
-
2026-06-02days on market $59,000 Active 98 DOM
-
2026-06-01days on market $59,000 Active 97 DOM
-
2026-05-31days on market $59,000 Active 96 DOM
-
2026-03-11status Active 321-char remark
Show marketing remark (321 chars)
Calling all investors!!! Property has a tenant in it at $900/mo!! Add this house to your portfolio today! Located in a quiet Wood River neighborhood, just minutes from shopping, restaurants, highways, etc!! This same seller has a total of 4 properties listed, so let's work out a deal! ***Seller financing available!!!***
-
2026-03-09status Pending 321-char remark
Show marketing remark (321 chars)
Calling all investors!!! Property has a tenant in it at $900/mo!! Add this house to your portfolio today! Located in a quiet Wood River neighborhood, just minutes from shopping, restaurants, highways, etc!! This same seller has a total of 4 properties listed, so let's work out a deal! ***Seller financing available!!!***
-
2026-03-06status Active 321-char remark
Show marketing remark (321 chars)
Calling all investors!!! Property has a tenant in it at $900/mo!! Add this house to your portfolio today! Located in a quiet Wood River neighborhood, just minutes from shopping, restaurants, highways, etc!! This same seller has a total of 4 properties listed, so let's work out a deal! ***Seller financing available!!!***
-
2026-02-21status Pending 321-char remark
Show marketing remark (321 chars)
Calling all investors!!! Property has a tenant in it at $900/mo!! Add this house to your portfolio today! Located in a quiet Wood River neighborhood, just minutes from shopping, restaurants, highways, etc!! This same seller has a total of 4 properties listed, so let's work out a deal! ***Seller financing available!!!***
-
2026-02-09$59,000 Active 321-char remark
Show marketing remark (321 chars)
Calling all investors!!! Property has a tenant in it at $900/mo!! Add this house to your portfolio today! Located in a quiet Wood River neighborhood, just minutes from shopping, restaurants, highways, etc!! This same seller has a total of 4 properties listed, so let's work out a deal! ***Seller financing available!!!***
-
2025-09-20historical $900
-
2025-09-04price $900
-
2025-08-21$950
-
2006-10-30soldstatus $185,000
ⓘ Source: listings_history table (triggers on properties + properties_extension) + one-shot
backfill from property_details.listing_events for pre-trigger history.
Tax reassessment forecast IL · Partial reset (capped growth)
- Current annual tax
- $1,404 · $117/mo
- Projected year-2 tax
- $1,404 · $117/mo
- Expected delta
- $0/yr ($0/mo · 0.0%)
ⓘ Screening estimate from a state-policy table — verify with the county assessor before closing.
Climate risk First Street
- Flood 1/10 Low FEMA zone X · 0% chance over 30 yrs
- Wildfire 1/10 Low
- Heat 6/10 Major 7 d/yr ≥107°F today · 20 d/yr by 30 yrs out
- Wind 2/10 Low 100% chance of damaging wind over 30 yrs
- Air quality 3/10 Moderate 2 unhealthy d/yr today · 4 by 30 yrs out
Nearby sold comps map
Loading sold comps map…
Walkable amenities ~0.75 mi
Loading nearby amenities…
Taxation est. · year 1
- Rental income
- $10,691
- − Mortgage interest
- −$3,305
- − Property taxes
- −$1,404
- − Insurance
- −$295
- − Repairs & maintenance
- −$855
- − Management
- −$855
- − Depreciation
- −$1,716
- Taxable income
- $2,260
- Est. tax owed @ 24.0%
- −$542
- After-tax cash flow
- $2,491/yr
For passive investors: Depreciation is non-cash, so a rental often shows a tax loss while cash-flowing — sheltering income. Rental losses are passive: they offset passive income freely, and up to $25,000/yr can offset ordinary (W-2) income if you actively participate and your MAGI is under $100k (phasing out to $0 by $150k); unused losses carry forward. On sale, claimed depreciation is recaptured at up to 25%, and gains may owe capital-gains tax (a 1031 exchange can defer both). Figures are a year-1 estimate at your 24.0% rate — not tax advice; consult a CPA.
Schools (NCES district)
- District
- Roxana CUSD 1
- NCES district ID
- 1735010
- Math proficiency
- 18% ▼ -8.00%
- Reading proficiency
- 19% ▼ -11.00%
- Median HH income
- $50,661
- Composite
- 16.73/100
- National rank
- #9164
- State rank
- #440 of 620 in IL
Livability — Wood River
- Score
- 75/100
- State rank
- #214
- US rank
- #4027
Category grades
Schools grade is shown separately in the Schools card above.
Census & demographics
- Census place
- Wood River, IL
- County
- Madison County · 189,064 people
- City population
- 10,726
- Metro
- St. Louis, MO-IL
- Population (ZIP)
- 10,726
- Household income
- $65,013
- Rent vs Own
- Severe rent burden
- 383.0
Population outlook (Madison County) Hauer SSP2
- Today (2025)
- 258,371 people
- By 2030
- 251,523 · -2.7%
- By 2040
- 233,640 · -9.6%
- By 2050
- 213,042 · -17.5%
- By 2075
- 165,255 · -36.0%
- By 2100
- 123,953 · -52.0%
Race, ethnicity, and origin ACS 2023
- Neighborhood character
- Predominantly White (87%)
- Race & ethnicity
- White 87% Black 6% Two or more races 6% Hispanic / Latino 3%
- Common ancestry
- Lithuanian 2% Romanian 2% Iranian 1%
- Foreign-born
- 2% · Canada
- Languages at home
- 97% English-only · Spanish 2%
Political lean MEDSL · Madison
- 2024 margin
- R (+13.3) · D 42.5% · R 55.8% · Other 1.8%
- 2008→2024 swing
- -22.5pp toward R · 2008: 9.2pp · 2024: -13.3pp
- All cycles
- 2024: R+13.3 2020: R+13.2 2016: R+15.6 2012: R+1.4 2008: D+9.2
Not yet ingested
- Civics
- —
Market trends
- HPI YoY
- ▼ -64.69%
- Current HPI
- 217.1264
- Rent YoY
- —
- Metro
- St. Louis, MO-IL
- State GDP YoY
- ▲ 1.59%
- F500 in state
- 60
Industry mix (Fortune 500 HQ in IL)
| Industry | F500 HQs | Revenue |
|---|---|---|
| Insurance | 4 | $201B |
|
||
| Consumer Goods | 4 | $87B |
|
||
| Industrial Machinery | 3 | $64B |
|
||
| Healthcare | 2 | $55B |
|
||
| Retail / Pharmacy | 1 | $148B |
|
||
| Agriculture / Food | 1 | $86B |
|
||
Price history
-68.1% since first listed9 events — show timeline
- 2026-03-11 Relisted — MARIS as Distributed by MLS Grid
- 2026-03-09 Pending — MARIS as Distributed by MLS Grid
- 2026-03-06 Relisted — MARIS as Distributed by MLS Grid
- 2026-02-21 Pending — MARIS as Distributed by MLS Grid
- 2026-02-09 Listed $59,000 MARIS as Distributed by MLS Grid
- 2025-09-20 Rental Removed $900 APPFOLIO
- 2025-09-04 Price Changed $900 APPFOLIO
- 2025-08-21 Listed for Rent $950 APPFOLIO
- 2006-10-30 Sold (Public Records) $185,000 Public Records
Property tax history
+2.2%/yrLatest (2024): $1,404 · +5.2% YoY. Source: county tax records.
Cash-flow waterfall
monthlySold comps — $/sqft
last 12 mo · ≤1 miLoading sold comps…