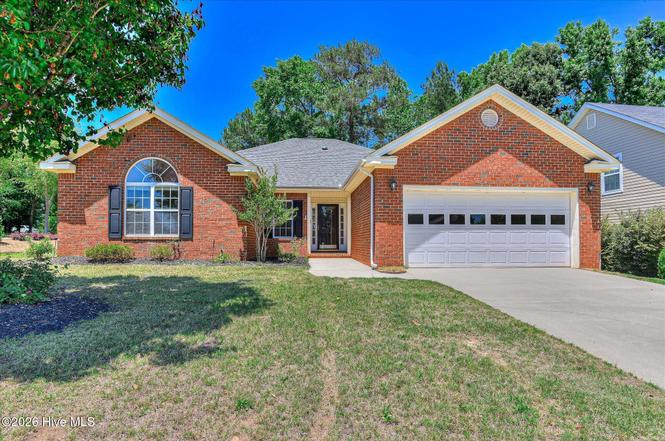
627 Ventana Dr · Evans, GA
Flood risk 1/10 · Minimal
- FEMA flood zone
- X (unshaded)
- Chance of flooding over 30 yrs
- 0.0%
- Est. flood insurance / yr
- $507 – $1,088
Fire risk 3/10 · Minor
- Est. fire insurance / yr
- $963 – $1,789
Heat risk 7/10 · Major
- Hot days now (above 107°F)
- 7 days/yr
- Hot days in 30 yrs
- 18 days/yr
Wind risk 6/10 · Moderate
- Chance of severe wind over 30 yrs
- 63.0%
Air-quality risk 3/10 · Minor
- Unhealthy air days now
- 2 days/yr
- Unhealthy air days in 30 yrs
- 3 days/yr
Risk factors via First Street. Map © Google.
Why this score? — see what drove the D- grade
The composite is a weighted blend of 9 inputs, each scored 0–100. Each bar is that input's sub-score; the figure is the points it added to the 100-point composite (weight × sub-score).
- Cash flow +12.3/30.0
- ARV discount +7.5/15.0
- Schools +4.5/10.0
- Livability +3.9/5.0
- DSCR +3.7/10.0
- Condition / age +2.5/5.0
- Rent growth +2.4/5.0
- 1% rule +2.3/10.0
- Appreciation +0.0/10.0
$319,900
🖨 Deal sheet (PDF) 📄 Offer letter ✓ Due diligence
Listing remarks MLS
THE BANDON PLAN BY PIERWOOD CONSTRUCTION IS A RANCH WITH 3 BEDROOMS / 2 BATHS. 4TH BEDROOM CAN BE STUDY. GREAT ROOM HAS GAS LOG FIREPLACE. BRICK AND VINYL EXTERIOR.
Key facts
- Cozy gas fireplace
- Spacious great room
- All-brick home
Tags
Property features AI
Finance
- Other: Zoning: R1; Directions: William Few from Columbia Road or Washington Road; turn into Summerlin subdivision and the house is on the left.
- HOA & community: Homeowners association with annual fee; Subdivision: Summerlin; Community sidewalks and street lights
Exterior
- Parking: Attached garage; 2 garage spaces; 2 total parking spaces; Concrete driveway
- Security: Smoke detectors; Owned security system
- Utilities: Public water; Public sewer; Cable available
- Home design: Single family residence; One story; Entry level: 1
- Construction: Brick and frame construction; Slab foundation; Composition roof; Built as a residential single family home
- Exterior features: Patio; Privacy fencing; Landscaped yard; Front and rear sprinklers; Paved road access; Has a view
Interior
- Kitchen: Refrigerator; Range; Dishwasher; Disposal; Vented exhaust fan
- Bedrooms: Total rooms: 6
- Flooring: Carpet; Vinyl; Ceramic tile; Hardwood
- Bathrooms: 2 full bathrooms
- Heating & cooling: Central air; Ceiling fan(s); Forced air heating; Electric heating; Natural gas heating; Fireplace(s)
- Interior features: Walk-in closets; Entrance foyer; Kitchen island; Built-in features; Eat-in kitchen; Wired for data; Window coverings; Insulated windows
Neighborhood map
What this means for you Summary
Snapshot
- This is a 3-bed/2.0-bath other listed at $320k.
Deal economics
- At list price, monthly cash flow is $-58 ($-696/yr) — negative.
- To cash-flow at today's rent, offer at most $310k (3.2% below list).
- To meet the 1% rule (rent ≥ 1% of price), the offer needs to be $232k (27.4% below list).
- Recommended offer: $232k (27.4% below list) — sets the bar for 1% rule.
- Cap rate 6.1% vs local median 3.8% in Evans — top-decile yield for the area; either an underpriced asset or a hidden risk that comps aren't pricing in. Stress-test before assuming the spread holds.
Location & tenants
- Location reads 77/100 on livability (#20 in GA, #3,058 nationally) — a middle-class / working-renter tenant base. Strengths: crime A+, employment A+, housing A+; Watch: amenities D+, commute F.
- Columbia County (suburban): math 49% / reading 52% proficiency, ranked #13 of 174 in GA (top 8%) — acceptable for families but not a draw, mixed tenant base, ~2y average lease.
- Zoned schools: Parkway Elementary School (math 78% / reading 70%, grade A, #34 of 1,228 statewide, top 3%, 756 students, 15% FRL); Greenbrier Middle School (math 60% / reading 72%, grade A-, #25 of 470 statewide, top 5%, 845 students, 12% FRL); Greenbrier High School (math 39% / reading 36%, grade F, #65 of 424 statewide, top 16%, 1,801 students, 12% FRL).
- Market conditions: Rents soft (-0.5%/yr); 516 active listings in the ZIP; 2 comparable units currently listed for rent nearby; high-income renter base; 1,213 units permitted in Columbia County in 2024 (0 in 5+ unit buildings).
Forward outlook
- Local home prices are declining (-3.0%/yr); year-one equity from $2k of loan paydown is wiped out by about $10k of value loss. Plan a longer hold.
- Columbia County population projected at +62% by 2050 — long-run rental-demand tailwind backs the buy-and-hold thesis.
Negotiation context
- Only 4 days on market — expect competitive offers; lowballing is unlikely to land.
- 5 sale attempts since 21y ago with the ask held roughly flat each time — persistent listings suggest the price (not the market) is what's stuck; bring a comps-based counter.
- Current owner paid $190k; list at $320k implies a 68% gain — meaningful room to come down on a strong offer.
Risks & watch-outs
- Climate carrying-cost: major wind risk, 63% chance of damaging wind over 30y; extreme-heat days projected 7→18/yr by 2055 (HVAC capex compounding) — expect insurance premiums to compound above CPI over the hold.
Questions for the listing agent
- What do current leases actually rent for vs. the listed asking? Can we see a recent rent roll and the last 12 months of T-12 income?
- Is there a deadline driving the sale (1031 exchange, divorce, estate, relocation)? That informs how much negotiation room exists.
- Schools are B-rated — typically a magnet for longer-tenancy family renters. What's the average tenant stay here, and is there a school-zone premium baked into asking?
- The area grade is low — what's the realistic commute time and amenity access for the typical tenant pool here? Any planned neighborhood developments (good or bad) we should know about?
- What's the average days-on-market for RENTAL listings here right now (not sales)? A rising rental-DOM trend means longer vacancies and softer asking-rent achievability than the comps imply.
- What's the recent tenant-quality profile in this submarket — average credit score on applications, eviction rate, late-payment / NSF rate, and stable-employment percentage? A property-management company in the area should have these aggregated.
- How much new for-sale + rental construction is in the pipeline within 1–3 miles? Heavy new supply typically softens prices + rents 12–24 months out; constrained supply supports both.
Investment metrics
- 1% rule
- 0.73% ✗
- Cap rate
- 6.08%
- Cash-on-cash
- -0.78%
- DSCR
- 0.97
- GRM
- 11.5
CMA / ARV
No comps found within radius.
Projected returns pro-forma
-3.0% appreciation · 0.0% rent growth · sell at horizon
- IRR
- -20.5%
- Equity multiple
- 0.30×
- Total profit
- $-62,500
- Equity at exit
- $47,698
- IRR
- -20.9%
- Equity multiple
- 0.04×
- Total profit
- $-86,144
- Equity at exit
- $27,659
Cash invested: $89,572 (down + closing). Projections, not guarantees.
Landlord ↔ Tenant lean methodology
- Overall (STATE)
- 90 Strongly Landlord-Friendly
- State Georgia
- 90 Strongly Landlord-Friendly · R+3
- County
- — inherits STATE
- City
- — inherits STATE
ZIP-level market 30809
- Home prices YoY
- -22.1%
- Rents YoY
- -0.5%
- Active inventory
- 516
- Price-to-rent
- 11.5×
Monthly cashflow live
- Estimated rent
- $2,323 medium interval (Pro) →
- Mortgage (P&I)
- −$1,678
- Tax from tax record
- −$83 /mo · $992/yr
- Insurance
- −$133
- HOA
- −$0
- Vacancy / Maint / Mgmt
- −$488
- Net cashflow
- $-58
Break-even live
Sensitivity live
| Price | -10% $123 | -5% $33 | +0% $-58 | +5% $-149 | +10% $-239 |
|---|---|---|---|---|---|
| Rent | -10% $-242 | -5% $-150 | +0% $-58 | +5% $34 | +10% $126 |
| Rate | -1.0pp $103 | -0.5pp $23 | base $-58 | +0.5pp $-141 | +1.0pp $-225 |
UW: 25.0% down · 7.5% · 30yr · 1.5% tax · 5.0% vac · 8.0% maint · 8.0% mgmt
Financing live
Cash to close
- Down payment
- $79,975
- Closing costs
- $9,597
- Reserves months
- —
- Total cash needed
- —
Loan-product check · same deal, 3 products live
Conventional
25% down · 7.5% · 30yr
- Down + closing
- —
- Monthly P&I
- —
- Monthly cashflow
- —
- DSCR
- —
- Eligible?
- —
Personal DTI + credit; lowest rate.
DSCR
20% down · 8.5% · 30yr
- Down + closing
- —
- Monthly P&I
- —
- Monthly cashflow
- —
- DSCR
- —
- Eligible?
- —
No personal income docs; deal must DSCR.
Hard money
10% down · 12.0% · 12mo
- Down + closing
- —
- Monthly P&I
- —
- Monthly cashflow
- —
- DSCR
- —
- Eligible?
- —
Short-term bridge; refi at stabilization.
Rent comps 2 comps
| Address | Beds | Baths | Sqft | Rent | $/sqft | DOM | Units | Dist |
|---|---|---|---|---|---|---|---|---|
| 938 Woody Hill Cir Evans, GA | 4.0 | 3.0 | 2421 | $2,350 | $0.97 | 22d | 1 | 0.61mi |
| 688 Tree Top Trl Evans, GA | 4.0 | 3.0 | 2528 | $2,535 | $1.00 | 45d | 1 | 0.74mi |
Listing history 3 events
-
2026-06-22days on market $319,900 Active 4 DOM
-
2026-06-17remarks 557-char remark
-
2026-06-17$319,900 Active 1 DOM
ⓘ Source: listings_history table (triggers on properties + properties_extension) + one-shot
backfill from property_details.listing_events for pre-trigger history.
Tax reassessment forecast GA · Resets to sale price
- Current annual tax
- $992 · $83/mo
- Projected year-2 tax
- $2,943 · $245/mo
- Expected delta
- +$1,952/yr (+$163/mo · 196.8%)
ⓘ Screening estimate from a state-policy table — verify with the county assessor before closing.
Climate risk First Street
- Flood 1/10 Low FEMA zone X (unshaded) · 0% chance over 30 yrs
- Wildfire 3/10 Moderate
- Heat 7/10 Severe 7 d/yr ≥107°F today · 18 d/yr by 30 yrs out
- Wind 6/10 Major 63% chance of damaging wind over 30 yrs
- Air quality 3/10 Moderate 2 unhealthy d/yr today · 3 by 30 yrs out
Nearby sold comps map
Loading sold comps map…
Walkable amenities ~0.75 mi
Loading nearby amenities…
Taxation est. · year 1
- Rental income
- $27,881
- − Mortgage interest
- −$17,919
- − Property taxes
- −$992
- − Insurance
- −$1,600
- − Repairs & maintenance
- −$2,231
- − Management
- −$2,231
- − Depreciation
- −$9,306
- Taxable loss
- −$6,396
- Est. tax savings @ 24.0%
- +$1,535
- After-tax cash flow
- $839/yr
For passive investors: Depreciation is non-cash, so a rental often shows a tax loss while cash-flowing — sheltering income. Rental losses are passive: they offset passive income freely, and up to $25,000/yr can offset ordinary (W-2) income if you actively participate and your MAGI is under $100k (phasing out to $0 by $150k); unused losses carry forward. On sale, claimed depreciation is recaptured at up to 25%, and gains may owe capital-gains tax (a 1031 exchange can defer both). Figures are a year-1 estimate at your 24.0% rate — not tax advice; consult a CPA.
Schools (NCES district)
- District
- Columbia County
- NCES district ID
- 1301410
- Math proficiency
- 49% ▼ -6.00%
- Reading proficiency
- 52% ▼ -4.00%
- Median HH income
- $69,358
- Composite
- 45.04/100
- National rank
- #2695
- State rank
- #13 of 174 in GA
Livability — Evans
- Score
- 77/100
- State rank
- #20
- US rank
- #3058
Category grades
Schools grade is shown separately in the Schools card above.
Census & demographics
- County
- Columbia County · 154,184 people
- City population
- 54,743
- Metro
- Augusta-Richmond County, GA-SC
- Population (ZIP)
- 54,743
- Household income
- $125,272
- Rent vs Own
- Severe rent burden
- 787.0
Population outlook (Columbia County) Hauer SSP2
- Today (2025)
- 189,073 people
- By 2030
- 212,277 · +12.3%
- By 2040
- 259,480 · +37.2%
- By 2050
- 306,991 · +62.4%
- By 2075
- 421,213 · +122.8%
- By 2100
- 496,722 · +162.7%
Race, ethnicity, and origin ACS 2023
- Neighborhood character
- Predominantly White (70%)
- Race & ethnicity
- White 70% Black 13% Hispanic / Latino 7% Two or more races 6% Asian 5%
- Hispanic origin (detail)
- Mexican 3% Puerto Rican 2%
- Common ancestry
- Italian 4% Lithuanian 2% Slovak 2%
- Foreign-born
- 7% · Canada, South Korea
- Languages at home
- 88% English-only · Spanish 6% Other Indo-European 2% Other Asian/Pacific 1%
Political lean MEDSL · Columbia
- 2024 margin
- Strong R (+25.6) · D 36.8% · R 62.5%
- 2008→2024 swing
- +17.0pp toward D · 2008: -42.7pp · 2024: -25.6pp
- All cycles
- 2024: R+25.6 2020: R+25.8 2016: R+37.7 2012: R+43.0 2008: R+42.7
Not yet ingested
- Civics
- —
Market trends
- HPI YoY
- ▼ -62.73%
- Current HPI
- 220.4452
- Rent YoY
- ▼ -0.51%
- Metro
- Augusta-Richmond County, GA-SC
- State GDP YoY
- ▲ 2.66%
- F500 in state
- 28
Industry mix (Fortune 500 HQ in GA)
| Industry | F500 HQs | Revenue |
|---|---|---|
| Paper / Packaging | 2 | $29B |
|
||
| Retail | 1 | $160B |
|
||
| Transportation / Logistics | 1 | $91B |
|
||
| Airlines | 1 | $62B |
|
||
| Consumer Goods | 1 | $47B |
|
||
| Utilities | 1 | $25B |
|
||
Price history
-76.5% since first listed16 events — show timeline
- 2026-06-12 Listed $319,900 Hive MLS
- 2026-02-13 Price Changed $189,900 Hive MLS
- 2026-02-13 Price Changed $209,900 Hive MLS
- 2023-06-29 Listing Removed — Hive MLS
- 2023-06-01 Listed $375,000 Hive MLS
- 2022-02-25 Sold (MLS) $189,900 Hive MLS
- 2022-01-27 Listed $249,900 Hive MLS
- 2007-10-23 Sold (Public Records) $208,000 Public Records
- 2007-10-19 Sold (MLS) $208,000 Hive MLS
- 2007-10-19 Sold (MLS) $208,000 Hive MLS
- 2007-08-20 Listed $209,900 Hive MLS
- 2006-05-31 Sold (MLS) $189,900 Hive MLS
- 2006-05-31 Sold (MLS) $189,900 Hive MLS
- 2005-11-07 Listed $189,900 Hive MLS
- 2005-08-19 Sold (Public Records) $248,000 Public Records
- 2004-01-09 Sold (Public Records) $1,359,600 Public Records
Property tax history
+3.4%/yrLatest (2025): $992 · -4.3% YoY. Source: county tax records.
Cash-flow waterfall
monthlySold comps — $/sqft
last 12 mo · ≤1 miLoading sold comps…