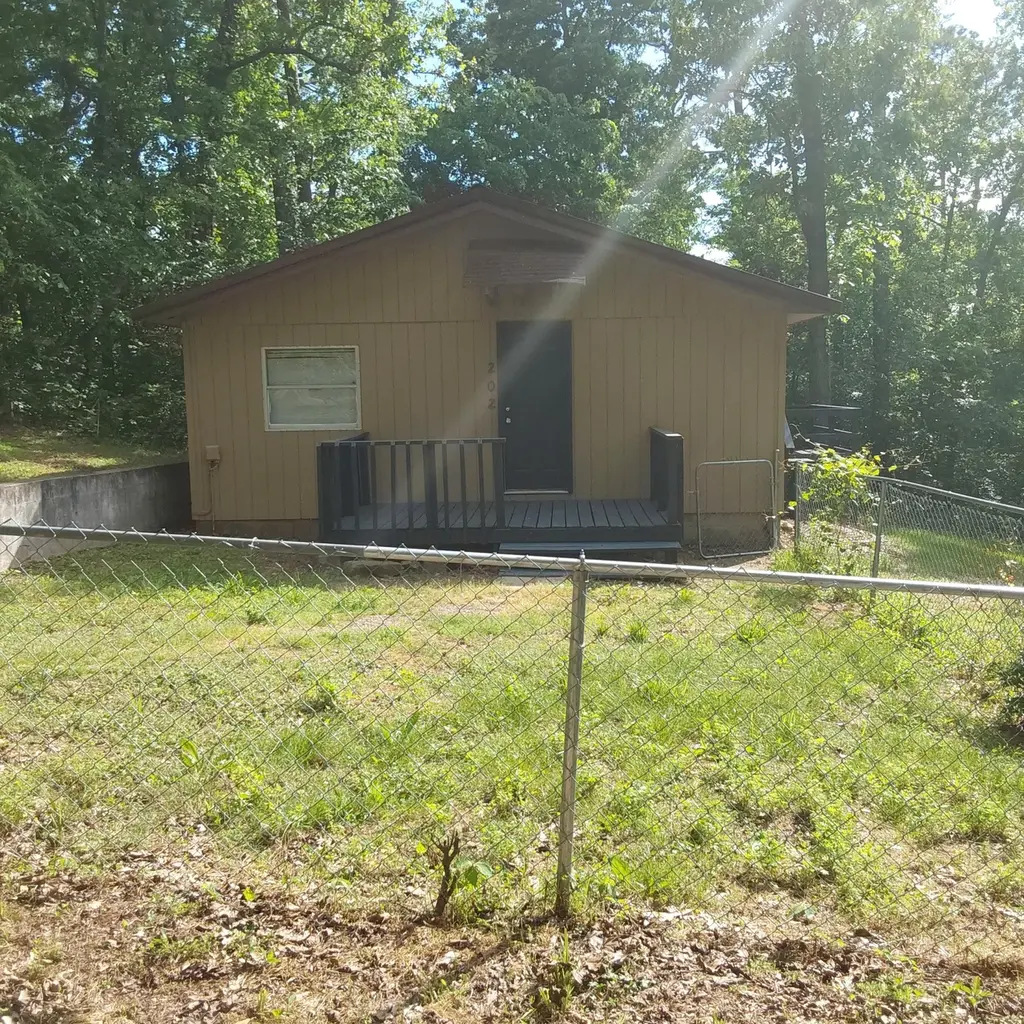
202 Iris Rd · Noel, MO
Flood risk 1/10 · Minimal
- FEMA flood zone
- X (unshaded)
- Chance of flooding over 30 yrs
- 0.0%
- Est. flood insurance / yr
- $507 – $1,088
Fire risk 4/10 · Minor
- Est. fire insurance / yr
- $1,054 – $1,958
Heat risk 5/10 · Moderate
- Hot days now (above 108°F)
- 7 days/yr
- Hot days in 30 yrs
- 19 days/yr
Wind risk 2/10 · Minimal
- Chance of severe wind over 30 yrs
- 2.0%
Air-quality risk 2/10 · Minimal
- Unhealthy air days now
- 0 days/yr
- Unhealthy air days in 30 yrs
- 1 days/yr
Risk factors via First Street. Map © Google.
Why this score? — see what drove the C+ grade
The composite is a weighted blend of 9 inputs, each scored 0–100. Each bar is that input's sub-score; the figure is the points it added to the 100-point composite (weight × sub-score).
- Cash flow +18.8/30.0
- ARV discount +15.0/15.0
- Appreciation +8.1/10.0
- DSCR +5.9/10.0
- 1% rule +3.7/10.0
- Schools +3.1/10.0
- Livability +2.9/5.0
- Rent growth +2.5/5.0
- Condition / age +2.5/5.0
$99,900
🖨 Deal sheet 📄 Offer letter ✓ Due diligence
Listing remarks MLS
Cute little cottage tucked back in the trees. Recently renovated with new paint and flooring. Has central heat and air and gas log fireplace. Unfortunately this is built from a partial mobile home with a well built add-on. So government loans are a no go. But priced accordingly to be a great 1st time home or investment.
Key facts
- Metal roof
- New flooring
- Large lot
Tags
Property features AI
Finance
- Financial info: Annual tax listed (amount provided in original data)
Exterior
- Parking: No designated parking
- Utilities: Septic tank
- Home design: Manufactured house; Single-family residence, freestanding
- Construction: Block foundation
- Exterior features: Metal roof; Irregular lot dimensions
Interior
- Bedrooms: Total of 5 rooms (includes bedrooms and living spaces)
- Flooring: Carpet; Laminate
- Bathrooms: 1 full bathroom
- Heating & cooling: Central heating; Forced air; Propane heating; Has cooling
- Interior features: Carpet and laminate flooring; Crawl space basement
Neighborhood map
What this means for you Summary
Snapshot
- This is a 2-bed/1.0-bath other listed at $100k.
Deal economics
- At list price, monthly cash flow is $101 ($1k/yr) — positive.
- The deal already cash-flows at list — no discount required.
- To meet the 1% rule (rent ≥ 1% of price), the offer needs to be $87k (13.1% below list).
- Recommended offer: $87k (13.1% below list) — sets the bar for 1% rule.
Location & tenants
- Location reads 58/100 on livability (#596 in MO) — a working-class tenant base; expect higher turnover. Strengths: cost of living A+, crime A; Watch: housing D+, amenities F, commute F.
- Mcdonald County R-I (rural): math 34% / reading 41% proficiency, ranked #192 of 324 in MO (top 59%) — families likely to look elsewhere, expect single-tenant / working-renter base with shorter leases; 61% free/reduced lunch — lower-income household profile, screen leases tightly.
- Zoned schools: Noel Primary (235 students, 83% FRL); Noel Elem. (math 23% / reading 24%, grade F, #328 of 391 statewide, top 84%, 359 students, 84% FRL) — zoned schools average 83% FRL vs 61% district-wide (22 pts higher); higher-poverty schools than district average — tighter screening recommended.
- Zoned-school proficiency averages 24% at this address vs 38% district-wide (-14 pts) — the specific schools serving this property underperform the Mcdonald County R-I average; the district grade overstates school quality for this exact location.
- Market conditions: 61 active listings in the ZIP; 20 units permitted in McDonald County in 2024 (0 in 5+ unit buildings).
Forward outlook
- In year one you build about $7k of equity ($691 loan paydown + $6k appreciation (6.2% local appreciation)).
- McDonald County population projected at -14% by 2050 — secular population decline; favor cash flow + early exit over multi-decade hold.
- At projected returns (6.2% appreciation + 3.0% rent growth), your $28k cash investment doubles in ~4 years — after that, you're playing with house money.
- By year 5, paydown + projected appreciation supports a ~$30k cash-out refi (75% LTV) — recoverable capital for the next deal without selling this one.
Negotiation context
- It's been on market 40 days — a 3% lower offer ($97k) is reasonable based on typical stale-listing flexibility.
- 2 sale attempts with the ask held roughly flat each time — persistent listings suggest the price (not the market) is what's stuck; bring a comps-based counter.
Risks & watch-outs
- Climate carrying-cost: extreme-heat days projected 7→19/yr by 2055 (HVAC capex compounding) — expect insurance premiums to compound above CPI over the hold.
Questions for the listing agent
- It's been on market 40 days. Have you received any prior offers? Is the seller open to a 13% concession, seller financing, or rate buy-down credit?
- Built in 1978 — when were the roof, HVAC, electrical panel, plumbing, and water heater last replaced?
- Is there a deadline driving the sale (1031 exchange, divorce, estate, relocation)? That informs how much negotiation room exists.
- Schools are F-rated, which usually means shorter tenancies and higher turnover. Who's the typical renter profile here, and what's been the actual vacancy rate?
- What's the average days-on-market for RENTAL listings here right now (not sales)? A rising rental-DOM trend means longer vacancies and softer asking-rent achievability than the comps imply.
- What's the recent tenant-quality profile in this submarket — average credit score on applications, eviction rate, late-payment / NSF rate, and stable-employment percentage? A property-management company in the area should have these aggregated.
- How much new for-sale + rental construction is in the pipeline within 1–3 miles? Heavy new supply typically softens prices + rents 12–24 months out; constrained supply supports both.
Investment metrics
- 1% rule
- 0.87% ✗
- Cap rate
- 7.51%
- Cash-on-cash
- 4.34%
- DSCR
- 1.19
- GRM
- 9.6
CMA / ARV
- ARV (median comp)
- $160,993
- List price
- $99,900
- Delta
- -37.95%
- Verdict
- UNDERPRICED
- Comps
- 6 within 1.0 mi
Projected returns pro-forma
6.16% appreciation · 3.0% rent growth · sell at horizon
- IRR
- 19.2%
- Equity multiple
- 2.29×
- Total profit
- $36,150
- Equity at exit
- $63,781
- IRR
- 18.6%
- Equity multiple
- 4.61×
- Total profit
- $100,952
- Equity at exit
- $116,518
Cash invested: $27,972 (down + closing). Projections, not guarantees.
Landlord ↔ Tenant lean methodology
- Overall (STATE)
- 81 Strongly Landlord-Friendly
- State Missouri
- 81 Strongly Landlord-Friendly · R+10
- County
- — inherits STATE
- City
- — inherits STATE
ZIP-level market 64854
- Home prices YoY
- 4.1%
- Active inventory
- 61
- Price-to-rent
- 9.6×
Monthly cashflow live
- Estimated rent
- $868 medium interval (Pro) →
- Mortgage (P&I)
- −$524
- Tax from tax record
- −$19 /mo · $230/yr
- Insurance
- −$42
- HOA
- −$0
- Vacancy / Maint / Mgmt
- −$182
- Net cashflow
- $101
Break-even live
UW: 25.0% down · 7.5% · 30yr · 1.5% tax · 5.0% vac · 8.0% maint · 8.0% mgmt
Financing live
Cash to close
- Down payment
- $24,975
- Closing costs
- $2,997
- Reserves months
- —
- Total cash needed
- —
Loan-product check · same deal, 3 products live
Conventional
25% down · 7.5% · 30yr
- Down + closing
- —
- Monthly P&I
- —
- Monthly cashflow
- —
- DSCR
- —
- Eligible?
- —
Personal DTI + credit; lowest rate.
DSCR
20% down · 8.5% · 30yr
- Down + closing
- —
- Monthly P&I
- —
- Monthly cashflow
- —
- DSCR
- —
- Eligible?
- —
No personal income docs; deal must DSCR.
Hard money
10% down · 12.0% · 12mo
- Down + closing
- —
- Monthly P&I
- —
- Monthly cashflow
- —
- DSCR
- —
- Eligible?
- —
Short-term bridge; refi at stabilization.
Listing history 18 events
-
2026-06-18days on market $99,900 Active 40 DOM
-
2026-06-17days on market $99,900 Active 39 DOM
-
2026-06-16days on market $99,900 Active 38 DOM
-
2026-06-15days on market $99,900 Active 37 DOM
-
2026-06-14days on market $99,900 Active 35 DOM
-
2026-06-13days on market $99,900 Active 34 DOM
-
2026-06-10days on market $99,900 Active 32 DOM
-
2026-06-09days on market $99,900 Active 31 DOM
-
2026-06-08days on market $99,900 Active 30 DOM
-
2026-06-07days on market $99,900 Active 29 DOM
-
2026-06-03days on market $99,900 Active 25 DOM
-
2026-06-02days on market $99,900 Active 24 DOM
-
2026-06-01days on market $99,900 Active 23 DOM
-
2026-05-31days on market $99,900 Active 22 DOM
-
2026-05-31days on market $99,900 Active 21 DOM
-
2026-05-09$99,900 Active 329-char remark
Show marketing remark (322 chars)
Cute little cottage tucked back in the trees. Recently renovated with new paint and flooring. Has central heat and air and gas log fireplace. Unfortunately this is built from a partial mobile home with a well built add-on. So government loans are a no go. But priced accordingly to be a great 1st time home or investment.
-
2026-05-09$99,900 Active 322-char remark
Show marketing remark (322 chars)
Cute little cottage tucked back in the trees. Recently renovated with new paint and flooring. Has central heat and air and gas log fireplace. Unfortunately this is built from a partial mobile home with a well built add-on. So government loans are a no go. But priced accordingly to be a great 1st time home or investment.
-
2021-10-20soldstatus
ⓘ Source: listings_history table (triggers on properties + properties_extension) + one-shot
backfill from property_details.listing_events for pre-trigger history.
Tax reassessment forecast MO · Resets to sale price
- Current annual tax
- $230 · $19/mo
- Projected year-2 tax
- $969 · $81/mo
- Expected delta
- +$739/yr (+$62/mo · 320.8%)
ⓘ Screening estimate from a state-policy table — verify with the county assessor before closing.
Climate risk First Street
- Flood 1/10 Low FEMA zone X (unshaded) · 0% chance over 30 yrs
- Wildfire 4/10 Moderate
- Heat 5/10 Major 7 d/yr ≥108°F today · 19 d/yr by 30 yrs out
- Wind 2/10 Low 2% chance of damaging wind over 30 yrs
- Air quality 2/10 Low 0 unhealthy d/yr today · 1 by 30 yrs out
Nearby sold comps map
Loading sold comps map…
Walkable amenities ~0.75 mi
Loading nearby amenities…
Taxation est. · year 1
- Rental income
- $10,417
- − Mortgage interest
- −$5,596
- − Property taxes
- −$230
- − Insurance
- −$500
- − Repairs & maintenance
- −$833
- − Management
- −$833
- − Depreciation
- −$2,906
- Taxable loss
- −$482
- Est. tax savings @ 24.0%
- +$116
- After-tax cash flow
- $1,329/yr
For passive investors: Depreciation is non-cash, so a rental often shows a tax loss while cash-flowing — sheltering income. Rental losses are passive: they offset passive income freely, and up to $25,000/yr can offset ordinary (W-2) income if you actively participate and your MAGI is under $100k (phasing out to $0 by $150k); unused losses carry forward. On sale, claimed depreciation is recaptured at up to 25%, and gains may owe capital-gains tax (a 1031 exchange can defer both). Figures are a year-1 estimate at your 24.0% rate — not tax advice; consult a CPA.
Schools (NCES district)
- District
- Mcdonald County R-I
- NCES district ID
- 2920610
- Math proficiency
- 34% ▼ -8.00%
- Reading proficiency
- 41% ▼ -9.00%
- Median HH income
- $38,301
- Composite
- 31.28/100
- National rank
- #6017
- State rank
- #192 of 324 in MO
Livability — Noel
- Score
- 58/100
- State rank
- #596
- US rank
- #21033
Category grades
Schools grade is shown separately in the Schools card above.
Census & demographics
- Population (ZIP)
- 4,867
Population outlook (McDonald County) Hauer SSP2
- Today (2025)
- 21,753 people
- By 2030
- 21,154 · -2.8%
- By 2040
- 19,946 · -8.3%
- By 2050
- 18,666 · -14.2%
- By 2075
- 16,201 · -25.5%
- By 2100
- 14,550 · -33.1%
Race, ethnicity, and origin ACS 2023
- Neighborhood character
- Highly diverse neighborhood (Simpson 0.77)
- Race & ethnicity
- White 42% Two or more races 23% Hispanic / Latino 23% Pacific Islander 10% Black 7%
- Hispanic origin (detail)
- Mexican 19%
- Common ancestry
- Lithuanian 2% Portuguese 1% Serbian 1%
- Foreign-born
- 24% · Canada
- Languages at home
- 69% English-only · Spanish 14% Other Asian/Pacific 11%
Political lean MEDSL · McDonald
- 2024 margin
- Solid R (+68.8) · D 15.2% · R 84.0%
- 2008→2024 swing
- -31.3pp toward R · 2008: -37.4pp · 2024: -68.8pp
- All cycles
- 2024: R+68.8 2020: R+66.6 2016: R+64.0 2012: R+48.3 2008: R+37.4
Not yet ingested
- Civics
- —
Market trends
- HPI YoY
- ▲ 6.16%
- Current HPI
- 155.1317
- Rent YoY
- —
- Metro
- —
- State GDP YoY
- ▲ 1.84%
- F500 in state
- 20
Industry mix (Fortune 500 HQ in MO)
| Industry | F500 HQs | Revenue |
|---|---|---|
| Healthcare | 1 | $163B |
|
||
| Insurance | 1 | $21B |
|
||
| Industrial Technology | 1 | $17B |
|
||
| Retail | 1 | $16B |
|
||
| Industrial Distribution | 1 | $10B |
|
||
| Utilities | 1 | $9B |
|
||
Price history
+0.0% since first listed3 events — show timeline
- 2026-05-09 Listed $99,900 SOMO
- 2026-05-09 Listed $99,900 OGAR
- 2021-10-20 Sold (Public Records) — Public Records
Property tax history
+1.3%/yrLatest (2025): $230 · +8.4% YoY. Source: county tax records.
Cash-flow waterfall
monthlySold comps — $/sqft
last 12 mo · ≤1 miLoading sold comps…