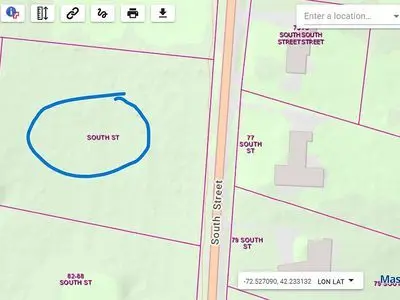
0 South St · Granby, MA
Flood risk No data
- FEMA flood zone
- —
- Chance of flooding over 30 yrs
- —
- Est. flood insurance / yr
- —
Fire risk No data
- Est. fire insurance / yr
- —
Heat risk No data
- Hot days now (above threshold)
- —
- Hot days in 30 yrs
- —
Wind risk No data
- Chance of severe wind over 30 yrs
- —
Air-quality risk No data
- Unhealthy air days now
- —
- Unhealthy air days in 30 yrs
- —
Risk factors via First Street. Map © Google.
Why this score? — see what drove the C+ grade
The composite is a weighted blend of 9 inputs, each scored 0–100. Each bar is that input's sub-score; the figure is the points it added to the 100-point composite (weight × sub-score).
- Cash flow +29.3/30.0
- DSCR +10.0/10.0
- 1% rule +8.2/10.0
- ARV discount +7.5/15.0
- Livability +3.8/5.0
- Schools +2.7/10.0
- Rent growth +2.5/5.0
- Condition / age +1.0/5.0
- Appreciation +0.0/10.0
$130,000
🖨 Deal sheet (PDF) 📄 Offer letter ✓ Due diligence
Listing remarks
Beautiful Wooded Flat piece of land, Buyers do your diligence.
Key facts
- Listed 16 days
Neighborhood map
What this means for you Summary
Snapshot
- This is a 3-bed/200.0-bath other listed at $130k. Condition is rated poor.
Deal economics
- At list price, monthly cash flow is $456 ($5k/yr) — positive.
- The deal already cash-flows at list — no discount required.
- Meets the 1% rule at list price ($2k rent vs $130k).
- Recommended offer: $128k (1.5% below list) — sets the bar for market timing.
- Cap rate 10.5% vs local median 1.8% in Granby — top-decile yield for the area; either an underpriced asset or a hidden risk that comps aren't pricing in. Stress-test before assuming the spread holds.
Location & tenants
- Location reads 75/100 on livability (#75 in MA, #4,095 nationally) — a middle-class / working-renter tenant base. Strengths: crime A+, employment A+, housing A+; Watch: amenities F, health & safety F.
- Granby (rural): math 21% / reading 36% proficiency, ranked #249 of 302 in MA (top 82%) — low school quality limits family demand, transient renter base, plan for 1-2y turnover; only 17% free/reduced lunch — higher-income household profile.
- Zoned schools: East Meadow (math 12% / reading 32%, grade F, #757 of 938 statewide, top 82%, 407 students, 0% FRL); East Meadow (math 12% / reading 32%, grade F, #757 of 938 statewide, top 82%, 407 students, 0% FRL); Granby Jr Sr High School (math 32% / reading 42%, grade F, #238 of 343 statewide, top 71%, 311 students, 0% FRL) — zoned schools average 0% FRL vs 17% district-wide (17 pts lower); this property's tenant base skews higher-income than the district average.
- Market conditions: 19 active listings in the ZIP; 349 units permitted in Hampshire County in 2024 (185 in 5+ unit buildings).
Forward outlook
- Local home prices are declining (-3.0%/yr); year-one equity from $899 of loan paydown is wiped out by about $4k of value loss. Plan a longer hold.
- Hampshire County population projected at +5% by 2050 — modest demand growth; plan on rents tracking national, not racing it.
- At projected returns (-3.0% appreciation + 3.0% rent growth), your $36k cash investment doubles in ~8 years — after that, you're playing with house money.
Negotiation context
- It's been on market 16 days — a 2% lower offer ($128k) is reasonable based on typical stale-listing flexibility.
Questions for the listing agent
- Have any recent inspections been done? Can we get a copy of the seller's disclosures and any deferred-maintenance estimates?
- Is there a deadline driving the sale (1031 exchange, divorce, estate, relocation)? That informs how much negotiation room exists.
- What's the average days-on-market for RENTAL listings here right now (not sales)? A rising rental-DOM trend means longer vacancies and softer asking-rent achievability than the comps imply.
- What's the recent tenant-quality profile in this submarket — average credit score on applications, eviction rate, late-payment / NSF rate, and stable-employment percentage? A property-management company in the area should have these aggregated.
- How much new for-sale + rental construction is in the pipeline within 1–3 miles? Heavy new supply typically softens prices + rents 12–24 months out; constrained supply supports both.
Investment metrics
- 1% rule
- 1.32% ✓
- Cap rate
- 10.51%
- Cash-on-cash
- 15.04%
- DSCR
- 1.67
- GRM
- 6.3
CMA / ARV
No comps found within radius.
Projected returns pro-forma
-3.0% appreciation · 3.0% rent growth · sell at horizon
- IRR
- 5.7%
- Equity multiple
- 1.22×
- Total profit
- $8,025
- Equity at exit
- $19,383
- IRR
- 15.1%
- Equity multiple
- 2.22×
- Total profit
- $44,518
- Equity at exit
- $11,240
Cash invested: $36,400 (down + closing). Projections, not guarantees.
Landlord ↔ Tenant lean methodology
- Overall (STATE)
- 20 Strongly Tenant-Friendly
- State Massachusetts
- 20 Strongly Tenant-Friendly · D+15
- County
- — inherits STATE
- City
- — inherits STATE
ZIP-level market 01033
- Home prices YoY
- -28.3%
- Active inventory
- 19
- Price-to-rent
- 6.3×
Monthly cashflow live
- Estimated rent
- $1,715 medium interval (Pro) →
- Mortgage (P&I)
- −$682
- Tax est. 1.5%
- −$162 /mo · $1,950/yr
- Insurance
- −$54
- HOA
- −$0
- Vacancy / Maint / Mgmt
- −$360
- Net cashflow
- $456
Break-even live
Sensitivity live
| Price | -10% $546 | -5% $501 | +0% $456 | +5% $411 | +10% $366 |
|---|---|---|---|---|---|
| Rent | -10% $321 | -5% $389 | +0% $456 | +5% $524 | +10% $592 |
| Rate | -1.0pp $522 | -0.5pp $489 | base $456 | +0.5pp $423 | +1.0pp $388 |
UW: 25.0% down · 7.5% · 30yr · 1.5% tax · 5.0% vac · 8.0% maint · 8.0% mgmt
Financing live
Cash to close
- Down payment
- $32,500
- Closing costs
- $3,900
- Reserves months
- —
- Total cash needed
- —
Loan-product check · same deal, 3 products live
Conventional
25% down · 7.5% · 30yr
- Down + closing
- —
- Monthly P&I
- —
- Monthly cashflow
- —
- DSCR
- —
- Eligible?
- —
Personal DTI + credit; lowest rate.
DSCR
20% down · 8.5% · 30yr
- Down + closing
- —
- Monthly P&I
- —
- Monthly cashflow
- —
- DSCR
- —
- Eligible?
- —
No personal income docs; deal must DSCR.
Hard money
10% down · 12.0% · 12mo
- Down + closing
- —
- Monthly P&I
- —
- Monthly cashflow
- —
- DSCR
- —
- Eligible?
- —
Short-term bridge; refi at stabilization.
Listing history 12 events
-
2026-06-21days on market $130,000 Active 16 DOM
-
2026-06-18days on market $130,000 Active 13 DOM
-
2026-06-17days on market $130,000 Active 12 DOM
-
2026-06-16days on market $130,000 Active 11 DOM
-
2026-06-15days on market $130,000 Active 10 DOM
-
2026-06-14days on market $130,000 Active 8 DOM
-
2026-06-13days on market $130,000 Active 7 DOM
-
2026-06-10days on market $130,000 Active 5 DOM
-
2026-06-09days on market $130,000 Active 4 DOM
-
2026-06-08days on market $130,000 Active 3 DOM
-
2026-06-07remarks 62-char remark
-
2026-06-07$130,000 Active 2 DOM
ⓘ Source: listings_history table (triggers on properties + properties_extension) + one-shot
backfill from property_details.listing_events for pre-trigger history.
Nearby sold comps map
Loading sold comps map…
Walkable amenities ~0.75 mi
Loading nearby amenities…
Taxation est. · year 1
- Rental income
- $20,578
- − Mortgage interest
- −$7,282
- − Property taxes
- −$1,950
- − Insurance
- −$650
- − Repairs & maintenance
- −$1,646
- − Management
- −$1,646
- − Depreciation
- −$3,782
- Taxable income
- $3,622
- Est. tax owed @ 24.0%
- −$869
- After-tax cash flow
- $4,607/yr
For passive investors: Depreciation is non-cash, so a rental often shows a tax loss while cash-flowing — sheltering income. Rental losses are passive: they offset passive income freely, and up to $25,000/yr can offset ordinary (W-2) income if you actively participate and your MAGI is under $100k (phasing out to $0 by $150k); unused losses carry forward. On sale, claimed depreciation is recaptured at up to 25%, and gains may owe capital-gains tax (a 1031 exchange can defer both). Figures are a year-1 estimate at your 24.0% rate — not tax advice; consult a CPA.
Condition & rehab AI · 2 photos
This property requires extensive repairs and renovations, including a new roof and exterior renovation, to become move-in ready.
Repairs flagged
- Major roof — Large footprint suggests significant structural issues
- Major exterior — Large footprint suggests significant structural issues
Value-add opportunities
- Resale roof replacement — A new roof would significantly improve the home's appearance and value
- Resale exterior renovation — A fresh exterior would enhance curb appeal and attract potential buyers
Renovation cost estimate screening
| Repair item | Severity | Est. cost |
|---|---|---|
| roof · Large footprint suggests significant structural issues | Major | $15,000–50,000 |
| exterior · Large footprint suggests significant structural issues | Major | $15,000–50,000 |
| Total estimated repair cost · 2 items | $30,000–100,000 |
Value-add ROI direction
- Resale roof replacement — A new roof would significantly improve the home's appearance and value ↑
- Resale exterior renovation — A fresh exterior would enhance curb appeal and attract potential buyers ↑
ⓘ Cost ranges are severity-bucket heuristics (US national rule-of-thumb). Get contractor quotes + a written scope before underwriting a rehab budget.
Schools (NCES district)
- District
- Granby
- NCES district ID
- 2505400
- Math proficiency
- 21% ▼ -21.00%
- Reading proficiency
- 36% ▼ -12.00%
- Median HH income
- $77,006
- Composite
- 27.49/100
- National rank
- #6954
- State rank
- #249 of 302 in MA
Livability — Granby
- Score
- 75/100
- State rank
- #75
- US rank
- #4095
Category grades
Schools grade is shown separately in the Schools card above.
Census & demographics
- Population (ZIP)
- 6,088
Population outlook (Hampshire County) Hauer SSP2
- Today (2025)
- 166,577 people
- By 2030
- 168,928 · +1.4%
- By 2040
- 171,197 · +2.8%
- By 2050
- 175,542 · +5.4%
- By 2075
- 199,884 · +20.0%
- By 2100
- 211,819 · +27.2%
Race, ethnicity, and origin ACS 2023
- Neighborhood character
- Predominantly White (92%)
- Race & ethnicity
- White 92% Hispanic / Latino 4% Two or more races 3% Black 2%
- Common ancestry
- Lithuanian 12% Romanian 9% Slovak 2%
- Foreign-born
- 4%
- Languages at home
- 93% English-only · Spanish 2% Other Indo-European 2% French/Haitian/Cajun 1%
Political lean MEDSL · Hampshire
- 2024 margin
- Solid D (+41.9) · D 69.5% · R 27.6% · Other 2.9%
- 2008→2024 swing
- -3.6pp toward R · 2008: 45.6pp · 2024: 41.9pp
- All cycles
- 2024: D+41.9 2020: D+46.8 2016: D+39.5 2012: D+43.8 2008: D+45.6
Not yet ingested
- Civics
- —
Market trends
- HPI YoY
- ▼ -105.99%
- Current HPI
- 268.8129
- Rent YoY
- —
- Metro
- —
- State GDP YoY
- ▲ 2.28%
- F500 in state
- 38
Industry mix (Fortune 500 HQ in MA)
| Industry | F500 HQs | Revenue |
|---|---|---|
| Technology | 3 | $17B |
|
||
| Insurance | 2 | $84B |
|
||
| Retail | 2 | $76B |
|
||
| Life Sciences | 1 | $43B |
|
||
| Energy Technology | 1 | $31B |
|
||
| Aerospace / Defense | 1 | $18B |
|
||
Price history
1 event — show timeline
- 2026-06-06 Listed $130,000 FSBO.com
Cash-flow waterfall
monthlySold comps — $/sqft
last 12 mo · ≤1 miLoading sold comps…