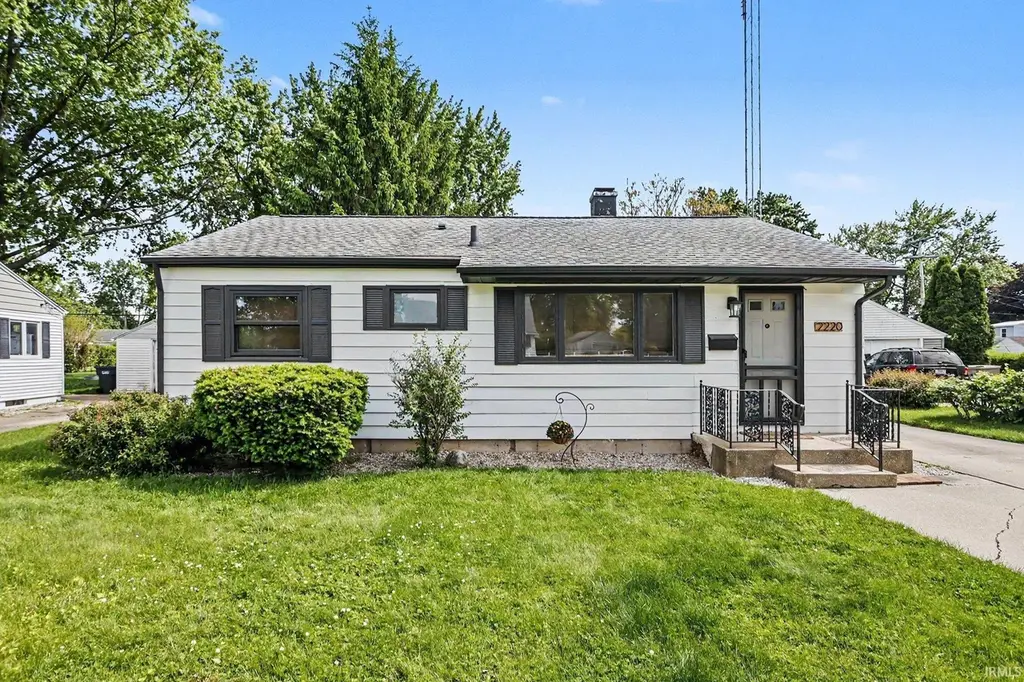
2220 Solomon Ave · South Bend, IN
Flood risk 3/10 · Minor
- FEMA flood zone
- X (unshaded)
- Chance of flooding over 30 yrs
- 0.2%
- Est. flood insurance / yr
- $473 – $860
Fire risk 1/10 · Minimal
- Est. fire insurance / yr
- $717 – $1,331
Heat risk 2/10 · Minimal
- Hot days now (above 99°F)
- 7 days/yr
- Hot days in 30 yrs
- 16 days/yr
Wind risk 2/10 · Minimal
- Chance of severe wind over 30 yrs
- —
Air-quality risk 3/10 · Minor
- Unhealthy air days now
- 2 days/yr
- Unhealthy air days in 30 yrs
- 3 days/yr
Risk factors via First Street. Map © Google.
Why this score? — see what drove the F grade
The composite is a weighted blend of 9 inputs, each scored 0–100. Each bar is that input's sub-score; the figure is the points it added to the 100-point composite (weight × sub-score).
- Cash flow +4.7/30.0
- Rent growth +4.1/5.0
- Livability +3.2/5.0
- Condition / age +2.5/5.0
- Schools +1.4/10.0
- 1% rule +0.0/10.0
- DSCR +0.0/10.0
- ARV discount +0.0/15.0
- Appreciation +0.0/10.0
$279,000
🖨 Deal sheet (PDF) 📄 Offer letter ✓ Due diligence
Listing remarks MLS
Solid well built home near Notre Dame. Home features Corian counter tops in kitchen with farmer sink, newer stainless steel appliances. Hi efficiency furnace, AC and water heater 1 year old. 3 bedrooms 1 bath on main floor with separate LR AND Family room. Family room opens to large deck over looking private, fully fenced rear yard with separate dog area. Basement finish includes family room space and separate study with closet. Laundry area includes installed bathroom fixtures for future use. Home is turn key with all appliances.
Key facts
- Flexible bonus space
- Updated kitchen
- Open shelving
Tags
Property features AI
Exterior
- Parking: Detached 1-car garage
- Utilities: Public water; Public sewer
- Home design: Single-family residence, site-built; One story
- Construction: Asphalt construction materials; Slab foundation; Below-grade finished area (basement) and above-grade finished area
- Exterior features: Level lot; Full chain link fencing; Lot dimensions approximately 70 x 155
Interior
- Kitchen: Electric oven; Dishwasher; Refrigerator
- Bathrooms: One full bathroom on the main level
- Heating & cooling: Forced air heating; Central air conditioning
- Interior features: Finished full basement; 11 total rooms; Washer and dryer included
- Laundry & utility: Washer hookup; Electric dryer hookup; Laundry located in basement
Neighborhood map
What this means for you Summary
Snapshot
- This is a 3-bed/1.0-bath single-family listed at $279k.
Deal economics
- At list price, monthly cash flow is $-693 ($-8k/yr) — negative.
- To cash-flow at today's rent, offer at most $157k (43.9% below list).
- To meet the 1% rule (rent ≥ 1% of price), the offer needs to be $134k (52.2% below list).
- Recommended offer: $134k (52.2% below list) — sets the bar for 1% rule.
- Cap rate 3.3% vs local median 4.3% in South Bend — below-typical yield; the buyer is paying a premium for something (appreciation thesis, condition, location) that the cap rate doesn't capture.
Location & tenants
- Location reads 64/100 on livability (#365 in IN) — a middle-class / working-renter tenant base. Strengths: cost of living A+, housing A+, health & safety A+; Watch: amenities D, employment D, crime F.
- South Bend Community School Corporation (urban): math 12% / reading 21% proficiency, ranked #284 of 301 in IN (top 94%) — low school quality limits family demand, transient renter base, plan for 1-2y turnover; 66% free/reduced lunch — lower-income household profile, screen leases tightly.
- Zoned schools: Kennedy Academy (math 45% / reading 52%, grade D, #304 of 994 statewide, top 31%, 520 students, 61% FRL); Edison Middle School (math 7% / reading 13%, grade F, #314 of 330 statewide, top 95%, 381 students, 84% FRL); Adams High School (math 28% / reading 57%, grade F, #195 of 369 statewide, top 53%, 1,976 students, 56% FRL) — zoned schools at 67% FRL track the district average.
- Zoned-school proficiency averages 34% at this address vs 16% district-wide (+17 pts) — the actual schools serving this property are materially stronger than the South Bend Community School Corporation average implies; a family-tenant draw the district grade alone would hide.
- Market conditions: Rents rising fast (+6.3%/yr); 76 active listings in the ZIP; 13 comparable units currently listed for rent nearby; rentals at typical pace (median 23d on market — plan ~3-4 weeks tenant-placement turnaround); 754 units permitted in St. Joseph County in 2024 (460 in 5+ unit buildings).
Forward outlook
- Local home prices are declining (-3.0%/yr); year-one equity from $2k of loan paydown is wiped out by about $8k of value loss. Plan a longer hold.
Negotiation context
- Only 2 days on market — expect competitive offers; lowballing is unlikely to land.
- 4 sale attempts since 7y ago with the ask held roughly flat each time — persistent listings suggest the price (not the market) is what's stuck; bring a comps-based counter.
- Current owner paid $220k; 27% above their basis — modest negotiation headroom, anchor on the comps not their cost.
Risks & watch-outs
- Watch-outs: built in 1953 — expect roof / HVAC / electrical / plumbing capex.
Questions for the listing agent
- What do current leases actually rent for vs. the listed asking? Can we see a recent rent roll and the last 12 months of T-12 income?
- Built in 1953 — when were the roof, HVAC, electrical panel, plumbing, and water heater last replaced?
- Is there a deadline driving the sale (1031 exchange, divorce, estate, relocation)? That informs how much negotiation room exists.
- Schools are F-rated, which usually means shorter tenancies and higher turnover. Who's the typical renter profile here, and what's been the actual vacancy rate?
- Crime grade is F in this area — have there been break-ins, vandalism, or insurance claims at this property in the last 3 years? What carrier currently insures it and at what premium?
- The area grade is low — what's the realistic commute time and amenity access for the typical tenant pool here? Any planned neighborhood developments (good or bad) we should know about?
- What's the average days-on-market for RENTAL listings here right now (not sales)? A rising rental-DOM trend means longer vacancies and softer asking-rent achievability than the comps imply.
- What's the recent tenant-quality profile in this submarket — average credit score on applications, eviction rate, late-payment / NSF rate, and stable-employment percentage? A property-management company in the area should have these aggregated.
- How much new for-sale + rental construction is in the pipeline within 1–3 miles? Heavy new supply typically softens prices + rents 12–24 months out; constrained supply supports both.
Investment metrics
- 1% rule
- 0.48% ✗
- Cap rate
- 3.31%
- Cash-on-cash
- -10.64%
- DSCR
- 0.53
- GRM
- 17.4
CMA / ARV
- ARV (on-the-fly)
- $196,560
- Comps found
- 12
Show comp detail 12 sales within ~0.75 mi
| Address | Dist | Beds/Ba | Sqft | Sold | Price | $/sf | Match |
|---|---|---|---|---|---|---|---|
| 2405 Rockne Dr | 0.10mi | 3/1.0 | 1,184 (+8%) | 2mo | $210,000 | $177 | 80 |
| 1329 Pyle Ave | 0.29mi | 3/1.0 | 1,137 (+4%) | 9mo | $220,000 | $193 | 72 |
| 1904 E Hartman Dr | 0.31mi | 2/1.0 (-1) | 1,149 (+5%) | 1mo | $207,000 | $180 | 71 |
| 2715 Edison Rd | 0.48mi | 3/1.0 | 1,080 (-1%) | 6mo | $182,500 | $169 | 71 |
| 3215 Bentley Ln | 0.68mi | 3/1.0 | 1,064 (-3%) | 3mo | $180,000 | $169 | 62 |
| 627 Manchester Dr | 0.73mi | 3/2.0 | 1,120 (+3%) | 1mo | $221,200 | $198 | 57 |
| 1740 Rockne St | 0.45mi | 3/2.0 | 1,200 (+10%) | 7mo | $230,000 | $192 | 53 |
| 1605 E Madison St | 0.72mi | 3/1.0 | 1,211 (+11%) | 0mo | $320,100 | $264 | 48 |
| 3003 Wilder Dr | 0.65mi | 3/1.5 | 1,008 (-8%) | 9mo | $175,000 | $174 | 47 |
| 3113 Salem Dr | 0.65mi | 3/1.5 | 952 (-13%) | 8mo | $154,500 | $162 | 40 |
| 1239 Brummit Ln | 0.62mi | 4/2.0 (+1) | 1,232 (+13%) | 6mo | $196,887 | $160 | 36 |
| 1207 Manchester Dr | 0.74mi | 4/2.0 (+1) | 1,232 (+13%) | 1mo | $235,000 | $191 | 35 |
Match score weights: distance 35% · size 25% · config 20% · recency 20%. Top-matched comps best support the ARV.
Projected returns pro-forma
-3.0% appreciation · 6.27% rent growth · sell at horizon
- IRR
- -32.6%
- Equity multiple
- -0.09×
- Total profit
- $-84,881
- Equity at exit
- $41,600
- IRR
- -26.9%
- Equity multiple
- -0.42×
- Total profit
- $-111,179
- Equity at exit
- $24,123
Cash invested: $78,120 (down + closing). Projections, not guarantees.
Landlord ↔ Tenant lean methodology
- Overall (STATE)
- 90 Strongly Landlord-Friendly
- State Indiana
- 90 Strongly Landlord-Friendly · R+11
- County
- — inherits STATE
- City
- — inherits STATE
ZIP-level market 46615
- Home prices YoY
- -34.0%
- Rents YoY
- 6.3%
- Active inventory
- 76
- Price-to-rent
- 17.4×
Monthly cashflow live
- Estimated rent
- $1,335 high interval (Pro) →
- Mortgage (P&I)
- −$1,463
- Tax from tax record
- −$168 /mo · $2,015/yr
- Insurance
- −$116
- HOA
- −$0
- Vacancy / Maint / Mgmt
- −$280
- Net cashflow
- $-693
Break-even live
Sensitivity live
| Price | -10% $-535 | -5% $-614 | +0% $-693 | +5% $-772 | +10% $-851 |
|---|---|---|---|---|---|
| Rent | -10% $-798 | -5% $-745 | +0% $-693 | +5% $-640 | +10% $-587 |
| Rate | -1.0pp $-552 | -0.5pp $-622 | base $-693 | +0.5pp $-765 | +1.0pp $-839 |
UW: 25.0% down · 7.5% · 30yr · 1.5% tax · 5.0% vac · 8.0% maint · 8.0% mgmt
Financing live
Cash to close
- Down payment
- $69,750
- Closing costs
- $8,370
- Reserves months
- —
- Total cash needed
- —
Loan-product check · same deal, 3 products live
Conventional
25% down · 7.5% · 30yr
- Down + closing
- —
- Monthly P&I
- —
- Monthly cashflow
- —
- DSCR
- —
- Eligible?
- —
Personal DTI + credit; lowest rate.
DSCR
20% down · 8.5% · 30yr
- Down + closing
- —
- Monthly P&I
- —
- Monthly cashflow
- —
- DSCR
- —
- Eligible?
- —
No personal income docs; deal must DSCR.
Hard money
10% down · 12.0% · 12mo
- Down + closing
- —
- Monthly P&I
- —
- Monthly cashflow
- —
- DSCR
- —
- Eligible?
- —
Short-term bridge; refi at stabilization.
Rent comps 13 comps
| Address | Beds | Baths | Sqft | Rent | $/sqft | DOM | Units | Dist |
|---|---|---|---|---|---|---|---|---|
| 1512 Rosemary Ln South Bend, IN | 2.0 | 1.0 | 910 | $1,138 | $1.25 | 22d | 1 | 0.48mi |
| 1234 Bissell St South Bend, IN | 2.0 | 1.0 | 704 | $1,249 | $1.77 | 45d | 1 | 0.92mi |
| 1222 Chalfant St South Bend, IN | 3.0 | 1.0 | 992 | $1,300 | $1.31 | 45d | 1 | 0.93mi |
| 1018 S Bend Ave South Bend, IN | 2.0 | 1.0–2.0 | 836 | $2,950 | $3.53 | 15d | 27 | 1.02mi |
| 1145 N Eddy St South Bend, IN | 3.0 | 1.0–3.0 | 959 | $4,377 | $4.56 | 45d | 1 | 1.09mi |
| 3001 E Jefferson Blvd South Bend, IN | 1.0–2.0 | 1.0–2.0 | 848 | $1,329 | $1.57 | 15d | 21 | 1.17mi |
| 427 S 27th St South Bend, IN | 2.0 | 1.0 | 840 | $950 | $1.13 | 45d | 1 | 1.22mi |
| 300 Pin Oak Cir Mishawaka, IN | 1.0–3.0 | 1.0–1.5 | 835 | $1,225 | $1.47 | 15d | 1 | 1.24mi |
| 526 S 28th St South Bend, IN | 2.0 | 1.0 | 1000 | $1,350 | $1.35 | 15d | 1 | 1.32mi |
| 1009 E Jefferson Blvd South Bend, IN | 2.0 | 1.0 | 770 | $1,049 | $1.36 | 22d | 1 | 1.45mi |
| 913 E Washington St South Bend, IN | 4.0 | 1.5 | 1312 | $1,295 | $0.99 | 22d | 1 | 1.45mi |
| 911 E Washington St South Bend, IN | 3.0 | 1.0 | 886 | $1,195 | $1.35 | 15d | 1 | 1.45mi |
| 754 S 23rd St South Bend, IN | 3.0 | 1.0 | 884 | $1,300 | $1.47 | 45d | 1 | 1.47mi |
Listing history 11 events
-
2026-05-31status $279,000 Pending 2 DOM
-
2026-05-30days on market $279,000 Active 2 DOM
-
2026-05-28$279,000 Active
-
2023-07-07soldstatus $220,000 Closed
-
2023-06-19historical
-
2023-06-15$220,000
-
2023-06-15historical
-
2021-12-20soldstatus $150,000 537-char remark
Show marketing remark (537 chars)
Solid well built home near Notre Dame. Home features Corian counter tops in kitchen with farmer sink, newer stainless steel appliances. Hi efficiency furnace, AC and water heater 1 year old. 3 bedrooms 1 bath on main floor with separate LR AND Family room. Family room opens to large deck over looking private, fully fenced rear yard with separate dog area. Basement finish includes family room space and separate study with closet. Laundry area includes installed bathroom fixtures for future use. Home is turn key with all appliances.
-
2021-10-08$155,000 537-char remark
Show marketing remark (537 chars)
Solid well built home near Notre Dame. Home features Corian counter tops in kitchen with farmer sink, newer stainless steel appliances. Hi efficiency furnace, AC and water heater 1 year old. 3 bedrooms 1 bath on main floor with separate LR AND Family room. Family room opens to large deck over looking private, fully fenced rear yard with separate dog area. Basement finish includes family room space and separate study with closet. Laundry area includes installed bathroom fixtures for future use. Home is turn key with all appliances.
-
2019-06-14soldstatus $123,500
-
2019-05-10$123,500
ⓘ Source: listings_history table (triggers on properties + properties_extension) + one-shot
backfill from property_details.listing_events for pre-trigger history.
Tax reassessment forecast IN · Partial reset (capped growth)
- Current annual tax
- $2,015 · $168/mo
- Projected year-2 tax
- $2,193 · $183/mo
- Expected delta
- +$178/yr (+$15/mo · 8.8%)
ⓘ Screening estimate from a state-policy table — verify with the county assessor before closing.
Climate risk First Street
- Flood 3/10 Moderate FEMA zone X (unshaded) · 20% chance over 30 yrs
- Wildfire 1/10 Low
- Heat 2/10 Low 7 d/yr ≥99°F today · 16 d/yr by 30 yrs out
- Wind 2/10 Low
- Air quality 3/10 Moderate 2 unhealthy d/yr today · 3 by 30 yrs out
Nearby sold comps map
Loading sold comps map…
Walkable amenities ~0.75 mi
Loading nearby amenities…
Taxation est. · year 1
- Rental income
- $16,020
- − Mortgage interest
- −$15,628
- − Property taxes
- −$2,015
- − Insurance
- −$1,395
- − Repairs & maintenance
- −$1,282
- − Management
- −$1,282
- − Depreciation
- −$8,116
- Taxable loss
- −$13,698
- Est. tax savings @ 24.0%
- +$3,288
- After-tax cash flow
- $-5,024/yr
For passive investors: Depreciation is non-cash, so a rental often shows a tax loss while cash-flowing — sheltering income. Rental losses are passive: they offset passive income freely, and up to $25,000/yr can offset ordinary (W-2) income if you actively participate and your MAGI is under $100k (phasing out to $0 by $150k); unused losses carry forward. On sale, claimed depreciation is recaptured at up to 25%, and gains may owe capital-gains tax (a 1031 exchange can defer both). Figures are a year-1 estimate at your 24.0% rate — not tax advice; consult a CPA.
Schools (NCES district)
- District
- South Bend Community School Corporation
- NCES district ID
- 1810290
- Math proficiency
- 12% ▼ -10.00%
- Reading proficiency
- 21% ▼ -6.00%
- Median HH income
- $41,935
- Composite
- 14.21/100
- National rank
- #9452
- State rank
- #284 of 301 in IN
Livability — South Bend
- Score
- 64/100
- State rank
- #365
- US rank
- #13730
Category grades
Schools grade is shown separately in the Schools card above.
Census & demographics
- Census place
- South Bend, IN
- County
- Saint Joseph County · 189,048 people
- City population
- 99,767
- Metro
- South Bend-Mishawaka, IN-MI
- Population (ZIP)
- 14,190
- Household income
- $62,964
- Rent vs Own
- Severe rent burden
- 420.0
Population outlook (St. Joseph County) Hauer SSP2
- Today (2025)
- 273,186 people
- By 2030
- 273,594 · +0.1%
- By 2040
- 271,641 · -0.6%
- By 2050
- 269,187 · -1.5%
- By 2075
- 263,136 · -3.7%
- By 2100
- 245,659 · -10.1%
Race, ethnicity, and origin ACS 2023
- Neighborhood character
- Predominantly White (65%)
- Race & ethnicity
- White 65% Black 14% Two or more races 11% Hispanic / Latino 10% Asian 3%
- Hispanic origin (detail)
- Mexican 8%
- Common ancestry
- Romanian 6% Italian 2% Serbian 2%
- Foreign-born
- 8% · Canada, Vietnam
- Languages at home
- 87% English-only · Spanish 7% Tagalog/Filipino 1% Other Indo-European 1%
Political lean MEDSL · St. Joseph
- 2024 margin
- Toss-up / Even · D 50.0% · R 48.5% · Other 1.5%
- 2008→2024 swing
- -15.6pp toward R · 2008: 17.1pp · 2024: 1.5pp
- All cycles
- 2024: D+1.5 2020: D+5.8 2016: D+0.2 2012: D+3.5 2008: D+17.1
Not yet ingested
- Civics
- —
Market trends
- HPI YoY
- ▼ -124.82%
- Current HPI
- 242.1938
- Rent YoY
- ▲ 6.27%
- Metro
- South Bend-Mishawaka, IN-MI
- State GDP YoY
- ▲ 2.90%
- F500 in state
- 18
Industry mix (Fortune 500 HQ in IN)
| Industry | F500 HQs | Revenue |
|---|---|---|
| Industrial Machinery | 2 | $37B |
|
||
| Healthcare | 1 | $177B |
|
||
| Pharmaceuticals | 1 | $45B |
|
||
| Metals / Steel | 1 | $18B |
|
||
| Agriculture | 1 | $17B |
|
||
| Packaging | 1 | $12B |
|
||
Price history
+125.9% since first listed9 events — show timeline
- 2026-05-28 Listed $279,000 IRMLS
- 2023-07-07 Sold (MLS) $220,000 IRMLS
- 2023-06-19 Rental Removed — BUILDIUM
- 2023-06-15 Delisted — IRMLS
- 2023-06-15 Listed $220,000 IRMLS
- 2021-12-20 Sold (MLS) $150,000 IRMLS
- 2021-10-08 Listed $155,000 IRMLS
- 2019-06-14 Sold (MLS) $123,500 IRMLS
- 2019-05-10 Listed $123,500 IRMLS
Property tax history
+5.4%/yrLatest (2024): $2,015 · +8.9% YoY. Source: county tax records.
Cash-flow waterfall
monthlySold comps — $/sqft
last 12 mo · ≤1 miLoading sold comps…