96 Pelham Loop Rd · Danville, VA
Flood risk 1/10 · Minimal
- FEMA flood zone
- X (unshaded)
- Chance of flooding over 30 yrs
- 0.0%
- Est. flood insurance / yr
- $507 – $1,088
Fire risk 3/10 · Minor
- Est. fire insurance / yr
- $906 – $1,684
Heat risk 5/10 · Moderate
- Hot days now (above 106°F)
- 7 days/yr
- Hot days in 30 yrs
- 18 days/yr
Wind risk 4/10 · Minor
- Chance of severe wind over 30 yrs
- 9.0%
Air-quality risk 3/10 · Minor
- Unhealthy air days now
- 3 days/yr
- Unhealthy air days in 30 yrs
- 3 days/yr
Risk factors via First Street. Map © Google.
Why this score? — see what drove the C- grade
The composite is a weighted blend of 9 inputs, each scored 0–100. Each bar is that input's sub-score; the figure is the points it added to the 100-point composite (weight × sub-score).
- Cash flow +17.9/30.0
- ARV discount +7.5/15.0
- DSCR +5.6/10.0
- Appreciation +5.4/10.0
- Livability +3.9/5.0
- 1% rule +3.6/10.0
- Rent growth +2.5/5.0
- Schools +2.5/10.0
- Condition / age +2.5/5.0
$125,000
🖨 Deal sheet (PDF) 📄 Offer letter ✓ Due diligence
Listing remarks
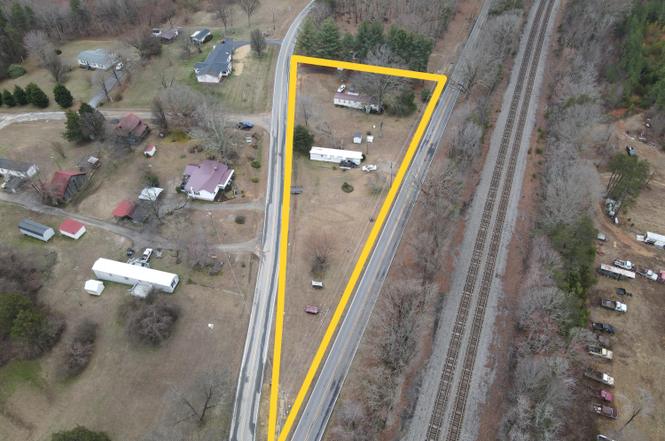
Investment opportunity is now available in Caswell County. Located less than 10 minutes from Danville, VA, this large lot has 2 mobile homes with long term renters to provide immediate and stable income for an investor. Both homes have been maintained over the years and still have good life left. Both homes have their own septic and well. Located in the fork of Pelham Loop Rd and Old US Hwy 29, this lot provides easy access to major highways along with shopping, dining and entertainment. Being the homes are currently occupied, please do not attempt to enter them. Call the listing agent for more information.
Key facts
- Large lot
- Own septic
- Own well
Tags
Property features AI
Finance
- Other: Directions: Take Hwy 86 north out of Yanceyville. Turn left on Shady Grove Rd. Turn left on Old US Hwy 29. Turn left on Pelham Loop Rd and property is in the fork of the road; County: Caswell; Postal code: 27311; Latitude/Longitude: 36.504974, -79.473186
- Financial info: Multi-family property with 2 total units; Tenants pay all utilities; Owner pays none of the utilities
- HOA & community: No association
Exterior
- Parking: Open parking; 4 open parking spaces; Driveway parking; On-site parking; Side-by-side layout
- Utilities: Well water; Septic tank sewer
- Home design: Manufactured house; One story; Two buildings on the property; Entry facing direction not specified
- Construction: Aluminum siding; Aluminum roof; Block foundation; Built area approximately 1,100 (living area)
- Exterior features: Deck; Private entrance; Storage; Approximately 0.82 acre lot; County road frontage on an asphalt, publicly maintained road
Interior
- Bedrooms: 4 bedrooms
- Flooring: Carpet; Linoleum
- Bathrooms: 2 full bathrooms; 2 half bathrooms
- Heating & cooling: Electric heating; Window unit cooling
- Interior features: Private entrance; Storage
Neighborhood map
What this means for you Summary
Snapshot
- This is a 4-bed/3.0-bath other listed at $125k.
Deal economics
- At list price, monthly cash flow is $105 ($1k/yr) — positive.
- The deal already cash-flows at list — no discount required.
- To meet the 1% rule (rent ≥ 1% of price), the offer needs to be $108k (13.7% below list).
- Recommended offer: $108k (13.7% below list) — sets the bar for 1% rule.
- Cap rate 7.3% vs local median 5.2% in Danville — top-decile yield for the area; either an underpriced asset or a hidden risk that comps aren't pricing in. Stress-test before assuming the spread holds.
Location & tenants
- Location reads 77/100 on livability (#91 in VA, #2,952 nationally) — a middle-class / working-renter tenant base. Strengths: cost of living A+, housing A+, health & safety A+; Watch: amenities D+, crime D-, commute F.
- Caswell County Schools (rural): math 24% / reading 37% proficiency, ranked #146 of 178 in NC (top 82%) — families likely to look elsewhere, expect single-tenant / working-renter base with shorter leases; 61% free/reduced lunch — lower-income household profile, screen leases tightly.
- Zoned schools: North Elementary (math 32% / reading 47%, grade F, #694 of 1,410 statewide, top 53%, 343 students, 99% FRL); N L Dillard Middle (math 21% / reading 35%, grade F, #360 of 475 statewide, top 77%, 500 students, 71% FRL); Bartlett Yancey High (math 32% / reading 47%, grade F, #393 of 535 statewide, top 75%, 679 students, 64% FRL) — zoned schools average 78% FRL vs 61% district-wide (17 pts higher); higher-poverty schools than district average — tighter screening recommended.
- Market conditions: 1 active listings in the ZIP; 54 units permitted in Caswell County in 2024 (0 in 5+ unit buildings).
Forward outlook
- In year one you build about $2k of equity ($864 loan paydown + $1k appreciation (0.8% local appreciation)).
- Caswell County population projected at -27% by 2050 — secular population decline; favor cash flow + early exit over multi-decade hold.
- At projected returns (0.8% appreciation + 3.0% rent growth), your $35k cash investment doubles in ~8 years — after that, you're playing with house money.
Negotiation context
- It's been on market 108 days — a 9% lower offer ($114k) is reasonable based on typical stale-listing flexibility.
Risks & watch-outs
- Climate carrying-cost: extreme-heat days projected 7→18/yr by 2055 (HVAC capex compounding) — expect insurance premiums to compound above CPI over the hold.
Questions for the listing agent
- It's been on market 108 days. Have you received any prior offers? Is the seller open to a 14% concession, seller financing, or rate buy-down credit?
- Built in 1973 — when were the roof, HVAC, electrical panel, plumbing, and water heater last replaced?
- Why hasn't it sold? Are there any deal-killer items the seller is aware of (foundation, flood, title, zoning, code violations)?
- Is there a deadline driving the sale (1031 exchange, divorce, estate, relocation)? That informs how much negotiation room exists.
- Schools are B-rated — typically a magnet for longer-tenancy family renters. What's the average tenant stay here, and is there a school-zone premium baked into asking?
- Crime grade is D in this area — have there been break-ins, vandalism, or insurance claims at this property in the last 3 years? What carrier currently insures it and at what premium?
- What's the average days-on-market for RENTAL listings here right now (not sales)? A rising rental-DOM trend means longer vacancies and softer asking-rent achievability than the comps imply.
- What's the recent tenant-quality profile in this submarket — average credit score on applications, eviction rate, late-payment / NSF rate, and stable-employment percentage? A property-management company in the area should have these aggregated.
- How much new for-sale + rental construction is in the pipeline within 1–3 miles? Heavy new supply typically softens prices + rents 12–24 months out; constrained supply supports both.
Investment metrics
- 1% rule
- 0.86% ✗
- Cap rate
- 7.30%
- Cash-on-cash
- 3.60%
- DSCR
- 1.16
- GRM
- 9.7
CMA / ARV
No comps found within radius.
Projected returns pro-forma
0.81% appreciation · 3.0% rent growth · sell at horizon
- IRR
- 4.5%
- Equity multiple
- 1.22×
- Total profit
- $7,797
- Equity at exit
- $41,428
- IRR
- 8.9%
- Equity multiple
- 2.06×
- Total profit
- $37,217
- Equity at exit
- $54,104
Cash invested: $35,000 (down + closing). Projections, not guarantees.
Landlord ↔ Tenant lean methodology
- Overall (STATE)
- 55 Moderately Landlord-Leaning
- State Virginia
- 55 Moderately Landlord-Leaning · D+2
- County
- — inherits STATE
- City
- — inherits STATE
ZIP-level market 27311
- Home prices YoY
- 0.4%
- Active inventory
- 1
- Price-to-rent
- 9.7×
Monthly cashflow live
- Estimated rent
- $1,078 medium interval (Pro) →
- Mortgage (P&I)
- −$656
- Tax from tax record
- −$39 /mo · $471/yr
- Insurance
- −$52
- HOA
- −$0
- Vacancy / Maint / Mgmt
- −$226
- Net cashflow
- $105
Break-even live
Sensitivity live
| Price | -10% $176 | -5% $140 | +0% $105 | +5% $70 | +10% $34 |
|---|---|---|---|---|---|
| Rent | -10% $20 | -5% $62 | +0% $105 | +5% $148 | +10% $190 |
| Rate | -1.0pp $168 | -0.5pp $137 | base $105 | +0.5pp $73 | +1.0pp $40 |
UW: 25.0% down · 7.5% · 30yr · 1.5% tax · 5.0% vac · 8.0% maint · 8.0% mgmt
Financing live
Cash to close
- Down payment
- $31,250
- Closing costs
- $3,750
- Reserves months
- —
- Total cash needed
- —
Loan-product check · same deal, 3 products live
Conventional
25% down · 7.5% · 30yr
- Down + closing
- —
- Monthly P&I
- —
- Monthly cashflow
- —
- DSCR
- —
- Eligible?
- —
Personal DTI + credit; lowest rate.
DSCR
20% down · 8.5% · 30yr
- Down + closing
- —
- Monthly P&I
- —
- Monthly cashflow
- —
- DSCR
- —
- Eligible?
- —
No personal income docs; deal must DSCR.
Hard money
10% down · 12.0% · 12mo
- Down + closing
- —
- Monthly P&I
- —
- Monthly cashflow
- —
- DSCR
- —
- Eligible?
- —
Short-term bridge; refi at stabilization.
Listing history 18 events
-
2026-06-21days on market $125,000 Active 108 DOM
-
2026-06-19days on market $125,000 Active 106 DOM
-
2026-06-18days on market $125,000 Active 105 DOM
-
2026-06-17days on market $125,000 Active 104 DOM
-
2026-06-16days on market $125,000 Active 103 DOM
-
2026-06-15days on market $125,000 Active 102 DOM
-
2026-06-14days on market $125,000 Active 100 DOM
-
2026-06-13days on market $125,000 Active 99 DOM
-
2026-06-10days on market $125,000 Active 97 DOM
-
2026-06-09days on market $125,000 Active 96 DOM
-
2026-06-08days on market $125,000 Active 95 DOM
-
2026-06-07days on market $125,000 Active 94 DOM
-
2026-06-03days on market $125,000 Active 90 DOM
-
2026-06-02days on market $125,000 Active 89 DOM
-
2026-06-01days on market $125,000 Active 88 DOM
-
2026-05-31days on market $125,000 Active 87 DOM
-
2026-05-30days on market $125,000 Active 86 DOM
-
2026-03-04$125,000 Active
ⓘ Source: listings_history table (triggers on properties + properties_extension) + one-shot
backfill from property_details.listing_events for pre-trigger history.
Tax reassessment forecast VA · Resets to sale price
- Current annual tax
- $471 · $39/mo
- Projected year-2 tax
- $1,025 · $85/mo
- Expected delta
- +$554/yr (+$46/mo · 117.8%)
ⓘ Screening estimate from a state-policy table — verify with the county assessor before closing.
Climate risk First Street
- Flood 1/10 Low FEMA zone X (unshaded) · 0% chance over 30 yrs
- Wildfire 3/10 Moderate
- Heat 5/10 Major 7 d/yr ≥106°F today · 18 d/yr by 30 yrs out
- Wind 4/10 Moderate 9% chance of damaging wind over 30 yrs
- Air quality 3/10 Moderate 3 unhealthy d/yr today · 3 by 30 yrs out
Nearby sold comps map
Loading sold comps map…
Walkable amenities ~0.75 mi
Loading nearby amenities…
Taxation est. · year 1
- Rental income
- $12,939
- − Mortgage interest
- −$7,002
- − Property taxes
- −$471
- − Insurance
- −$625
- − Repairs & maintenance
- −$1,035
- − Management
- −$1,035
- − Depreciation
- −$3,636
- Taxable loss
- −$866
- Est. tax savings @ 24.0%
- +$208
- After-tax cash flow
- $1,467/yr
For passive investors: Depreciation is non-cash, so a rental often shows a tax loss while cash-flowing — sheltering income. Rental losses are passive: they offset passive income freely, and up to $25,000/yr can offset ordinary (W-2) income if you actively participate and your MAGI is under $100k (phasing out to $0 by $150k); unused losses carry forward. On sale, claimed depreciation is recaptured at up to 25%, and gains may owe capital-gains tax (a 1031 exchange can defer both). Figures are a year-1 estimate at your 24.0% rate — not tax advice; consult a CPA.
Schools (NCES district)
- District
- Caswell County Schools
- NCES district ID
- 3700660
- Math proficiency
- 24% ▼ -2.00%
- Reading proficiency
- 37% ▲ 3.00%
- Median HH income
- $38,172
- Composite
- 25.44/100
- National rank
- #7452
- State rank
- #146 of 178 in NC
Livability — Danville
- Score
- 77/100
- State rank
- #91
- US rank
- #2952
Category grades
Schools grade is shown separately in the Schools card above.
Census & demographics
- City population
- 59,055
- Population (ZIP)
- 3,656
Population outlook (Caswell County) Hauer SSP2
- Today (2025)
- 21,389 people
- By 2030
- 20,297 · -5.1%
- By 2040
- 17,848 · -16.6%
- By 2050
- 15,578 · -27.2%
- By 2075
- 11,939 · -44.2%
- By 2100
- 8,930 · -58.2%
Race, ethnicity, and origin ACS 2023
- Neighborhood character
- Diverse neighborhood (Simpson 0.58)
- Race & ethnicity
- White 59% Black 23% Hispanic / Latino 15% Two or more races 14%
- Hispanic origin (detail)
- Mexican 10%
- Common ancestry
- Italian 9% Lithuanian 2% Romanian 1%
- Foreign-born
- 8% · Canada, United Kingdom
- Languages at home
- 85% English-only · Spanish 14% French/Haitian/Cajun 1%
Political lean MEDSL · Caswell
- 2024 margin
- Strong R (+24.6) · D 37.4% · R 61.9%
- 2008→2024 swing
- -27.7pp toward R · 2008: 3.1pp · 2024: -24.6pp
- All cycles
- 2024: R+24.6 2020: R+18.5 2016: R+11.5 2012: R+2.7 2008: D+3.1
Not yet ingested
- Civics
- —
Market trends
- HPI YoY
- ▲ 0.81%
- Current HPI
- 209.3845
- Rent YoY
- —
- Metro
- —
- State GDP YoY
- ▲ 2.40%
- F500 in state
- 50
Industry mix (Fortune 500 HQ in VA)
| Industry | F500 HQs | Revenue |
|---|---|---|
| Aerospace / Defense | 4 | $236B |
|
||
| Technology / Defense | 3 | $32B |
|
||
| Financial Services | 2 | $176B |
|
||
| Utilities | 2 | $27B |
|
||
| Insurance | 2 | $25B |
|
||
| Technology | 2 | $15B |
|
||
Price history
1 event — show timeline
- 2026-03-04 Listed $125,000 TMLS
Property tax history
+4.1%/yrLatest (2025): $471 · +5.2% YoY. Source: county tax records.
Cash-flow waterfall
monthlySold comps — $/sqft
last 12 mo · ≤1 miLoading sold comps…