 Duplex
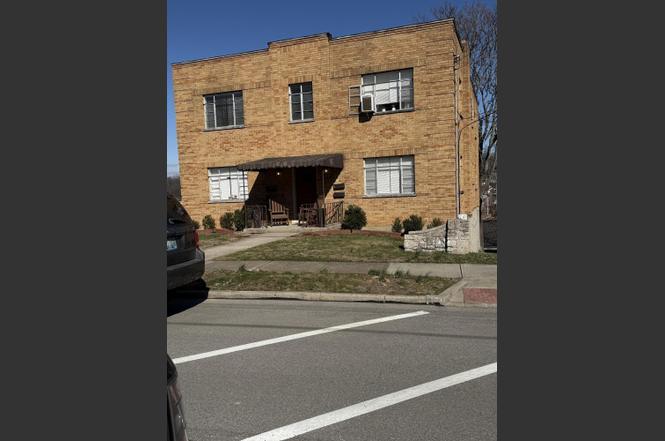
224 Ridgeway Ave · Southgate, KY
Flood risk No data
- FEMA flood zone
- —
- Chance of flooding over 30 yrs
- —
- Est. flood insurance / yr
- —
Fire risk No data
- Est. fire insurance / yr
- —
Heat risk No data
- Hot days now (above threshold)
- —
- Hot days in 30 yrs
- —
Wind risk No data
- Chance of severe wind over 30 yrs
- —
Air-quality risk No data
- Unhealthy air days now
- —
- Unhealthy air days in 30 yrs
- —
Risk factors via First Street. Map © Google.
Why this score? — see what drove the C grade
The composite is a weighted blend of 9 inputs, each scored 0–100. Each bar is that input's sub-score; the figure is the points it added to the 100-point composite (weight × sub-score).
- Cash flow +22.1/30.0
- ARV discount +7.5/15.0
- DSCR +7.1/10.0
- 1% rule +4.5/10.0
- Livability +4.2/5.0
- Schools +4.1/10.0
- Rent growth +3.7/5.0
- Condition / age +2.5/5.0
- Appreciation +0.0/10.0
$474,000
🖨 Deal sheet (PDF) 📄 Offer letter ✓ Due diligence
Multi-family units
County records classify this as Multi-Family (5+ Unit). Listing-text estimate: 2 units. estimate disagrees with records
5+ unit building — per-unit beds/baths from public records are typically unavailable; the breakdown below (if shown) is an estimate from the listing text.
Listing remarks
Owner Financing Possible. Most furnaces and appliances have been updated in the last couple years. 3 of 4 units painted. Building has one vacant unit,
Key facts
- 5,401 sq ft lot
- 3 garage spots
- Built 1953
Property features AI
Exterior
- Parking: Garage; Garage faces side; Off-street parking; 3-car garage
- Utilities: Public water; Public sewer; Cable available
- Home design: Quadruplex (multi-family); Two levels; Built in 1953
- Construction: Brick construction; Membrane roof; Block and poured concrete foundation
- Exterior features: Front porch; Has a view; Lot approximately 0.12 acres (68 x 83)
Interior
- Kitchen: Gas range; Gas oven; Refrigerator
- Bathrooms: 4 full bathrooms
- Heating & cooling: Forced air heating; Individual heating controls; Window-unit cooling
- Interior features: Eat-in kitchen; Full basement
- Laundry & utility: Laundry in basement
Neighborhood map
What this means for you Summary
Snapshot
- This is a 2 × 3-bed/2.0-bath units multifamily listed at $474k.
Deal economics
- At list price, monthly cash flow is $761 ($9k/yr) — positive. Per door: $381/mo.
- The deal already cash-flows at list — no discount required.
- To meet the 1% rule (rent ≥ 1% of price), the offer needs to be $448k (5.4% below list).
- Recommended offer: $431k (9.0% below list) — sets the bar for market timing.
- Cap rate 8.2% vs local median 4.1% in Southgate — top-decile yield for the area; either an underpriced asset or a hidden risk that comps aren't pricing in. Stress-test before assuming the spread holds.
Location & tenants
- Location reads 85/100 on livability (#45 in KY, #513 nationally) — a professional / high-income tenant draw. Strengths: crime A+, commute A+, cost of living A+; Watch: amenities F.
- Southgate Independent (suburban): math 35% / reading 55% proficiency, ranked #119 of 173 in KY (top 69%) — families likely to look elsewhere, expect single-tenant / working-renter base with shorter leases; 60% free/reduced lunch — lower-income household profile, screen leases tightly.
- Zoned schools: Southgate Public School (math 12% / reading 32%, grade F, #525 of 676 statewide, top 82%, 207 students, 87% FRL) — zoned schools average 87% FRL vs 60% district-wide (27 pts higher); higher-poverty schools than district average — tighter screening recommended.
- Zoned-school proficiency averages 22% at this address vs 45% district-wide (-23 pts) — the specific schools serving this property underperform the Southgate Independent average; the district grade overstates school quality for this exact location.
- Market conditions: Rents rising fast (+4.6%/yr); 239 active listings in the ZIP; 1 comparable units currently listed for rent nearby; 247 units permitted in Campbell County in 2024 (77 in 5+ unit buildings).
- At $4,483/mo this rent would consume 90% of the median local household income ($60k/yr) (locally 1136% of renters already pay >50% of income on rent) — very limited rent-growth headroom before tenants either downsize or default.
Forward outlook
- Local home prices are declining (-3.0%/yr); year-one equity from $3k of loan paydown is wiped out by about $14k of value loss. Plan a longer hold.
Negotiation context
- It's been on market 100 days — a 9% lower offer ($431k) is reasonable based on typical stale-listing flexibility.
- 8 sale attempts since 22y ago with the ask held roughly flat each time — persistent listings suggest the price (not the market) is what's stuck; bring a comps-based counter.
- Current owner paid $214k; list at $474k implies a 121% gain — meaningful room to come down on a strong offer.
Risks & watch-outs
- Watch-outs: built in 1953 — expect roof / HVAC / electrical / plumbing capex.
Questions for the listing agent
- It's been on market 100 days. Have you received any prior offers? Is the seller open to a 9% concession, seller financing, or rate buy-down credit?
- Can we see the unit-by-unit rent roll, current vacancy, and any below-market leases? What's the average tenancy length?
- What capital expenditures (roof, boiler, parking lot, exteriors) have been made in the last 5 years, and what's planned in the next 2?
- Built in 1953 — when were the roof, HVAC, electrical panel, plumbing, and water heater last replaced?
- Why hasn't it sold? Are there any deal-killer items the seller is aware of (foundation, flood, title, zoning, code violations)?
- Is there a deadline driving the sale (1031 exchange, divorce, estate, relocation)? That informs how much negotiation room exists.
- What's the average days-on-market for RENTAL listings here right now (not sales)? A rising rental-DOM trend means longer vacancies and softer asking-rent achievability than the comps imply.
- What's the recent tenant-quality profile in this submarket — average credit score on applications, eviction rate, late-payment / NSF rate, and stable-employment percentage? A property-management company in the area should have these aggregated.
- How much new apartment / multifamily construction is in the pipeline within 1–3 miles? Heavy new supply (>2% of stock underway) typically softens rents 12–24 months out; light construction supports rent growth.
Investment metrics
- 1% rule
- 0.95% ✗
- Cap rate
- 8.22%
- Cash-on-cash
- 6.88%
- DSCR
- 1.31
- GRM
- 8.8
CMA / ARV
No comps found within radius.
Projected returns pro-forma
-3.0% appreciation · 4.64% rent growth · sell at horizon
- IRR
- -4.2%
- Equity multiple
- 0.84×
- Total profit
- $-21,030
- Equity at exit
- $70,675
- IRR
- 7.1%
- Equity multiple
- 1.57×
- Total profit
- $75,074
- Equity at exit
- $40,983
Cash invested: $132,720 (down + closing). Projections, not guarantees.
Landlord ↔ Tenant lean methodology
- Overall (STATE)
- 83 Strongly Landlord-Friendly
- State Kentucky
- 83 Strongly Landlord-Friendly · R+16
- County
- — inherits STATE
- City
- — inherits STATE
ZIP-level market 41071
- Rents YoY
- 4.6%
- Active inventory
- 239
- Price-to-rent
- 17.6×
Monthly cashflow live
- Estimated rent
- $4,483 high interval (Pro) →
- Mortgage (P&I)
- −$2,486
- Tax from tax record
- −$97 /mo · $1,163/yr
- Insurance
- −$198
- HOA
- −$0
- Vacancy / Maint / Mgmt
- −$941
- Net cashflow
- $761
Break-even live
Sensitivity live
| Price | -10% $1,030 | -5% $896 | +0% $761 | +5% $627 | +10% $493 |
|---|---|---|---|---|---|
| Rent | -10% $407 | -5% $584 | +0% $761 | +5% $939 | +10% $1,116 |
| Rate | -1.0pp $1,000 | -0.5pp $882 | base $761 | +0.5pp $639 | +1.0pp $514 |
2-unit breakdown (identical units grouped — click to expand)
| Units | Beds | Baths | Est. rent |
|---|---|---|---|
| 2× units | 3 | 2 | $4,484 |
| #1 | 3 | 2 | $2,242 |
| #2 | 3 | 2 | $2,242 |
| Total (2 units) | $4,483 | ||
UW: 25.0% down · 7.5% · 30yr · 1.5% tax · 5.0% vac · 8.0% maint · 8.0% mgmt
Financing live
Cash to close
- Down payment
- $118,500
- Closing costs
- $14,220
- Reserves months
- —
- Total cash needed
- —
Loan-product check · same deal, 3 products live
Conventional
25% down · 7.5% · 30yr
- Down + closing
- —
- Monthly P&I
- —
- Monthly cashflow
- —
- DSCR
- —
- Eligible?
- —
Personal DTI + credit; lowest rate.
DSCR
20% down · 8.5% · 30yr
- Down + closing
- —
- Monthly P&I
- —
- Monthly cashflow
- —
- DSCR
- —
- Eligible?
- —
No personal income docs; deal must DSCR.
Hard money
10% down · 12.0% · 12mo
- Down + closing
- —
- Monthly P&I
- —
- Monthly cashflow
- —
- DSCR
- —
- Eligible?
- —
Short-term bridge; refi at stabilization.
Rent comps 1 comps
| Address | Beds | Baths | Sqft | Rent | $/sqft | DOM | Units | Dist |
|---|---|---|---|---|---|---|---|---|
| 835 York St #1 Newport, KY | 5.0 | 2.0 | 2700 | $2,395 | $0.89 | 45d | 1 | 1.43mi |
Listing history 29 events
-
2026-06-21days on market $474,000 Active 100 DOM
-
2026-06-18days on market $474,000 Active 97 DOM
-
2026-06-17days on market $474,000 Active 96 DOM
-
2026-06-16days on market $474,000 Active 95 DOM
-
2026-06-15days on market $474,000 Active 94 DOM
-
2026-06-13days on market $474,000 Active 92 DOM
-
2026-06-13pricedays on market $474,000 Active 91 DOM
-
2026-06-09days on market $495,000 Active 88 DOM
-
2026-06-08days on market $495,000 Active 87 DOM
-
2026-06-07days on market $495,000 Active 86 DOM
-
2026-06-03days on market $495,000 Active 82 DOM
-
2026-06-02days on market $495,000 Active 81 DOM
-
2026-06-01days on market $495,000 Active 80 DOM
-
2026-05-31days on market $495,000 Active 79 DOM
-
2026-05-25status Active
-
2026-05-05status Pending
-
2026-02-20$495,000 Active
-
2018-12-31historical
-
2018-01-01$339,000
-
2016-11-30historical
-
2016-07-11$299,900
-
2011-08-15historical
-
2011-02-15$235,000
-
2007-09-26historical
-
2007-03-26$239,900
-
2007-03-26historical
-
2006-09-26$239,900
-
2005-06-10soldstatus $214,000
-
2004-10-26$227,000
ⓘ Source: listings_history table (triggers on properties + properties_extension) + one-shot
backfill from property_details.listing_events for pre-trigger history.
Tax reassessment forecast KY · Resets to sale price
- Current annual tax
- $1,163 · $97/mo
- Projected year-2 tax
- $4,076 · $340/mo
- Expected delta
- +$2,913/yr (+$243/mo · 250.5%)
ⓘ Screening estimate from a state-policy table — verify with the county assessor before closing.
Nearby sold comps map
Loading sold comps map…
Walkable amenities ~0.75 mi
Loading nearby amenities…
Taxation est. · year 1
- Rental income
- $53,796
- − Mortgage interest
- −$26,551
- − Property taxes
- −$1,163
- − Insurance
- −$2,370
- − Repairs & maintenance
- −$4,304
- − Management
- −$4,304
- − Depreciation
- −$13,789
- Taxable income
- $1,315
- Est. tax owed @ 24.0%
- −$316
- After-tax cash flow
- $8,822/yr
For passive investors: Depreciation is non-cash, so a rental often shows a tax loss while cash-flowing — sheltering income. Rental losses are passive: they offset passive income freely, and up to $25,000/yr can offset ordinary (W-2) income if you actively participate and your MAGI is under $100k (phasing out to $0 by $150k); unused losses carry forward. On sale, claimed depreciation is recaptured at up to 25%, and gains may owe capital-gains tax (a 1031 exchange can defer both). Figures are a year-1 estimate at your 24.0% rate — not tax advice; consult a CPA.
Schools (NCES district)
- District
- Southgate Independent
- NCES district ID
- 2105460
- Math proficiency
- 35% ▼ -5.00%
- Reading proficiency
- 55% ▲ 5.00%
- Median HH income
- $49,230
- Composite
- 40.75/100
- National rank
- #7579
- State rank
- #119 of 173 in KY
Livability — Southgate
- Score
- 85/100
- State rank
- #45
- US rank
- #513
Category grades
Schools grade is shown separately in the Schools card above.
Census & demographics
- Census place
- Southgate, KY
- County
- Campbell County · 84,793 people
- Metro
- Cincinnati, OH-KY-IN
- Population (ZIP)
- 19,680
- Household income
- $59,976
- Rent vs Own
- Severe rent burden
- 1136.0
Population outlook (Campbell County) Hauer SSP2
- Today (2025)
- 95,668 people
- By 2030
- 96,886 · +1.3%
- By 2040
- 97,734 · +2.2%
- By 2050
- 96,413 · +0.8%
- By 2075
- 90,211 · -5.7%
- By 2100
- 79,434 · -17.0%
Race, ethnicity, and origin ACS 2023
- Neighborhood character
- Predominantly White (84%)
- Race & ethnicity
- White 84% Black 7% Two or more races 6% Hispanic / Latino 5%
- Common ancestry
- Slovak 3% Lithuanian 2% Italian 2%
- Foreign-born
- 4% · Canada
- Languages at home
- 95% English-only · Spanish 3% Other Indo-European 1%
Political lean MEDSL · Campbell
- 2024 margin
- R (+19.7) · D 39.2% · R 58.9% · Other 1.9%
- 2008→2024 swing
- +1.2pp toward D · 2008: -20.9pp · 2024: -19.7pp
- All cycles
- 2024: R+19.7 2020: R+18.6 2016: R+24.5 2012: R+22.8 2008: R+20.9
Not yet ingested
- Civics
- —
Market trends
- HPI YoY
- ▼ -193.38%
- Current HPI
- 244.9069
- Rent YoY
- ▲ 4.64%
- Metro
- Cincinnati, OH-KY-IN
- State GDP YoY
- ▲ 1.81%
- F500 in state
- 4
Industry mix (Fortune 500 HQ in KY)
| Industry | F500 HQs | Revenue |
|---|---|---|
| Healthcare | 1 | $118B |
|
||
| Food / Beverage | 1 | $7B |
|
||
Price history
+118.1% since first listed15 events — show timeline
- 2026-05-25 Relisted — NKMLS
- 2026-05-05 Pending — NKMLS
- 2026-02-20 Listed $495,000 NKMLS
- 2018-12-31 Listing Removed — NKMLS
- 2018-01-01 Listed $339,000 NKMLS
- 2016-11-30 Listing Removed — NKMLS
- 2016-07-11 Listed $299,900 NKMLS
- 2011-08-15 Listing Removed — NKMLS
- 2011-02-15 Listed $235,000 NKMLS
- 2007-09-26 Listing Removed — NKMLS
- 2007-03-26 Listing Removed — NKMLS
- 2007-03-26 Listed $239,900 NKMLS
- 2006-09-26 Listed $239,900 NKMLS
- 2005-06-10 Sold (MLS) $214,000 NKMLS
- 2004-10-26 Listed $227,000 NKMLS
Property tax history
+0.5%/yrLatest (2025): $1,163 · -3.2% YoY. Source: county tax records.
Cash-flow waterfall
monthlySold comps — $/sqft
last 12 mo · ≤1 miLoading sold comps…