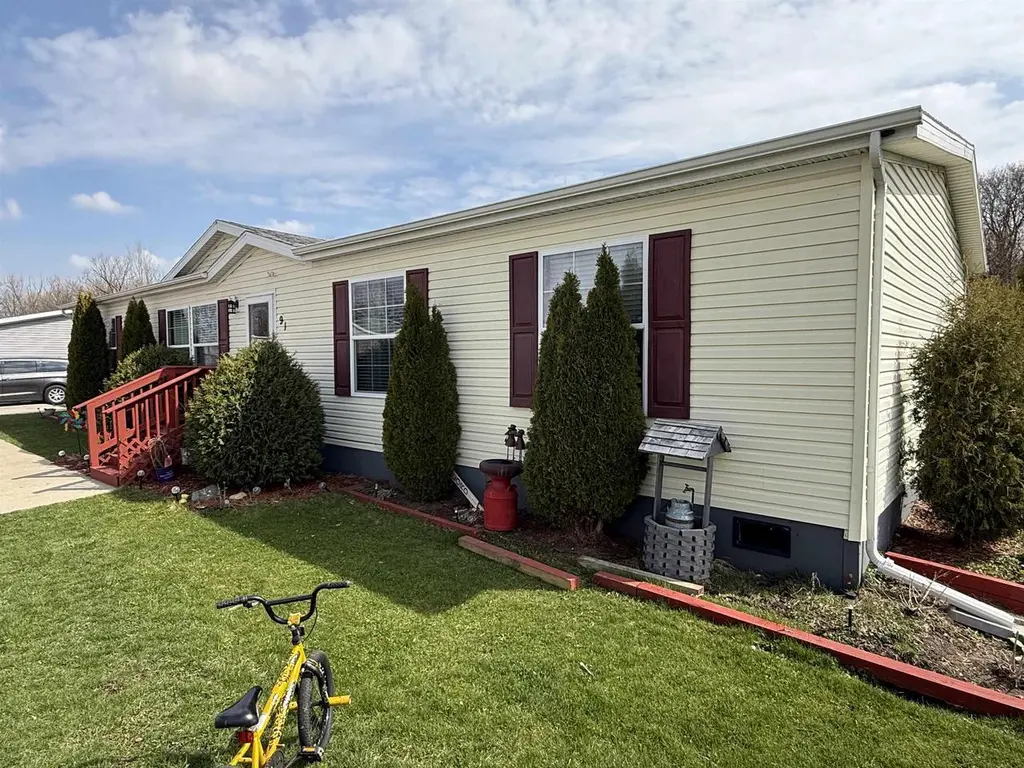
897 E Lake St #91 · Lake Mills, WI
Flood risk 1/10 · Minimal
- FEMA flood zone
- X (unshaded)
- Chance of flooding over 30 yrs
- 0.0%
- Est. flood insurance / yr
- $473 – $860
Fire risk 2/10 · Minimal
- Est. fire insurance / yr
- $636 – $1,182
Heat risk 2/10 · Minimal
- Hot days now (above 102°F)
- 7 days/yr
- Hot days in 30 yrs
- 13 days/yr
Wind risk 2/10 · Minimal
- Chance of severe wind over 30 yrs
- —
Air-quality risk 2/10 · Minimal
- Unhealthy air days now
- 1 days/yr
- Unhealthy air days in 30 yrs
- 1 days/yr
Risk factors via First Street. Map © Google.
Why this score? — see what drove the C grade
The composite is a weighted blend of 9 inputs, each scored 0–100. Each bar is that input's sub-score; the figure is the points it added to the 100-point composite (weight × sub-score).
- Cash flow +23.2/30.0
- ARV discount +7.5/15.0
- DSCR +7.4/10.0
- 1% rule +6.0/10.0
- Livability +4.0/5.0
- Schools +3.4/10.0
- Condition / age +2.8/5.0
- Rent growth +2.5/5.0
- Appreciation +0.0/10.0
$145,000
🖨 Deal sheet (PDF) 📄 Offer letter ✓ Due diligence
Listing remarks MLS
Well-maintained 4 bed, 2 bath manufactured home with a spacious layout, large kitchen, and open concept! Perfect for everyday living and entertaining. Enjoy the added bonus of a beautiful deck! Convenient location close to town amenities. Must see today! Monthly lot rent is $681; taxes and trash are included.
Key facts
- Beautiful deck
- Large kitchen
- Convenient location
Tags
Neighborhood map
What this means for you Summary
Snapshot
- This is a 4-bed/2.0-bath single-family listed at $145k. Condition is rated average.
Deal economics
- At list price, monthly cash flow is $262 ($3k/yr) — positive.
- The deal already cash-flows at list — no discount required.
- Meets the 1% rule at list price ($2k rent vs $145k).
- Recommended offer: $136k (6.0% below list) — sets the bar for market timing.
- Cap rate 8.5% vs local median 1.9% in Lake Mills — top-decile yield for the area; either an underpriced asset or a hidden risk that comps aren't pricing in. Stress-test before assuming the spread holds.
Location & tenants
- Location reads 80/100 on livability (#68 in WI, #1,833 nationally) — a professional / high-income tenant draw. Strengths: crime A+, cost of living A+, housing A+; Watch: amenities F, commute F.
- Lake Mills Area School District (town): math 38% / reading 39% proficiency, ranked #152 of 342 in WI (top 44%) — families likely to look elsewhere, expect single-tenant / working-renter base with shorter leases.
- Zoned schools: Lake Mills Elementary (math 42% / reading 42%, grade F, #433 of 1,041 statewide, top 46%, 610 students, 22% FRL); Lake Mills Middle (math 35% / reading 39%, grade F, #175 of 383 statewide, top 48%, 410 students, 30% FRL); Lake Mills High (math 37% / reading 32%, grade F, #144 of 483 statewide, top 36%, 488 students, 30% FRL).
- Market conditions: 34 active listings in the ZIP; 1 comparable units currently listed for rent nearby; 145 units permitted in Jefferson County in 2024 (0 in 5+ unit buildings).
Forward outlook
- Local home prices are declining (-3.0%/yr); year-one equity from $1k of loan paydown is wiped out by about $4k of value loss. Plan a longer hold.
- Jefferson County population projected to shrink 6% by 2050 — rents likely to lag national; underwrite the cash flow, not the appreciation.
Negotiation context
- It's been on market 66 days — a 6% lower offer ($136k) is reasonable based on typical stale-listing flexibility.
Questions for the listing agent
- It's been on market 66 days. Have you received any prior offers? Is the seller open to a 6% concession, seller financing, or rate buy-down credit?
- Why hasn't it sold? Are there any deal-killer items the seller is aware of (foundation, flood, title, zoning, code violations)?
- Is there a deadline driving the sale (1031 exchange, divorce, estate, relocation)? That informs how much negotiation room exists.
- What's the average days-on-market for RENTAL listings here right now (not sales)? A rising rental-DOM trend means longer vacancies and softer asking-rent achievability than the comps imply.
- What's the recent tenant-quality profile in this submarket — average credit score on applications, eviction rate, late-payment / NSF rate, and stable-employment percentage? A property-management company in the area should have these aggregated.
- How much new for-sale + rental construction is in the pipeline within 1–3 miles? Heavy new supply typically softens prices + rents 12–24 months out; constrained supply supports both.
Investment metrics
- 1% rule
- 1.10% ✓
- Cap rate
- 8.46%
- Cash-on-cash
- 7.74%
- DSCR
- 1.34
- GRM
- 7.6
CMA / ARV
- ARV (median comp)
- $407,874
- List price
- $145,000
- Delta
- -64.45%
- Verdict
- UNDERPRICED
- Comps
- 20 within 1.0 mi
Show comp detail 12 sales within ~0.75 mi
| Address | Dist | Beds/Ba | Sqft | Sold | Price | $/sf | Match |
|---|---|---|---|---|---|---|---|
| 1019 High St | 0.30mi | 3/2.5 (-1) | 1,912 (+0%) | 2mo | $410,000 | $214 | 77 |
| 408 Oneil St | 0.45mi | 4/2.0 | 1,824 (-4%) | 2mo | $339,000 | $186 | 70 |
| 1010 Badger Dr | 0.31mi | 4/2.5 | 2,060 (+8%) | 6mo | $445,000 | $216 | 65 |
| 933 Mulberry St | 0.65mi | 3/2.0 (-1) | 1,835 (-4%) | 1mo | $376,000 | $205 | 58 |
| 310 E Washington St | 0.66mi | 3/2.5 (-1) | 1,880 (-1%) | 6mo | $411,700 | $219 | 55 |
| 394 Grove St | 0.54mi | 3/1.5 (-1) | 1,758 (-8%) | 1mo | $402,000 | $229 | 54 |
| 507 Water St | 0.53mi | 4/1.5 | 1,750 (-8%) | 10mo | $346,000 | $198 | 51 |
| 213 S Washington St | 0.57mi | 3/1.5 (-1) | 1,950 (+2%) | 14mo | $365,000 | $187 | 51 |
| 1048 High St | 0.37mi | 3/2.0 (-1) | 1,647 (-14%) | 9mo | $475,000 | $288 | 48 |
| 311 Fargo St | 0.58mi | 3/2.0 (-1) | 2,054 (+8%) | 11mo | $250,000 | $122 | 46 |
| 423 Fargo St | 0.48mi | 3/1.5 (-1) | 2,186 (+15%) | 7mo | $360,000 | $165 | 40 |
| 321 Water St | 0.74mi | 3/1.5 (-1) | 1,672 (-12%) | 1mo | $350,000 | $209 | 37 |
Match score weights: distance 35% · size 25% · config 20% · recency 20%. Top-matched comps best support the ARV.
Projected returns pro-forma
-3.0% appreciation · 3.0% rent growth · sell at horizon
- IRR
- -4.5%
- Equity multiple
- 0.83×
- Total profit
- $-6,789
- Equity at exit
- $21,620
- IRR
- 5.2%
- Equity multiple
- 1.39×
- Total profit
- $15,668
- Equity at exit
- $12,537
Cash invested: $40,600 (down + closing). Projections, not guarantees.
Landlord ↔ Tenant lean methodology
- Overall (STATE)
- 73 Landlord-Friendly
- State Wisconsin
- 73 Landlord-Friendly · R+2
- County
- — inherits STATE
- City
- — inherits STATE
ZIP-level market 53551
- Active inventory
- 34
- Price-to-rent
- 7.6×
Monthly cashflow live
- Estimated rent
- $1,600 medium interval (Pro) →
- Mortgage (P&I)
- −$760
- Tax est. 1.5%
- −$181 /mo · $2,175/yr
- Insurance
- −$60
- HOA
- −$0
- Vacancy / Maint / Mgmt
- −$336
- Net cashflow
- $262
Break-even live
Sensitivity live
| Price | -10% $362 | -5% $312 | +0% $262 | +5% $212 | +10% $162 |
|---|---|---|---|---|---|
| Rent | -10% $136 | -5% $199 | +0% $262 | +5% $325 | +10% $388 |
| Rate | -1.0pp $335 | -0.5pp $299 | base $262 | +0.5pp $224 | +1.0pp $186 |
UW: 25.0% down · 7.5% · 30yr · 1.5% tax · 5.0% vac · 8.0% maint · 8.0% mgmt
Financing live
Cash to close
- Down payment
- $36,250
- Closing costs
- $4,350
- Reserves months
- —
- Total cash needed
- —
Loan-product check · same deal, 3 products live
Conventional
25% down · 7.5% · 30yr
- Down + closing
- —
- Monthly P&I
- —
- Monthly cashflow
- —
- DSCR
- —
- Eligible?
- —
Personal DTI + credit; lowest rate.
DSCR
20% down · 8.5% · 30yr
- Down + closing
- —
- Monthly P&I
- —
- Monthly cashflow
- —
- DSCR
- —
- Eligible?
- —
No personal income docs; deal must DSCR.
Hard money
10% down · 12.0% · 12mo
- Down + closing
- —
- Monthly P&I
- —
- Monthly cashflow
- —
- DSCR
- —
- Eligible?
- —
Short-term bridge; refi at stabilization.
Rent comps 1 comps
| Address | Beds | Baths | Sqft | Rent | $/sqft | DOM | Units | Dist |
|---|---|---|---|---|---|---|---|---|
| 245 Tamarack Dr Unit 24511 Lake Mills, WI | 3.0 | 2.0 | 1250 | $1,600 | $1.28 | 45d | 1 | 0.51mi |
Listing history 19 events
-
2026-06-21days on market $145,000 Active 66 DOM
-
2026-06-19days on market $145,000 Active 64 DOM
-
2026-06-18days on market $145,000 Active 63 DOM
-
2026-06-17days on market $145,000 Active 62 DOM
-
2026-06-16days on market $145,000 Active 61 DOM
-
2026-06-15days on market $145,000 Active 60 DOM
-
2026-06-14days on market $145,000 Active 58 DOM
-
2026-06-12days on market $145,000 Active 57 DOM
-
2026-06-09days on market $145,000 Active 54 DOM
-
2026-06-08days on market $145,000 Active 53 DOM
-
2026-06-07days on market $145,000 Active 52 DOM
-
2026-06-05days on market $145,000 Active 50 DOM
-
2026-06-04days on market $145,000 Active 48 DOM
-
2026-06-02days on market $145,000 Active 47 DOM
-
2026-06-01days on market $145,000 Active 46 DOM
-
2026-05-31days on market $145,000 Active 45 DOM
-
2026-05-31days on market $145,000 Active 44 DOM
-
2026-05-07price $145,000 310-char remark
Show marketing remark (310 chars)
Well-maintained 4 bed, 2 bath manufactured home with a spacious layout, large kitchen, and open concept! Perfect for everyday living and entertaining. Enjoy the added bonus of a beautiful deck! Convenient location close to town amenities. Must see today! Monthly lot rent is $681; taxes and trash are included.
-
2026-04-15$150,000 Active 310-char remark
Show marketing remark (310 chars)
Well-maintained 4 bed, 2 bath manufactured home with a spacious layout, large kitchen, and open concept! Perfect for everyday living and entertaining. Enjoy the added bonus of a beautiful deck! Convenient location close to town amenities. Must see today! Monthly lot rent is $681; taxes and trash are included.
ⓘ Source: listings_history table (triggers on properties + properties_extension) + one-shot
backfill from property_details.listing_events for pre-trigger history.
Climate risk First Street
- Flood 1/10 Low FEMA zone X (unshaded) · 0% chance over 30 yrs
- Wildfire 2/10 Low
- Heat 2/10 Low 7 d/yr ≥102°F today · 13 d/yr by 30 yrs out
- Wind 2/10 Low
- Air quality 2/10 Low 1 unhealthy d/yr today · 1 by 30 yrs out
Nearby sold comps map
Loading sold comps map…
Walkable amenities ~0.75 mi
Loading nearby amenities…
Taxation est. · year 1
- Rental income
- $19,200
- − Mortgage interest
- −$8,122
- − Property taxes
- −$2,175
- − Insurance
- −$725
- − Repairs & maintenance
- −$1,536
- − Management
- −$1,536
- − Depreciation
- −$4,218
- Taxable income
- $888
- Est. tax owed @ 24.0%
- −$213
- After-tax cash flow
- $2,930/yr
For passive investors: Depreciation is non-cash, so a rental often shows a tax loss while cash-flowing — sheltering income. Rental losses are passive: they offset passive income freely, and up to $25,000/yr can offset ordinary (W-2) income if you actively participate and your MAGI is under $100k (phasing out to $0 by $150k); unused losses carry forward. On sale, claimed depreciation is recaptured at up to 25%, and gains may owe capital-gains tax (a 1031 exchange can defer both). Figures are a year-1 estimate at your 24.0% rate — not tax advice; consult a CPA.
Condition & rehab AI · 14 photos
This well-maintained 4-bedroom, 2-bathroom manufactured home is in average condition with some cosmetic updates needed. The home is located in a desirable neighborhood and has a spacious layout, large kitchen, and open concept. The home's curb appeal can be improved with some exterior and interior updates.
Repairs flagged
- Minor kitchen cabinets — slight wear
- Minor bathroom vanity — slight wear
- Moderate exterior siding — moderate wear
Value-add opportunities
- Resale update kitchen cabinets and countertops — modernizing the kitchen
- Resale update bathroom vanity and fixtures — modernizing the bathroom
- Both paint interior walls — enhances curb appeal and interior aesthetics
Renovation cost estimate screening
| Repair item | Severity | Est. cost |
|---|---|---|
| kitchen cabinets · slight wear | Minor | $500–3,000 |
| bathroom vanity · slight wear | Minor | $500–3,000 |
| exterior siding · moderate wear | Moderate | $3,000–15,000 |
| Total estimated repair cost · 3 items | $4,000–21,000 |
Value-add ROI direction
- Resale update kitchen cabinets and countertops — modernizing the kitchen ↑
- Resale update bathroom vanity and fixtures — modernizing the bathroom ↑
- Both paint interior walls — enhances curb appeal and interior aesthetics ↑
ⓘ Cost ranges are severity-bucket heuristics (US national rule-of-thumb). Get contractor quotes + a written scope before underwriting a rehab budget.
Schools (NCES district)
- District
- Lake Mills Area School District
- NCES district ID
- 5507710
- Math proficiency
- 38% ▼ -11.00%
- Reading proficiency
- 39% ▼ -6.00%
- Median HH income
- $62,848
- Composite
- 34.48/100
- National rank
- #5186
- State rank
- #152 of 342 in WI
Livability — Lake Mills
- Score
- 80/100
- State rank
- #68
- US rank
- #1833
Category grades
Schools grade is shown separately in the Schools card above.
Census & demographics
- Census place
- Lake Mills, WI
- City population
- 9,485
- Population (ZIP)
- 9,485
Population outlook (Jefferson County) Hauer SSP2
- Today (2025)
- 86,617 people
- By 2030
- 86,818 · +0.2%
- By 2040
- 85,552 · -1.2%
- By 2050
- 81,765 · -5.6%
- By 2075
- 68,937 · -20.4%
- By 2100
- 55,854 · -35.5%
Race, ethnicity, and origin ACS 2023
- Neighborhood character
- Predominantly White (90%)
- Race & ethnicity
- White 90% Hispanic / Latino 6% Two or more races 5% Native American 1%
- Hispanic origin (detail)
- Mexican 4% Cuban 1%
- Common ancestry
- Romanian 8% Portuguese 6% Lithuanian 3%
- Foreign-born
- 2% · Canada
- Languages at home
- 97% English-only · Spanish 1% French/Haitian/Cajun 1% German/W. Germanic 1%
Political lean MEDSL · Jefferson
- 2024 margin
- R (+16.4) · D 41.1% · R 57.5% · Other 1.4%
- 2008→2024 swing
- -17.2pp toward R · 2008: 0.8pp · 2024: -16.4pp
- All cycles
- 2024: R+16.4 2020: R+15.2 2016: R+16.2 2012: R+7.6 2008: D+0.8
Not yet ingested
- Civics
- —
Market trends
- HPI YoY
- ▼ -185.97%
- Current HPI
- 213.919
- Rent YoY
- —
- Metro
- —
- State GDP YoY
- ▲ 2.10%
- F500 in state
- 20
Industry mix (Fortune 500 HQ in WI)
| Industry | F500 HQs | Revenue |
|---|---|---|
| Industrial Machinery | 4 | $23B |
|
||
| Industrial Technology | 2 | $36B |
|
||
| Insurance | 1 | $36B |
|
||
| Professional Services | 1 | $19B |
|
||
| Utilities | 1 | $9B |
|
||
| Consumer Goods | 1 | $3B |
|
||
Price history
-3.3% since first listed2 events — show timeline
- 2026-05-07 Price Changed $145,000 SCWMLS
- 2026-04-15 Listed $150,000 SCWMLS
Cash-flow waterfall
monthlySold comps — $/sqft
last 12 mo · ≤1 miLoading sold comps…