228 S Clark St · Everton, MO
Flood risk No data
- FEMA flood zone
- —
- Chance of flooding over 30 yrs
- —
- Est. flood insurance / yr
- —
Fire risk No data
- Est. fire insurance / yr
- —
Heat risk No data
- Hot days now (above threshold)
- —
- Hot days in 30 yrs
- —
Wind risk No data
- Chance of severe wind over 30 yrs
- —
Air-quality risk No data
- Unhealthy air days now
- —
- Unhealthy air days in 30 yrs
- —
Risk factors via First Street. Map © Google.
Why this score? — see what drove the B grade
The composite is a weighted blend of 9 inputs, each scored 0–100. Each bar is that input's sub-score; the figure is the points it added to the 100-point composite (weight × sub-score).
- Cash flow +30.0/30.0
- 1% rule +10.0/10.0
- DSCR +10.0/10.0
- ARV discount +7.5/15.0
- Appreciation +7.0/10.0
- Schools +2.8/10.0
- Livability +2.7/5.0
- Rent growth +2.5/5.0
- Condition / age +1.0/5.0
$40,000
🖨 Deal sheet (PDF) 📄 Offer letter ✓ Due diligence
Listing remarks MLS
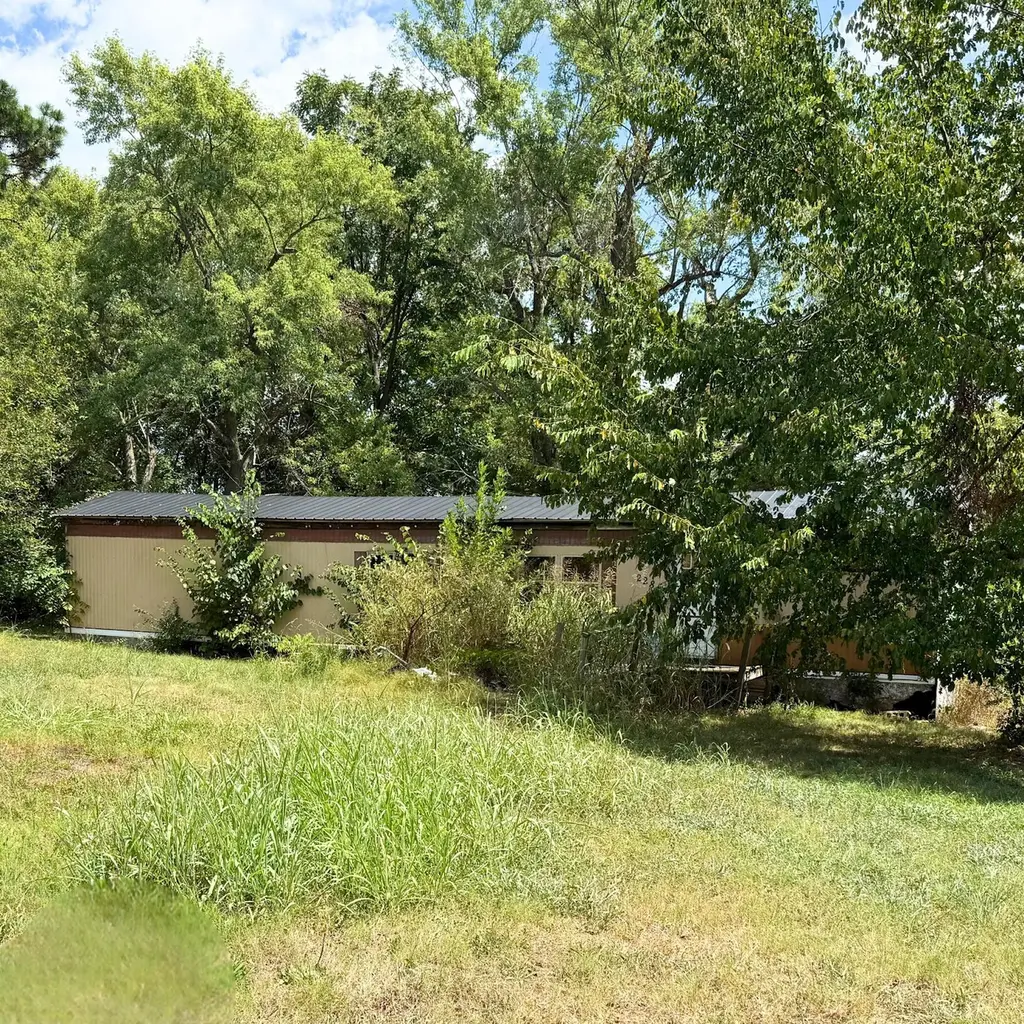
2-bedroom, 1-bath trailer home on a 0.65-acre lot in Everton, MO! The home has been partially remodeled and is ready for someone to finish and make their own. With a spacious lot and small-town setting, this property offers plenty of potential as a residence or investment opportunity.
Key facts
- 0.65 acre lot
- Built 1980
- Listed 306 days
Neighborhood map
What this means for you Summary
Snapshot
- This is a 2-bed/1.0-bath single-family listed at $40k. Condition is rated poor.
Deal economics
- At list price, monthly cash flow is $386 ($5k/yr) — positive.
- The deal already cash-flows at list — no discount required.
- Meets the 1% rule at list price ($839 rent vs $40k).
- Recommended offer: $35k (12.0% below list) — sets the bar for market timing.
Location & tenants
- Location reads 54/100 on livability (#804 in MO) — a working-class tenant base; expect higher turnover. Strengths: cost of living A+, housing A+; Watch: crime F, amenities F, commute F.
- Everton R-III (rural): math 20% / reading 40% proficiency, ranked #459 of 535 in MO (top 86%) — families likely to look elsewhere, expect single-tenant / working-renter base with shorter leases.
- Zoned schools: Everton Elem. (math 34% / reading 54%, grade F, #413 of 1,115 statewide, top 42%, 87 students, 97% FRL); Everton High (math 15% / reading 44%, grade F, #377 of 521 statewide, top 73%, 85 students, 96% FRL) — zoned schools average 97% FRL vs 49% district-wide (48 pts higher); higher-poverty schools than district average — tighter screening recommended.
- Market conditions: 26 active listings in the ZIP.
Forward outlook
- In year one you build about $2k of equity ($277 loan paydown + $2k appreciation (4.0% local appreciation)).
- Dade County population projected at -24% by 2050 — secular population decline; favor cash flow + early exit over multi-decade hold.
- At projected returns (4.0% appreciation + 3.0% rent growth), your $11k cash investment doubles in ~2 years — after that, you're playing with house money.
Negotiation context
- It's been on market 306 days — a 12% lower offer ($35k) is reasonable based on typical stale-listing flexibility.
Questions for the listing agent
- It's been on market 306 days. Have you received any prior offers? Is the seller open to a 12% concession, seller financing, or rate buy-down credit?
- Have any recent inspections been done? Can we get a copy of the seller's disclosures and any deferred-maintenance estimates?
- Why hasn't it sold? Are there any deal-killer items the seller is aware of (foundation, flood, title, zoning, code violations)?
- Is there a deadline driving the sale (1031 exchange, divorce, estate, relocation)? That informs how much negotiation room exists.
- Schools are F-rated, which usually means shorter tenancies and higher turnover. Who's the typical renter profile here, and what's been the actual vacancy rate?
- Crime grade is F in this area — have there been break-ins, vandalism, or insurance claims at this property in the last 3 years? What carrier currently insures it and at what premium?
- What's the average days-on-market for RENTAL listings here right now (not sales)? A rising rental-DOM trend means longer vacancies and softer asking-rent achievability than the comps imply.
- What's the recent tenant-quality profile in this submarket — average credit score on applications, eviction rate, late-payment / NSF rate, and stable-employment percentage? A property-management company in the area should have these aggregated.
- How much new for-sale + rental construction is in the pipeline within 1–3 miles? Heavy new supply typically softens prices + rents 12–24 months out; constrained supply supports both.
Investment metrics
- 1% rule
- 2.10% ✓
- Cap rate
- 17.89%
- Cash-on-cash
- 41.40%
- DSCR
- 2.84
- GRM
- 4.0
CMA / ARV
No comps found within radius.
Projected returns pro-forma
4.04% appreciation · 3.0% rent growth · sell at horizon
- IRR
- 48.3%
- Equity multiple
- 3.83×
- Total profit
- $31,696
- Equity at exit
- $20,383
- IRR
- 47.0%
- Equity multiple
- 7.76×
- Total profit
- $75,704
- Equity at exit
- $33,421
Cash invested: $11,200 (down + closing). Projections, not guarantees.
Landlord ↔ Tenant lean methodology
- Overall (STATE)
- 81 Strongly Landlord-Friendly
- State Missouri
- 81 Strongly Landlord-Friendly · R+10
- County
- — inherits STATE
- City
- — inherits STATE
ZIP-level market 65646
- Home prices YoY
- 1.7%
- Active inventory
- 26
- Price-to-rent
- 4.0×
Monthly cashflow live
- Estimated rent
- $839 medium interval (Pro) →
- Mortgage (P&I)
- −$210
- Tax est. 1.5%
- −$50 /mo · $600/yr
- Insurance
- −$17
- HOA
- −$0
- Vacancy / Maint / Mgmt
- −$176
- Net cashflow
- $386
Break-even live
Sensitivity live
| Price | -10% $414 | -5% $400 | +0% $386 | +5% $373 | +10% $359 |
|---|---|---|---|---|---|
| Rent | -10% $320 | -5% $353 | +0% $386 | +5% $420 | +10% $453 |
| Rate | -1.0pp $407 | -0.5pp $397 | base $386 | +0.5pp $376 | +1.0pp $366 |
UW: 25.0% down · 7.5% · 30yr · 1.5% tax · 5.0% vac · 8.0% maint · 8.0% mgmt
Financing live
Cash to close
- Down payment
- $10,000
- Closing costs
- $1,200
- Reserves months
- —
- Total cash needed
- —
Loan-product check · same deal, 3 products live
Conventional
25% down · 7.5% · 30yr
- Down + closing
- —
- Monthly P&I
- —
- Monthly cashflow
- —
- DSCR
- —
- Eligible?
- —
Personal DTI + credit; lowest rate.
DSCR
20% down · 8.5% · 30yr
- Down + closing
- —
- Monthly P&I
- —
- Monthly cashflow
- —
- DSCR
- —
- Eligible?
- —
No personal income docs; deal must DSCR.
Hard money
10% down · 12.0% · 12mo
- Down + closing
- —
- Monthly P&I
- —
- Monthly cashflow
- —
- DSCR
- —
- Eligible?
- —
Short-term bridge; refi at stabilization.
Listing history 17 events
-
2026-06-21days on market $40,000 Active 306 DOM
-
2026-06-21days on market $40,000 Active 305 DOM
-
2026-06-18days on market $40,000 Active 303 DOM
-
2026-06-17days on market $40,000 Active 302 DOM
-
2026-06-16days on market $40,000 Active 301 DOM
-
2026-06-15days on market $40,000 Active 300 DOM
-
2026-06-13days on market $40,000 Active 298 DOM
-
2026-06-12pricedays on market $40,000 Active 297 DOM
-
2026-06-09days on market $45,000 Active 294 DOM
-
2026-06-08days on market $45,000 Active 293 DOM
-
2026-06-07days on market $45,000 Active 292 DOM
-
2026-06-05days on market $45,000 Active 290 DOM
-
2026-06-04days on market $45,000 Active 288 DOM
-
2026-06-02days on market $45,000 Active 287 DOM
-
2026-06-01days on market $45,000 Active 286 DOM
-
2026-05-31days on market $45,000 Active 285 DOM
-
2025-08-19$45,000 Active 285-char remark
Show marketing remark (285 chars)
2-bedroom, 1-bath trailer home on a 0.65-acre lot in Everton, MO! The home has been partially remodeled and is ready for someone to finish and make their own. With a spacious lot and small-town setting, this property offers plenty of potential as a residence or investment opportunity.
ⓘ Source: listings_history table (triggers on properties + properties_extension) + one-shot
backfill from property_details.listing_events for pre-trigger history.
Nearby sold comps map
Loading sold comps map…
Walkable amenities ~0.75 mi
Loading nearby amenities…
Taxation est. · year 1
- Rental income
- $10,069
- − Mortgage interest
- −$2,241
- − Property taxes
- −$600
- − Insurance
- −$200
- − Repairs & maintenance
- −$805
- − Management
- −$805
- − Depreciation
- −$1,164
- Taxable income
- $4,253
- Est. tax owed @ 24.0%
- −$1,021
- After-tax cash flow
- $3,616/yr
For passive investors: Depreciation is non-cash, so a rental often shows a tax loss while cash-flowing — sheltering income. Rental losses are passive: they offset passive income freely, and up to $25,000/yr can offset ordinary (W-2) income if you actively participate and your MAGI is under $100k (phasing out to $0 by $150k); unused losses carry forward. On sale, claimed depreciation is recaptured at up to 25%, and gains may owe capital-gains tax (a 1031 exchange can defer both). Figures are a year-1 estimate at your 24.0% rate — not tax advice; consult a CPA.
Condition & rehab AI · 1 photo
This single-family home requires extensive repairs and maintenance, including exterior siding and roof work, as well as lawn maintenance. Significant updates are needed to increase its resale and rental value.
Repairs flagged
- Major exterior siding — Significant wear and tear
- Major roof — Visible damage
Value-add opportunities
- Both landscaping and lawn maintenance — A well-maintained lawn and exterior can enhance both resale and rental value
- Both exterior siding repair — Repairing the siding will improve the home's appearance and increase its value
- Both roof repair — Fixing the roof will prevent further damage and improve the home's overall condition
Renovation cost estimate screening
| Repair item | Severity | Est. cost |
|---|---|---|
| exterior siding · Significant wear and tear | Major | $15,000–50,000 |
| roof · Visible damage | Major | $15,000–50,000 |
| Total estimated repair cost · 2 items | $30,000–100,000 |
Value-add ROI direction
- Both landscaping and lawn maintenance — A well-maintained lawn and exterior can enhance both resale and rental value ↑
- Both exterior siding repair — Repairing the siding will improve the home's appearance and increase its value ↑
- Both roof repair — Fixing the roof will prevent further damage and improve the home's overall condition ↑
ⓘ Cost ranges are severity-bucket heuristics (US national rule-of-thumb). Get contractor quotes + a written scope before underwriting a rehab budget.
Schools (NCES district)
- District
- Everton R-III
- NCES district ID
- 2911580
- Math proficiency
- 20% ▼ -5.00%
- Reading proficiency
- 40% ▬ 0.00%
- Median HH income
- $40,988
- Composite
- 28.14/100
- National rank
- #12203
- State rank
- #459 of 535 in MO
Livability — Everton
- Score
- 54/100
- State rank
- #804
- US rank
- #24183
Category grades
Schools grade is shown separately in the Schools card above.
Census & demographics
- Census place
- Everton, MO
- Population (ZIP)
- 1,812
Population outlook (Dade County) Hauer SSP2
- Today (2025)
- 7,043 people
- By 2030
- 6,687 · -5.1%
- By 2040
- 5,989 · -15.0%
- By 2050
- 5,324 · -24.4%
- By 2075
- 4,122 · -41.5%
- By 2100
- 3,168 · -55.0%
Race, ethnicity, and origin ACS 2023
- Neighborhood character
- Predominantly White (93%)
- Race & ethnicity
- White 93% Two or more races 5% Hispanic / Latino 2% Native American 1%
- Common ancestry
- Lithuanian 9% Italian 5% Serbian 1%
- Foreign-born
- 2% · Canada
- Languages at home
- 98% English-only · German/W. Germanic 1% Spanish 1%
Political lean MEDSL · Dade
- 2024 margin
- Solid R (+67.1) · D 16.0% · R 83.2%
- 2008→2024 swing
- -26.3pp toward R · 2008: -40.9pp · 2024: -67.1pp
- All cycles
- 2024: R+67.1 2020: R+67.0 2016: R+64.5 2012: R+50.2 2008: R+40.9
Not yet ingested
- Civics
- —
Market trends
- HPI YoY
- ▲ 4.04%
- Current HPI
- 245.0109
- Rent YoY
- —
- Metro
- —
- State GDP YoY
- ▲ 1.84%
- F500 in state
- 20
Industry mix (Fortune 500 HQ in MO)
| Industry | F500 HQs | Revenue |
|---|---|---|
| Healthcare | 1 | $163B |
|
||
| Insurance | 1 | $21B |
|
||
| Industrial Technology | 1 | $17B |
|
||
| Retail | 1 | $16B |
|
||
| Industrial Distribution | 1 | $10B |
|
||
| Utilities | 1 | $9B |
|
||
Price history
1 event — show timeline
- 2025-08-19 Listed $45,000 SOMO
Cash-flow waterfall
monthlySold comps — $/sqft
last 12 mo · ≤1 miLoading sold comps…