6101 E Sienna Bouquet Pl · Phoenix, AZ
Flood risk 5/10 · Moderate
- FEMA flood zone
- X (shaded)
- Chance of flooding over 30 yrs
- 0.52%
- Est. flood insurance / yr
- $507 – $1,088
Fire risk 5/10 · Moderate
- Est. fire insurance / yr
- $610 – $1,132
Heat risk 8/10 · Major
- Hot days now (above 109°F)
- 7 days/yr
- Hot days in 30 yrs
- 19 days/yr
Wind risk 1/10 · Minimal
- Chance of severe wind over 30 yrs
- —
Air-quality risk 3/10 · Minor
- Unhealthy air days now
- 2 days/yr
- Unhealthy air days in 30 yrs
- 3 days/yr
Risk factors via First Street. Map © Google.
Why this score? — see what drove the D grade
The composite is a weighted blend of 9 inputs, each scored 0–100. Each bar is that input's sub-score; the figure is the points it added to the 100-point composite (weight × sub-score).
- ARV discount +13.5/15.0
- Cash flow +9.1/30.0
- Schools +5.4/10.0
- Livability +3.8/5.0
- DSCR +2.5/10.0
- Rent growth +2.5/5.0
- Condition / age +2.5/5.0
- 1% rule +1.7/10.0
- Appreciation +0.0/10.0
$1,050,000
🖨 Deal sheet (PDF) 📄 Offer letter ✓ Due diligence
Listing remarks MLS
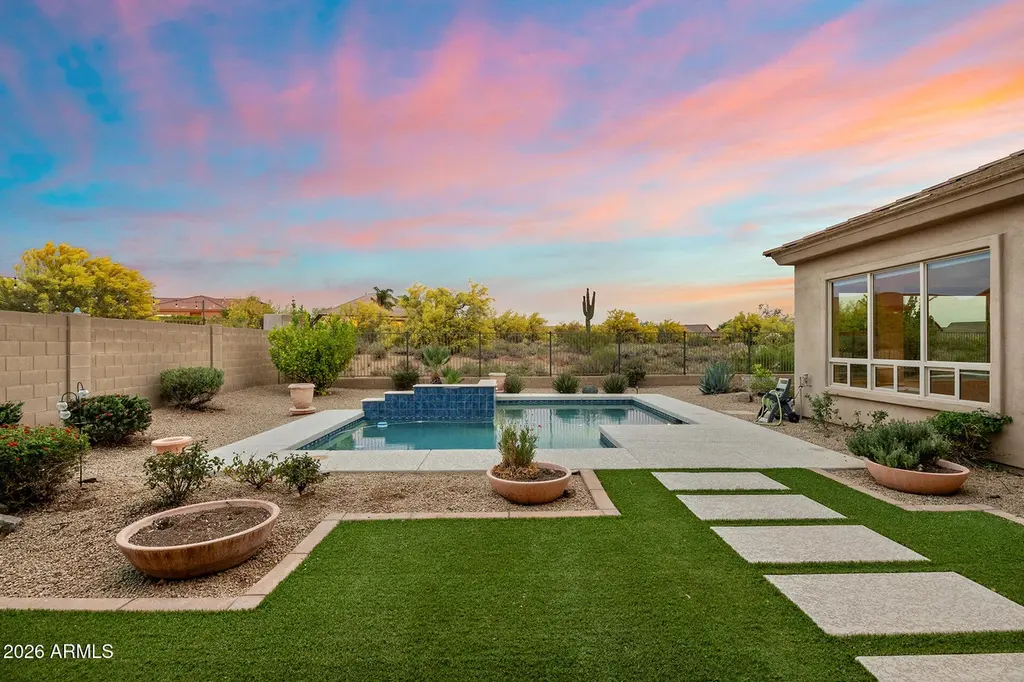
Live in style, surrounded by privacy, space, and elegance - this is the luxury you deserve! Boasting 3,036 sqft of beautifully designed living space on an expansive 10,875 sqft lot, this 3-bed, 3-bath home combines elegance with everyday functionality. Office could be used as a 4th bedroom. From the moment you step inside, you're welcomed by a bright, airy interior filled with natural light streaming through large glass windows - perfectly framing picturesque views of the meticulously landscaped surroundings. The kitchen features granite countertops, rich oak cabinetry, a center island, pantry, and breakfast bar, along with a formal dining area. The primary suite offers a spacious walk-in closet and a luxurious full bath featuring a separate soaking tub and walk-in shower. Throughout the home, a sophisticated blend of carpet, laminate, and tile flooring enhances both comfort and design. Step outside to a truly mesmerizing backyard oasis - professionally landscaped front and back, with a large covered patio overlooking a sparkling pool set at the heart of a beautifully designed yard. It's the perfect setting for relaxing, entertaining, or simply enjoying the serene, scenic views. With a 3-car garage plus additional 3-car slab parking, this home offers both convenience and ample space for all your needs.
Key facts
- Rich oak cabinetry
- Walk-in closet
- Formal dining area
Tags
Neighborhood map
What this means for you Summary
Snapshot
- This is a 3-bed/4.0-bath single-family listed at $1.05M.
Deal economics
- At list price, monthly cash flow is $-813 ($-10k/yr) — negative.
- To cash-flow at today's rent, offer at most $906k (13.7% below list).
- To meet the 1% rule (rent ≥ 1% of price), the offer needs to be $699k (33.4% below list).
- Recommended offer: $699k (33.4% below list) — sets the bar for 1% rule.
- Cap rate 5.4% vs local median 3.3% in Phoenix — top-decile yield for the area; either an underpriced asset or a hidden risk that comps aren't pricing in. Stress-test before assuming the spread holds.
Location & tenants
- Location reads 75/100 on livability (#16 in AZ, #3,924 nationally) — a middle-class / working-renter tenant base. Strengths: amenities A+, commute A+, housing A+; Watch: health & safety C-, crime F.
- Cave Creek Unified District (4244) (urban): math 57% / reading 59% proficiency, ranked #13 of 249 in AZ (top 5%) — acceptable for families but not a draw, mixed tenant base, ~2y average lease; only 8% free/reduced lunch — higher-income household profile.
- Zoned schools: Lone Mountain Elementary School (math 63% / reading 65%, grade B, #115 of 1,109 statewide, top 11%, 423 students, 8% FRL); Sonoran Trails Middle School (math 48% / reading 50%, grade C-, #31 of 218 statewide, top 14%, 761 students, 7% FRL); Cactus Shadows High School (math 49% / reading 46%, grade D, #48 of 381 statewide, top 13%, 1,588 students, 6% FRL) — zoned schools at 7% FRL track the district average.
- Market conditions: 396 active listings in the ZIP; 26 comparable units currently listed for rent nearby; rentals lingering (median 46d on market — plan ~5-8 weeks vacancy on turnover, expect pricing pressure); 65% of comp listings sitting > 30 days — soft ceiling on asking rent; high-income renter base; 36,011 units permitted in Maricopa County in 2024 (12,801 in 5+ unit buildings).
- At $6,994/mo this rent would consume 65% of the median local household income ($129k/yr) (locally 169% of renters already pay >50% of income on rent) — very limited rent-growth headroom before tenants either downsize or default.
Forward outlook
- Local home prices are declining (-3.0%/yr); year-one equity from $7k of loan paydown is wiped out by about $32k of value loss. Plan a longer hold.
- Maricopa County population projected at +38% by 2050 — long-run rental-demand tailwind backs the buy-and-hold thesis.
Negotiation context
- It's been on market 40 days — a 3% lower offer ($1.02M) is reasonable based on typical stale-listing flexibility.
Risks & watch-outs
- Climate carrying-cost: moderate flood risk; moderate wildfire risk; extreme-heat days projected 7→19/yr by 2055 (HVAC capex compounding) — expect insurance premiums to compound above CPI over the hold.
Questions for the listing agent
- What do current leases actually rent for vs. the listed asking? Can we see a recent rent roll and the last 12 months of T-12 income?
- It's been on market 40 days. Have you received any prior offers? Is the seller open to a 33% concession, seller financing, or rate buy-down credit?
- What does the HOA fee cover, when was the last increase, and are there any pending special assessments or reserve-fund shortfalls?
- Is there a deadline driving the sale (1031 exchange, divorce, estate, relocation)? That informs how much negotiation room exists.
- Crime grade is F in this area — have there been break-ins, vandalism, or insurance claims at this property in the last 3 years? What carrier currently insures it and at what premium?
- The area grade is low — what's the realistic commute time and amenity access for the typical tenant pool here? Any planned neighborhood developments (good or bad) we should know about?
- What's the average days-on-market for RENTAL listings here right now (not sales)? A rising rental-DOM trend means longer vacancies and softer asking-rent achievability than the comps imply.
- What's the recent tenant-quality profile in this submarket — average credit score on applications, eviction rate, late-payment / NSF rate, and stable-employment percentage? A property-management company in the area should have these aggregated.
- How much new for-sale + rental construction is in the pipeline within 1–3 miles? Heavy new supply typically softens prices + rents 12–24 months out; constrained supply supports both.
Investment metrics
- 1% rule
- 0.67% ✗
- Cap rate
- 5.36%
- Cash-on-cash
- -3.32%
- DSCR
- 0.85
- GRM
- 12.5
CMA / ARV
- ARV (median comp)
- $1,212,909
- List price
- $1,050,000
- Delta
- -13.43%
- Verdict
- UNDERPRICED
- Comps
- 20 within 1.0 mi
Show comp detail 12 sales within ~0.75 mi
| Address | Dist | Beds/Ba | Sqft | Sold | Price | $/sf | Match |
|---|---|---|---|---|---|---|---|
| 6110 E Bramble Berry Ln | 0.08mi | 4/3.0 (+1) | 3,036 (0%) | 4mo | $1,375,000 | $453 | 84 |
| 6114 E Bramble Berry Ln | 0.08mi | 4/3.0 (+1) | 2,945 (-3%) | 3mo | $1,200,000 | $407 | 79 |
| 32654 N 58th St | 0.40mi | 4/3.5 (+1) | 3,044 (+0%) | 5mo | $1,050,000 | $345 | 70 |
| 6315 E Lonesome Trl | 0.34mi | 4/3.0 (+1) | 2,861 (-6%) | 3mo | $1,310,000 | $458 | 63 |
| 5813 E Ashler Hills Dr | 0.52mi | 3/3.0 | 2,898 (-4%) | 2mo | $950,000 | $328 | 62 |
| 6466 E Evening Glow Dr | 0.71mi | 3/2.5 | 3,009 (-1%) | 1mo | $1,625,000 | $540 | 58 |
| 31710 N 61st Pl | 0.67mi | 3/3.5 | 3,216 (+6%) | 1mo | $1,505,000 | $468 | 56 |
| 31854 N 61st Pl | 0.59mi | 3/2.5 | 3,216 (+6%) | 2mo | $1,500,000 | $466 | 54 |
| 6335 E Marioca Cir | 0.50mi | 3/2.5 | 2,750 (-9%) | 2mo | $1,200,000 | $436 | 53 |
| 6038 E Long Shadow Trl | 0.42mi | 4/2.5 (+1) | 2,679 (-12%) | 1mo | $1,200,000 | $448 | 49 |
| 6013 E Westland Dr | 0.55mi | 4/3.0 (+1) | 2,679 (-12%) | 3mo | $1,005,000 | $375 | 44 |
| 33400 N 56th St | 0.74mi | 3/2.5 | 2,616 (-14%) | 2mo | $1,160,000 | $443 | 35 |
Match score weights: distance 35% · size 25% · config 20% · recency 20%. Top-matched comps best support the ARV.
Projected returns pro-forma
-3.0% appreciation · 3.0% rent growth · sell at horizon
- IRR
- -21.9%
- Equity multiple
- 0.24×
- Total profit
- $-222,388
- Equity at exit
- $156,558
- IRR
- -15.9%
- Equity multiple
- 0.11×
- Total profit
- $-262,195
- Equity at exit
- $90,785
Cash invested: $294,000 (down + closing). Projections, not guarantees.
Landlord ↔ Tenant lean methodology
- Overall (STATE)
- 87 Strongly Landlord-Friendly
- State Arizona
- 87 Strongly Landlord-Friendly · R+3
- County
- — inherits STATE
- City
- — inherits STATE
ZIP-level market 85331
- Home prices YoY
- -29.8%
- Active inventory
- 396
- Price-to-rent
- 12.5×
Monthly cashflow live
- Estimated rent
- $6,994 high interval (Pro) →
- Mortgage (P&I)
- −$5,506
- Tax from tax record
- −$258 /mo · $3,099/yr
- Insurance
- −$438
- HOA
- −$136
- Vacancy / Maint / Mgmt
- −$1,469
- Net cashflow
- $-813
Break-even live
Sensitivity live
| Price | -10% $-219 | -5% $-516 | +0% $-813 | +5% $-1,110 | +10% $-1,407 |
|---|---|---|---|---|---|
| Rent | -10% $-1,366 | -5% $-1,089 | +0% $-813 | +5% $-537 | +10% $-261 |
| Rate | -1.0pp $-284 | -0.5pp $-546 | base $-813 | +0.5pp $-1,085 | +1.0pp $-1,362 |
UW: 25.0% down · 7.5% · 30yr · 1.5% tax · 5.0% vac · 8.0% maint · 8.0% mgmt
Financing live
Cash to close
- Down payment
- $262,500
- Closing costs
- $31,500
- Reserves months
- —
- Total cash needed
- —
Loan-product check · same deal, 3 products live
Conventional
25% down · 7.5% · 30yr
- Down + closing
- —
- Monthly P&I
- —
- Monthly cashflow
- —
- DSCR
- —
- Eligible?
- —
Personal DTI + credit; lowest rate.
DSCR
20% down · 8.5% · 30yr
- Down + closing
- —
- Monthly P&I
- —
- Monthly cashflow
- —
- DSCR
- —
- Eligible?
- —
No personal income docs; deal must DSCR.
Hard money
10% down · 12.0% · 12mo
- Down + closing
- —
- Monthly P&I
- —
- Monthly cashflow
- —
- DSCR
- —
- Eligible?
- —
Short-term bridge; refi at stabilization.
Rent comps 26 comps
| Address | Beds | Baths | Sqft | Rent | $/sqft | DOM | Units | Dist |
|---|---|---|---|---|---|---|---|---|
| 5940 E Bramble Berry Ln Cave Creek, AZ | 3.0 | 2.0 | 2168 | $7,000 | $3.23 | 45d | 1 | 0.15mi |
| 6237 E Bramble Berry Ln Cave Creek, AZ | 3.0 | 3.0 | 3036 | $11,500 | $3.79 | 45d | 1 | 0.24mi |
| 5805 E Jake Hvn Cave Creek, AZ | 3.0 | 2.0 | 2182 | $3,395 | $1.56 | 26d | 1 | 0.38mi |
| 6540 E Maria Dr Cave Creek, AZ | 3.0 | 2.5 | 2521 | $6,500 | $2.58 | 45d | 1 | 0.56mi |
| 5907 E Calle de las Estrellas Cave Creek, AZ | 4.0 | 3.5 | 3468 | $12,000 | $3.46 | 45d | 1 | 0.62mi |
| 5936 E Night Glow Cir Scottsdale, AZ | 3.0 | 2.5 | 2601 | $10,000 | $3.84 | 45d | 1 | 0.75mi |
| 34151 N 60th Pl Scottsdale, AZ | 3.0 | 2.5 | 2504 | $6,000 | $2.40 | 26d | 1 | 0.84mi |
| 6193 E Brilliant Sky Dr Scottsdale, AZ | 3.0 | 2.5 | 2329 | $6,000 | $2.58 | 45d | 1 | 0.87mi |
| 6332 E Dusty Coyote Cir Scottsdale, AZ | 4.0 | 3.5 | 3791 | $10,000 | $2.64 | 26d | 1 | 0.89mi |
| 34327 N 61st Pl Scottsdale, AZ | 4.0 | 4.5 | 3326 | $9,000 | $2.71 | 45d | 1 | 0.93mi |
| 6703 E Calle de Las Estrellas Rd Unit 1 Cave Creek, AZ | 3.0 | 2.0 | 2400 | $3,600 | $1.50 | 26d | 1 | 0.95mi |
| 6703 E Calle de Las Estrellas Rd Unit 1 Cave Creek, AZ | 3.0 | 2.0 | 2400 | $3,600 | $1.50 | 23d | 1 | 0.95mi |
| 32472 N 68th Pl Scottsdale, AZ | 3.0 | 2.5 | 2360 | $6,000 | $2.54 | 26d | 1 | 0.98mi |
| 6469 E Amber Sun Dr Scottsdale, AZ | 4.0 | 4.5 | 2903 | $10,500 | $3.62 | 26d | 1 | 1.03mi |
| 6894 E Thirsty Cactus Ln Scottsdale, AZ | 3.0 | 2.5 | 2358 | $5,750 | $2.44 | 45d | 1 | 1.03mi |
| 6280 E Amber Sun Dr Scottsdale, AZ | 3.0 | 2.5 | 2774 | $6,500 | $2.34 | 26d | 1 | 1.03mi |
| 34061 N 67th St Scottsdale, AZ | 3.0 | 2.0 | 2393 | $7,000 | $2.93 | 45d | 1 | 1.15mi |
| 7020 E Mighty Saguaro Way Scottsdale, AZ | 3.0 | 2.5 | 2415 | $8,000 | $3.31 | 45d | 1 | 1.17mi |
| 6751 E Amber Sun Dr Scottsdale, AZ | 2.0 | 2.5 | 2386 | $7,500 | $3.14 | 45d | 1 | 1.25mi |
| 6445 E Wildcat Dr Cave Creek, AZ | 3.0 | 2.0 | 2849 | $2,995 | $1.05 | 1d | 1 | 1.26mi |
| 7132 E Thirsty Cactus Ln Scottsdale, AZ | 3.0 | 2.5 | 2358 | $6,000 | $2.54 | 45d | 1 | 1.29mi |
| 5824 E Montgomery Rd Cave Creek, AZ | 3.0 | 2.0 | 2310 | $4,900 | $2.12 | 45d | 1 | 1.32mi |
| 6884 E Amber Sun Dr Scottsdale, AZ | 3.0 | 2.5 | 2547 | $9,500 | $3.73 | 45d | 1 | 1.37mi |
| 33690 N 71st Way Scottsdale, AZ | 3.0 | 3.0 | 2293 | $8,000 | $3.49 | 45d | 1 | 1.43mi |
| 7155 E Night Glow Cir Scottsdale, AZ | 3.0 | 3.0 | 2161 | $6,000 | $2.78 | 45d | 1 | 1.48mi |
| 7149 E Night Glow Cir Scottsdale, AZ | 3.0 | 3.0 | 2254 | $5,500 | $2.44 | 45d | 1 | 1.48mi |
HOA detail
- Monthly dues
- $136 · $1,632/yr
- Likely covers
- pool
Listing history 2 events
-
2026-04-28price $1,050,000 1323-char remark
Show marketing remark (1323 chars)
Live in style, surrounded by privacy, space, and elegance - this is the luxury you deserve! Boasting 3,036 sqft of beautifully designed living space on an expansive 10,875 sqft lot, this 3-bed, 3-bath home combines elegance with everyday functionality. Office could be used as a 4th bedroom. From the moment you step inside, you're welcomed by a bright, airy interior filled with natural light streaming through large glass windows - perfectly framing picturesque views of the meticulously landscaped surroundings. The kitchen features granite countertops, rich oak cabinetry, a center island, pantry, and breakfast bar, along with a formal dining area. The primary suite offers a spacious walk-in closet and a luxurious full bath featuring a separate soaking tub and walk-in shower. Throughout the home, a sophisticated blend of carpet, laminate, and tile flooring enhances both comfort and design. Step outside to a truly mesmerizing backyard oasis - professionally landscaped front and back, with a large covered patio overlooking a sparkling pool set at the heart of a beautifully designed yard. It's the perfect setting for relaxing, entertaining, or simply enjoying the serene, scenic views. With a 3-car garage plus additional 3-car slab parking, this home offers both convenience and ample space for all your needs.
-
2026-04-10$1,200,000 Active 1323-char remark
Show marketing remark (1323 chars)
Live in style, surrounded by privacy, space, and elegance - this is the luxury you deserve! Boasting 3,036 sqft of beautifully designed living space on an expansive 10,875 sqft lot, this 3-bed, 3-bath home combines elegance with everyday functionality. Office could be used as a 4th bedroom. From the moment you step inside, you're welcomed by a bright, airy interior filled with natural light streaming through large glass windows - perfectly framing picturesque views of the meticulously landscaped surroundings. The kitchen features granite countertops, rich oak cabinetry, a center island, pantry, and breakfast bar, along with a formal dining area. The primary suite offers a spacious walk-in closet and a luxurious full bath featuring a separate soaking tub and walk-in shower. Throughout the home, a sophisticated blend of carpet, laminate, and tile flooring enhances both comfort and design. Step outside to a truly mesmerizing backyard oasis - professionally landscaped front and back, with a large covered patio overlooking a sparkling pool set at the heart of a beautifully designed yard. It's the perfect setting for relaxing, entertaining, or simply enjoying the serene, scenic views. With a 3-car garage plus additional 3-car slab parking, this home offers both convenience and ample space for all your needs.
ⓘ Source: listings_history table (triggers on properties + properties_extension) + one-shot
backfill from property_details.listing_events for pre-trigger history.
Tax reassessment forecast AZ · Resets to sale price
- Current annual tax
- $3,099 · $258/mo
- Projected year-2 tax
- $6,930 · $578/mo
- Expected delta
- +$3,831/yr (+$319/mo · 123.6%)
ⓘ Screening estimate from a state-policy table — verify with the county assessor before closing.
Climate risk First Street
- Flood 5/10 Major FEMA zone X (shaded) · 52% chance over 30 yrs
- Wildfire 5/10 Major
- Heat 8/10 Severe 7 d/yr ≥109°F today · 19 d/yr by 30 yrs out
- Wind 1/10 Low
- Air quality 3/10 Moderate 2 unhealthy d/yr today · 3 by 30 yrs out
Nearby sold comps map
Loading sold comps map…
Walkable amenities ~0.75 mi
Loading nearby amenities…
Taxation est. · year 1
- Rental income
- $83,924
- − Mortgage interest
- −$58,816
- − Property taxes
- −$3,099
- − Insurance
- −$5,250
- − Repairs & maintenance
- −$6,714
- − Management
- −$6,714
- − HOA
- −$1,632
- − Depreciation
- −$30,545
- Taxable loss
- −$28,846
- Est. tax savings @ 24.0%
- +$6,923
- After-tax cash flow
- $-2,833/yr
For passive investors: Depreciation is non-cash, so a rental often shows a tax loss while cash-flowing — sheltering income. Rental losses are passive: they offset passive income freely, and up to $25,000/yr can offset ordinary (W-2) income if you actively participate and your MAGI is under $100k (phasing out to $0 by $150k); unused losses carry forward. On sale, claimed depreciation is recaptured at up to 25%, and gains may owe capital-gains tax (a 1031 exchange can defer both). Figures are a year-1 estimate at your 24.0% rate — not tax advice; consult a CPA.
Schools (NCES district)
- District
- Cave Creek Unified District (4244)
- NCES district ID
- 0400001
- Math proficiency
- 57% ▼ -9.00%
- Reading proficiency
- 59% ▼ -8.00%
- Median HH income
- $102,788
- Composite
- 54.46/100
- National rank
- #1351
- State rank
- #13 of 249 in AZ
Livability — Phoenix
- Score
- 75/100
- State rank
- #16
- US rank
- #3924
Category grades
Schools grade is shown separately in the Schools card above.
Census & demographics
- Census place
- Phoenix, AZ
- County
- Maricopa County · 4,537,380 people
- City population
- 1,500,198
- Metro
- Phoenix-Mesa-Chandler, AZ
- Population (ZIP)
- 31,968
- Household income
- $129,083
- Rent vs Own
- Severe rent burden
- 169.0
Population outlook (Maricopa County) Hauer SSP2
- Today (2025)
- 4,979,203 people
- By 2030
- 5,378,229 · +8.0%
- By 2040
- 6,156,598 · +23.6%
- By 2050
- 6,872,376 · +38.0%
- By 2075
- 8,401,270 · +68.7%
- By 2100
- 9,247,439 · +85.7%
Race, ethnicity, and origin ACS 2023
- Neighborhood character
- Predominantly White (86%)
- Race & ethnicity
- White 86% Hispanic / Latino 7% Two or more races 5% Asian 2%
- Hispanic origin (detail)
- Mexican 4%
- Common ancestry
- Romanian 5% Italian 4% Portuguese 4%
- Foreign-born
- 6% · Canada
- Languages at home
- 93% English-only · Spanish 3% Other Indo-European 1% Russian/Polish/Slavic 1%
Political lean MEDSL · Maricopa
- 2024 margin
- Toss-up / Even · D 47.7% · R 51.2% · Other 1.1%
- 2008→2024 swing
- +7.1pp toward D · 2008: -10.6pp · 2024: -3.5pp
- All cycles
- 2024: R+3.5 2020: D+2.2 2016: R+3.5 2012: R+12.0 2008: R+10.6
Not yet ingested
- Civics
- —
Market trends
- HPI YoY
- ▼ -134.66%
- Current HPI
- 316.6855
- Rent YoY
- —
- Metro
- Phoenix-Mesa-Chandler, AZ
- State GDP YoY
- ▲ 4.54%
- F500 in state
- 20
Industry mix (Fortune 500 HQ in AZ)
| Industry | F500 HQs | Revenue |
|---|---|---|
| Technology | 2 | $13B |
|
||
| Mining / Metals | 1 | $23B |
|
||
| Environmental Services | 1 | $16B |
|
||
| Metals / Steel | 1 | $14B |
|
||
| Technology Distribution | 1 | $9B |
|
||
| Homebuilding | 1 | $8B |
|
||
Price history
-12.5% since first listed2 events — show timeline
- 2026-04-28 Price Changed $1,050,000 ARMLS
- 2026-04-10 Listed $1,200,000 ARMLS
Property tax history
+13.1%/yrLatest (2025): $3,099 · +2.8% YoY. Source: county tax records.
Cash-flow waterfall
monthlySold comps — $/sqft
last 12 mo · ≤1 miLoading sold comps…