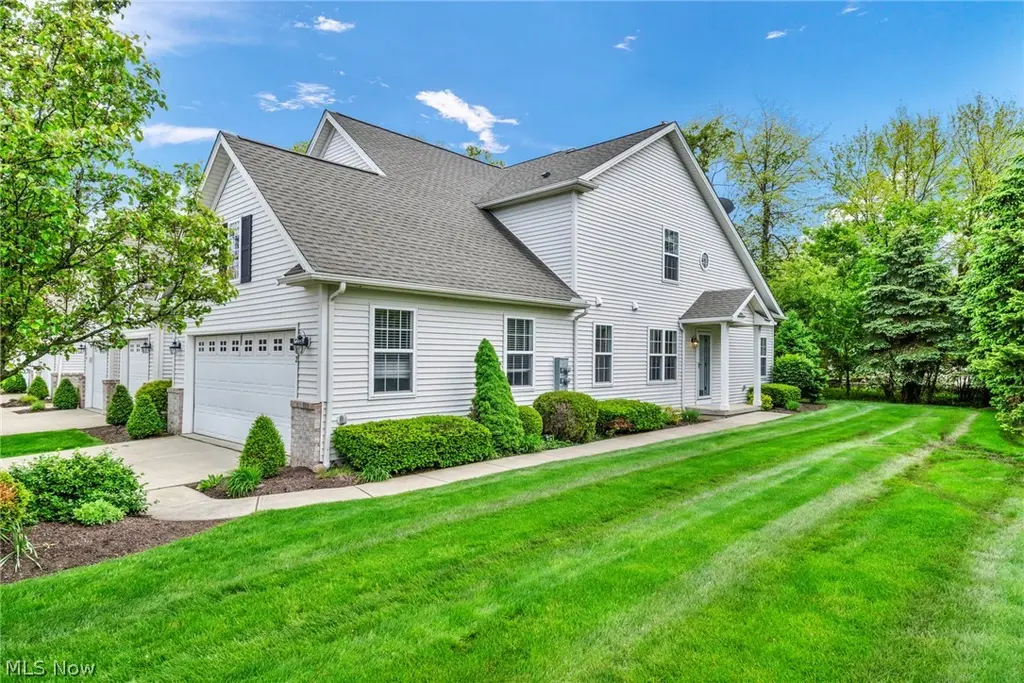
772 Wildberry Cir · Avon Lake, OH
Flood risk 1/10 · Minimal
- FEMA flood zone
- X (unshaded)
- Chance of flooding over 30 yrs
- 0.0%
- Est. flood insurance / yr
- $473 – $860
Fire risk 1/10 · Minimal
- Est. fire insurance / yr
- $713 – $1,323
Heat risk 3/10 · Minor
- Hot days now (above 97°F)
- 7 days/yr
- Hot days in 30 yrs
- 16 days/yr
Wind risk 1/10 · Minimal
- Chance of severe wind over 30 yrs
- —
Air-quality risk 2/10 · Minimal
- Unhealthy air days now
- 2 days/yr
- Unhealthy air days in 30 yrs
- 2 days/yr
Risk factors via First Street. Map © Google.
Why this score? — see what drove the D- grade
The composite is a weighted blend of 9 inputs, each scored 0–100. Each bar is that input's sub-score; the figure is the points it added to the 100-point composite (weight × sub-score).
- ARV discount +12.6/15.0
- Schools +7.0/10.0
- Cash flow +6.9/30.0
- Livability +4.2/5.0
- 1% rule +3.2/10.0
- Rent growth +2.5/5.0
- Condition / age +2.5/5.0
- DSCR +1.1/10.0
- Appreciation +0.0/10.0
$315,000
🖨 Deal sheet 📄 Offer letter ✓ Due diligence
Listing remarks
772 Wildberry Circle offers an exceptional opportunity to enjoy low maintenance living, whilst situated on a desirable, rare corner lot. This home is priced to sell - needing some minor but modern updates while still being move in ready. Step inside to a stunning great room highlighted by soaring ceilings, bright skylights, and custom built-in shelving. Enhanced with fresh neutral tones that create a bright and inviting atmosphere. Dual sliding glass doors extend the living space outdoors to a covered concrete patio, perfect for peaceful mornings. The spacious eat-in kitchen is designed for both functionality and style featuring a breakfast bar, stainless steel appliances and impressive ful
Key facts
- Eat-in kitchen
- Great room
- Corner lot
Tags
Property features AI
Finance
- HOA & community: Wildberry homeowners association with monthly fee; HOA includes common area maintenance, insurance, grounds and structure maintenance, pool(s), reserve fund, roof maintenance, and snow removal; Community features include lake access and pool
Exterior
- Parking: Attached 2-car garage; Driveway and additional guest parking with garage door opener and electricity
- Security: Smoke detector(s)
- Utilities: Public water; Public sewer
- Home design: Two-story attached property
- Construction: Frame construction with vinyl siding; Asphalt/fiberglass roof; Below-grade finished area (basement) is unfinished full basement
- Exterior features: Front porch and covered rear porch; In-ground private community pool; Smoke detectors
Interior
- Kitchen: Eat-in kitchen; Range; Microwave; Dishwasher; Disposal; Refrigerator
- Bedrooms: Multiple second-floor bedrooms with carpeted floors (examples: two bedrooms ~11x10 and 11x11; another ~12x10)
- Flooring: Hardwood in dining room; Tile in laundry; Carpet in bedrooms
- Bathrooms: Two full bathrooms and one half bathroom; One main-level bathroom
- Heating & cooling: Forced-air gas heating; Central air conditioning
- Interior features: Blinds and window treatments with double-pane insulated windows and skylights; Ceiling fans; Crown molding; High ceilings; Central vacuum; Jetted tub; Breakfast bar; Eat-in kitchen; Multiple closets including his-and-hers closets
- Laundry & utility: Main-level laundry with washer and electric dryer hookups (in-unit)
Neighborhood map
What this means for you Summary
Snapshot
- This is a 3-bed/2.5-bath townhouse listed at $315k.
Deal economics
- At list price, monthly cash flow is $-482 ($-6k/yr) — negative.
- To cash-flow at today's rent, offer at most $230k (27.1% below list).
- To meet the 1% rule (rent ≥ 1% of price), the offer needs to be $259k (17.7% below list).
- Recommended offer: $230k (27.1% below list) — sets the bar for cash-flow.
- Cap rate 4.5% vs local median 3.2% in Avon Lake — top-decile yield for the area; either an underpriced asset or a hidden risk that comps aren't pricing in. Stress-test before assuming the spread holds.
Location & tenants
- Location reads 84/100 on livability (#52 in OH, #736 nationally) — a professional / high-income tenant draw. Strengths: schools A+, crime A+, employment A+; Watch: commute F.
- Avon Lake City (suburban): math 78% / reading 80% proficiency, ranked #48 of 656 in OH (top 7%) — strong family-tenant draw, lease renewals of 3-5y typical; only 10% free/reduced lunch — higher-income household profile.
- Market conditions: 178 active listings in the ZIP; 4 comparable units currently listed for rent nearby; rentals leasing fast (median 2d on market — plan ~1-2 weeks tenant-placement turnaround); high-income renter base; 1,098 units permitted in Lorain County in 2024 (20 in 5+ unit buildings).
Forward outlook
- Local home prices are declining (-3.0%/yr); year-one equity from $2k of loan paydown is wiped out by about $9k of value loss. Plan a longer hold.
Negotiation context
- It's been on market 28 days — a 2% lower offer ($310k) is reasonable based on typical stale-listing flexibility.
- 9 sale attempts since 22y ago with the ask held roughly flat each time — persistent listings suggest the price (not the market) is what's stuck; bring a comps-based counter.
- Current owner paid $175k; list at $315k implies a 80% gain — meaningful room to come down on a strong offer.
Questions for the listing agent
- What do current leases actually rent for vs. the listed asking? Can we see a recent rent roll and the last 12 months of T-12 income?
- What does the HOA fee cover, when was the last increase, and are there any pending special assessments or reserve-fund shortfalls?
- Is there a deadline driving the sale (1031 exchange, divorce, estate, relocation)? That informs how much negotiation room exists.
- Schools are A-rated — typically a magnet for longer-tenancy family renters. What's the average tenant stay here, and is there a school-zone premium baked into asking?
- The area grade is low — what's the realistic commute time and amenity access for the typical tenant pool here? Any planned neighborhood developments (good or bad) we should know about?
- What's the average days-on-market for RENTAL listings here right now (not sales)? A rising rental-DOM trend means longer vacancies and softer asking-rent achievability than the comps imply.
- What's the recent tenant-quality profile in this submarket — average credit score on applications, eviction rate, late-payment / NSF rate, and stable-employment percentage? A property-management company in the area should have these aggregated.
- How much new for-sale + rental construction is in the pipeline within 1–3 miles? Heavy new supply typically softens prices + rents 12–24 months out; constrained supply supports both.
Investment metrics
- 1% rule
- 0.82% ✗
- Cap rate
- 4.46%
- Cash-on-cash
- -6.56%
- DSCR
- 0.71
- GRM
- 10.1
CMA / ARV
- ARV (median comp)
- $355,263
- List price
- $315,000
- Delta
- -11.33%
- Verdict
- UNDERPRICED
- Comps
- 20 within 1.0 mi
Show comp detail 12 sales within ~0.75 mi
| Address | Dist | Beds/Ba | Sqft | Sold | Price | $/sf | Match |
|---|---|---|---|---|---|---|---|
| 766 Wildberry Cir | 0.03mi | 3/2.5 | 1,864 (-0%) | 12mo | $325,000 | $174 | 88 |
| 830 Wildberry Cir | 0.13mi | 3/2.5 | 1,872 (-0%) | 13mo | $357,500 | $191 | 83 |
| 824 Wildberry Cir | 0.14mi | 3/2.5 | 1,943 (+4%) | 6mo | $350,000 | $180 | 82 |
| 720 Cranberry Ct | 0.18mi | 3/3.5 | 1,927 (+3%) | 9mo | $367,500 | $191 | 76 |
| 642 Linsberry Ct | 0.11mi | 2/2.5 (-1) | 2,047 (+9%) | 6mo | $330,000 | $161 | 69 |
| 679 Harbour Town Ct | 0.72mi | 3/2.5 | 1,906 (+2%) | 3mo | $485,000 | $254 | 62 |
| 714 Harbour Town Ct | 0.68mi | 3/2.5 | 1,854 (-1%) | 9mo | $473,985 | $256 | 59 |
| 674 Harbour Town Ct | 0.64mi | 3/2.5 | 1,991 (+6%) | 6mo | $475,000 | $239 | 55 |
| 726 Harbour Town Ct | 0.71mi | 3/2.5 | 1,954 (+4%) | 11mo | $499,990 | $256 | 51 |
| 720 Harbour Town Ct | 0.70mi | 3/2.5 | 1,954 (+4%) | 13mo | $497,205 | $254 | 50 |
| 724 Harbour Town Ct | 0.70mi | 3/2.5 | 2,054 (+10%) | 8mo | $524,780 | $255 | 44 |
| 722 Harbour Town Ct | 0.70mi | 3/2.5 | 2,054 (+10%) | 14mo | $501,375 | $244 | 40 |
Match score weights: distance 35% · size 25% · config 20% · recency 20%. Top-matched comps best support the ARV.
Projected returns pro-forma
-3.0% appreciation · 3.0% rent growth · sell at horizon
- IRR
- -27.5%
- Equity multiple
- 0.08×
- Total profit
- $-81,509
- Equity at exit
- $46,968
- IRR
- -25.4%
- Equity multiple
- -0.24×
- Total profit
- $-109,495
- Equity at exit
- $27,235
Cash invested: $88,200 (down + closing). Projections, not guarantees.
Landlord ↔ Tenant lean methodology
- Overall (STATE)
- 73 Landlord-Friendly
- State Ohio
- 73 Landlord-Friendly · R+6
- County
- — inherits STATE
- City
- — inherits STATE
ZIP-level market 44012
- Active inventory
- 178
- Price-to-rent
- 10.1×
Monthly cashflow live
- Estimated rent
- $2,592 medium interval (Pro) →
- Mortgage (P&I)
- −$1,652
- Tax from tax record
- −$447 /mo · $5,365/yr
- Insurance
- −$131
- HOA
- −$300
- Vacancy / Maint / Mgmt
- −$544
- Net cashflow
- $-482
Break-even live
UW: 25.0% down · 7.5% · 30yr · 1.5% tax · 5.0% vac · 8.0% maint · 8.0% mgmt
Financing live
Cash to close
- Down payment
- $78,750
- Closing costs
- $9,450
- Reserves months
- —
- Total cash needed
- —
Loan-product check · same deal, 3 products live
Conventional
25% down · 7.5% · 30yr
- Down + closing
- —
- Monthly P&I
- —
- Monthly cashflow
- —
- DSCR
- —
- Eligible?
- —
Personal DTI + credit; lowest rate.
DSCR
20% down · 8.5% · 30yr
- Down + closing
- —
- Monthly P&I
- —
- Monthly cashflow
- —
- DSCR
- —
- Eligible?
- —
No personal income docs; deal must DSCR.
Hard money
10% down · 12.0% · 12mo
- Down + closing
- —
- Monthly P&I
- —
- Monthly cashflow
- —
- DSCR
- —
- Eligible?
- —
Short-term bridge; refi at stabilization.
Rent comps 4 comps
| Address | Beds | Baths | Sqft | Rent | $/sqft | DOM | Units | Dist |
|---|---|---|---|---|---|---|---|---|
| 1417 Hollow Wood Ln Avon, OH | 3.0 | 2.0 | 1728 | $2,695 | $1.56 | 1d | 1 | 0.68mi |
| 36631 Bordeaux Avon, OH | 2.0 | 2.0 | 1394 | $2,300 | $1.65 | 1d | 2 | 0.96mi |
| 2042 W Reserve Cir Avon, OH | 3.0 | 2.5 | 1760 | $2,500 | $1.42 | 43d | 1 | 1.29mi |
| 37560 Chester Rd Avon, OH | 1.0–3.0 | 1.0–2.0 | 1194 | $3,055 | $2.56 | 1d | 1 | 1.34mi |
HOA detail
- Monthly dues
- $300 · $3,600/yr
Listing history 30 events
-
2026-06-13statusdays on market $315,000 Pending 28 DOM
-
2026-06-10price $315,000 Active 25 DOM
-
2026-06-09days on market $324,900 Active 25 DOM
-
2026-06-08days on market $324,900 Active 24 DOM
-
2026-06-07days on market $324,900 Active 23 DOM
-
2026-06-05days on market $324,900 Active 20 DOM
-
2026-06-03days on market $324,900 Active 19 DOM
-
2026-06-02days on market $324,900 Active 18 DOM
-
2026-06-01days on market $324,900 Active 17 DOM
-
2026-05-31days on market $324,900 Active 16 DOM
-
2026-05-15$324,900 Active 1999-char remark
-
2026-04-19historical
-
2026-02-03price $349,900
-
2026-01-22$379,000 Active
-
2025-12-31historical
-
2025-11-07price $379,900
-
2025-10-21price $387,500
-
2025-09-30$389,900 Active
-
2024-11-13price $394,900
-
2024-11-10status Active
-
2024-11-02$390,000 Active
-
2011-09-28soldstatus $175,000
-
2011-09-28soldstatus $175,000
-
2010-11-08$159,900
-
2009-09-18historical
-
2008-07-20historical
-
2007-08-30$191,654
-
2007-07-20$185,400
-
2005-10-04historical
-
2004-10-07$211,400
ⓘ Source: listings_history table (triggers on properties + properties_extension) + one-shot
backfill from property_details.listing_events for pre-trigger history.
Tax reassessment forecast OH · Partial reset (capped growth)
- Current annual tax
- $5,365 · $447/mo
- Projected year-2 tax
- $5,365 · $447/mo
- Expected delta
- $0/yr ($0/mo · 0.0%)
ⓘ Screening estimate from a state-policy table — verify with the county assessor before closing.
Climate risk First Street
- Flood 1/10 Low FEMA zone X (unshaded) · 0% chance over 30 yrs
- Wildfire 1/10 Low
- Heat 3/10 Moderate 7 d/yr ≥97°F today · 16 d/yr by 30 yrs out
- Wind 1/10 Low
- Air quality 2/10 Low 2 unhealthy d/yr today · 2 by 30 yrs out
Nearby sold comps map
Loading sold comps map…
Walkable amenities ~0.75 mi
Loading nearby amenities…
Taxation est. · year 1
- Rental income
- $31,107
- − Mortgage interest
- −$17,645
- − Property taxes
- −$5,365
- − Insurance
- −$1,575
- − Repairs & maintenance
- −$2,489
- − Management
- −$2,489
- − HOA
- −$3,600
- − Depreciation
- −$9,164
- Taxable loss
- −$11,219
- Est. tax savings @ 24.0%
- +$2,693
- After-tax cash flow
- $-3,096/yr
For passive investors: Depreciation is non-cash, so a rental often shows a tax loss while cash-flowing — sheltering income. Rental losses are passive: they offset passive income freely, and up to $25,000/yr can offset ordinary (W-2) income if you actively participate and your MAGI is under $100k (phasing out to $0 by $150k); unused losses carry forward. On sale, claimed depreciation is recaptured at up to 25%, and gains may owe capital-gains tax (a 1031 exchange can defer both). Figures are a year-1 estimate at your 24.0% rate — not tax advice; consult a CPA.
Schools (NCES district)
- District
- Avon Lake City
- NCES district ID
- 3904812
- Math proficiency
- 78% ▼ -10.00%
- Reading proficiency
- 80% ▼ -6.00%
- Median HH income
- $79,608
- Composite
- 69.66/100
- National rank
- #296
- State rank
- #48 of 656 in OH
Livability — Avon Lake
- Score
- 84/100
- State rank
- #52
- US rank
- #736
Category grades
Schools grade is shown separately in the Schools card above.
Census & demographics
- Census place
- Avon Lake, OH
- County
- Lorain County · 219,437 people
- City population
- 25,752
- Metro
- Cleveland-Elyria, OH
- Population (ZIP)
- 25,752
- Household income
- $115,567
- Rent vs Own
- Severe rent burden
- 290.0
Population outlook (Lorain County) Hauer SSP2
- Today (2025)
- 314,924 people
- By 2030
- 317,546 · +0.8%
- By 2040
- 317,962 · +1.0%
- By 2050
- 312,872 · -0.7%
- By 2075
- 301,806 · -4.2%
- By 2100
- 278,271 · -11.6%
Race, ethnicity, and origin ACS 2023
- Neighborhood character
- Predominantly White (91%)
- Race & ethnicity
- White 91% Two or more races 4% Hispanic / Latino 3% Asian 2% Black 1%
- Common ancestry
- Romanian 8% Slovak 2% Lithuanian 1%
- Foreign-born
- 4% · Canada, China
- Languages at home
- 94% English-only · Spanish 2% Other Indo-European 1% Other Asian/Pacific 1%
Political lean MEDSL · Lorain
- 2024 margin
- Lean R (+5.7) · D 46.7% · R 52.4%
- 2008→2024 swing
- -23.6pp toward R · 2008: 17.9pp · 2024: -5.7pp
- All cycles
- 2024: R+5.7 2020: R+2.5 2016: R+0.3 2012: D+14.4 2008: D+17.9
Not yet ingested
- Civics
- —
Market trends
- HPI YoY
- ▼ -148.16%
- Current HPI
- 207.1177
- Rent YoY
- —
- Metro
- Cleveland-Elyria, OH
- State GDP YoY
- ▲ 1.98%
- F500 in state
- 48
Industry mix (Fortune 500 HQ in OH)
| Industry | F500 HQs | Revenue |
|---|---|---|
| Insurance | 3 | $145B |
|
||
| Industrial Machinery | 3 | $49B |
|
||
| Financial Services | 3 | $24B |
|
||
| Consumer Goods | 2 | $93B |
|
||
| Aerospace / Defense | 2 | $47B |
|
||
| Utilities | 2 | $33B |
|
||
Price history
+49.0% since first listed22 events — show timeline
- 2026-06-13 Pending — MLSNOW
- 2026-06-09 Price Changed $315,000 MLSNOW
- 2026-05-15 Listed $324,900 MLSNOW
- 2026-04-19 Listing Removed — MLSNOW
- 2026-02-03 Price Changed $349,900 MLSNOW
- 2026-01-22 Listed $379,000 MLSNOW
- 2025-12-31 Listing Removed — MLSNOW
- 2025-11-07 Price Changed $379,900 MLSNOW
- 2025-10-21 Price Changed $387,500 MLSNOW
- 2025-09-30 Listed $389,900 MLSNOW
- 2024-11-13 Price Changed $394,900 MLSNOW
- 2024-11-10 Relisted — MLSNOW
- 2024-11-02 Listed $390,000 MLSNOW
- 2011-09-28 Sold (Public Records) $175,000 Public Records
- 2011-09-28 Sold (MLS) $175,000 MLSNOW
- 2010-11-08 Listed $159,900 MLSNOW
- 2009-09-18 Listing Removed — MLSNOW
- 2008-07-20 Listing Removed — MLSNOW
- 2007-08-30 Listed $191,654 MLSNOW
- 2007-07-20 Listed $185,400 MLSNOW
- 2005-10-04 Listing Removed — MLSNOW
- 2004-10-07 Listed $211,400 MLSNOW
Property tax history
+2.0%/yrLatest (2025): $5,365 · +9.4% YoY. Source: county tax records.
Cash-flow waterfall
monthlySold comps — $/sqft
last 12 mo · ≤1 miLoading sold comps…