1607 Bigley Ave · Charleston, WV
Flood risk 10/10 · Severe
- FEMA flood zone
- X (shaded)
- Chance of flooding over 30 yrs
- 0.99%
- Est. flood insurance / yr
- $507 – $1,088
Fire risk 3/10 · Minor
- Est. fire insurance / yr
- $787 – $1,461
Heat risk 6/10 · Moderate
- Hot days now (above 100°F)
- 7 days/yr
- Hot days in 30 yrs
- 21 days/yr
Wind risk 2/10 · Minimal
- Chance of severe wind over 30 yrs
- 1.0%
Air-quality risk 2/10 · Minimal
- Unhealthy air days now
- 0 days/yr
- Unhealthy air days in 30 yrs
- 1 days/yr
Risk factors via First Street. Map © Google.
Why this score? — see what drove the F grade
The composite is a weighted blend of 9 inputs, each scored 0–100. Each bar is that input's sub-score; the figure is the points it added to the 100-point composite (weight × sub-score).
- ARV discount +7.5/15.0
- Livability +4.2/5.0
- Schools +2.9/10.0
- Rent growth +2.5/5.0
- Condition / age +2.2/5.0
- Cash flow +0.0/30.0
- 1% rule +0.0/10.0
- DSCR +0.0/10.0
- Appreciation +0.0/10.0
$3,999,999
🖨 Deal sheet (PDF) 📄 Offer letter ✓ Due diligence
Listing remarks
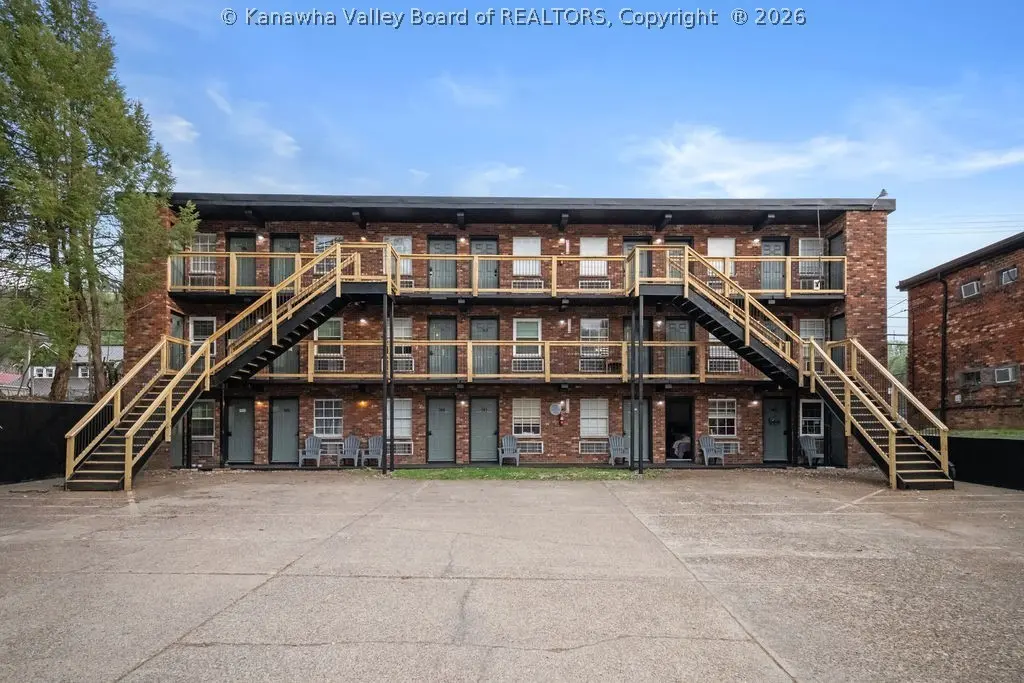
Exceptional multi-family investment opportunity in Charleston featuring a 55-unit garden-style apartment complex along with 7 single-family homes. This diverse portfolio offers strong in-place income with a healthy NOI. The property provides a unique blend of unit types, appealing to a wide tenant base and helping reduce vacancy risk. The garden-style apartments offer efficient layouts and consistent rental demand, while the single-family homes add flexibility and additional income streams. Well-positioned within the Charleston market, this asset presents an excellent opportunity for investors seeking stable cash flow with upside potential through rent optimization and operational efficienc
Key facts
- Unit types
- Single-family homes
- Healthy noi
Tags
Property features AI
Exterior
- Parking: Asphalt parking lot with 21+ spaces
- Utilities: Public water; Public sewer
- Home design: Residential income property; Apartment
- Construction: Brick and frame construction
- Exterior features: Composition/shingle roof; 1.03-acre lot; Asphalt parking
Interior
- Flooring: Carpet; Vinyl
- Heating & cooling: Baseboard heating; Wall furnace; Window cooling units; Wall cooling units
- Interior features: Insulated windows; Carpet and vinyl flooring
Neighborhood map
What this means for you Summary
Snapshot
- This is a townhouse listed at $4.00M. Condition is rated fair.
Deal economics
- At list price, monthly cash flow is $-24k ($-283k/yr) — negative.
- To cash-flow at today's rent, offer at most $122k (97.0% below list).
- To meet the 1% rule (rent ≥ 1% of price), the offer needs to be $115k (97.1% below list).
- Recommended offer: $115k (97.1% below list) — sets the bar for 1% rule.
- Cap rate -0.8% vs local median 3.8% in Charleston — below-typical yield; the buyer is paying a premium for something (appreciation thesis, condition, location) that the cap rate doesn't capture.
Location & tenants
- Location reads 85/100 on livability (#3 in WV, #524 nationally) — a professional / high-income tenant draw. Strengths: amenities A+, commute A+, cost of living A+; Watch: crime F.
- Kanawha County Schools (suburban): math 29% / reading 40% proficiency, ranked #17 of 55 in WV (top 31%) — families likely to look elsewhere, expect single-tenant / working-renter base with shorter leases.
- Zoned schools: Mary C. Snow West Side Elementary (math 12% / reading 12%, grade F, #375 of 377 statewide, top 99%, 353 students, 0% FRL); West Side Middle School (math 7% / reading 18%, grade F, #109 of 109 statewide, top 100%, 377 students, 0% FRL); Capital High School (math 22% / reading 52%, grade F, #32 of 110 statewide, top 34%, 1,086 students, 0% FRL) — zoned schools average 0% FRL vs 46% district-wide (46 pts lower); this property's tenant base skews higher-income than the district average.
- Zoned-school proficiency averages 20% at this address vs 34% district-wide (-14 pts) — the specific schools serving this property underperform the Kanawha County Schools average; the district grade overstates school quality for this exact location.
- Market conditions: 99 active listings in the ZIP; 103 units permitted in Kanawha County in 2024 (0 in 5+ unit buildings).
Forward outlook
- Local home prices are declining (-3.0%/yr); year-one equity from $28k of loan paydown is wiped out by about $120k of value loss. Plan a longer hold.
- Kanawha County population projected at -17% by 2050 — secular population decline; favor cash flow + early exit over multi-decade hold.
Negotiation context
- It's been on market 69 days — a 6% lower offer ($3.76M) is reasonable based on typical stale-listing flexibility.
- 9 sale attempts since 3y ago; this cycle's ask has dropped $250k (6%) from the opening price — seller is motivated, your offer sets the floor, not the list.
Risks & watch-outs
- Watch-outs: flood insurance adds $66/mo.
- Climate carrying-cost: severe flood risk; extreme-heat days projected 7→21/yr by 2055 (HVAC capex compounding) — expect insurance premiums to compound above CPI over the hold.
Questions for the listing agent
- What do current leases actually rent for vs. the listed asking? Can we see a recent rent roll and the last 12 months of T-12 income?
- It's been on market 69 days. Have you received any prior offers? Is the seller open to a 97% concession, seller financing, or rate buy-down credit?
- Have any recent inspections been done? Can we get a copy of the seller's disclosures and any deferred-maintenance estimates?
- Built in 1978 — when were the roof, HVAC, electrical panel, plumbing, and water heater last replaced?
- What's the actual annual flood-insurance premium (NFIP or private), and is the property in a SFHA with mandatory coverage?
- Why hasn't it sold? Are there any deal-killer items the seller is aware of (foundation, flood, title, zoning, code violations)?
- Is there a deadline driving the sale (1031 exchange, divorce, estate, relocation)? That informs how much negotiation room exists.
- Schools are A-rated — typically a magnet for longer-tenancy family renters. What's the average tenant stay here, and is there a school-zone premium baked into asking?
- Crime grade is F in this area — have there been break-ins, vandalism, or insurance claims at this property in the last 3 years? What carrier currently insures it and at what premium?
- The area grade is low — what's the realistic commute time and amenity access for the typical tenant pool here? Any planned neighborhood developments (good or bad) we should know about?
- What's the average days-on-market for RENTAL listings here right now (not sales)? A rising rental-DOM trend means longer vacancies and softer asking-rent achievability than the comps imply.
- What's the recent tenant-quality profile in this submarket — average credit score on applications, eviction rate, late-payment / NSF rate, and stable-employment percentage? A property-management company in the area should have these aggregated.
- How much new for-sale + rental construction is in the pipeline within 1–3 miles? Heavy new supply typically softens prices + rents 12–24 months out; constrained supply supports both.
Investment metrics
- 1% rule
- 0.03% ✗
- Cap rate
- -0.76%
- Cash-on-cash
- -25.18%
- DSCR
- -0.12
- GRM
- 289.9
CMA / ARV
No comps found within radius.
Projected returns pro-forma
-3.0% appreciation · 3.0% rent growth · sell at horizon
- IRR
- -73.3%
- Equity multiple
- -0.92×
- Total profit
- $-2,150,976
- Equity at exit
- $596,413
- IRR
- —
- Equity multiple
- -2.40×
- Total profit
- $-3,813,490
- Equity at exit
- $345,847
Cash invested: $1,120,000 (down + closing). Projections, not guarantees.
Landlord ↔ Tenant lean methodology
- Overall (STATE)
- 83 Strongly Landlord-Friendly
- State West Virginia
- 83 Strongly Landlord-Friendly · R+22
- County
- — inherits STATE
- City
- — inherits STATE
ZIP-level market 25302
- Home prices YoY
- -21.8%
- Active inventory
- 99
- Price-to-rent
- 289.9×
Monthly cashflow live
- Estimated rent
- $1,150 medium interval (Pro) →
- Mortgage (P&I)
- −$20,976
- Tax from tax record
- −$1,764 /mo · $21,169/yr
- Insurance
- −$1,667
- Flood insurance flood zone
- −$66 /mo · $798/yr
- HOA
- −$0
- Vacancy / Maint / Mgmt
- −$242
- Net cashflow
- $-23,565
Break-even live
Sensitivity live
| Price | -10% $-21,301 | -5% $-22,433 | +0% $-23,565 | +5% $-24,697 | +10% $-25,829 |
|---|---|---|---|---|---|
| Rent | -10% $-23,656 | -5% $-23,611 | +0% $-23,565 | +5% $-23,520 | +10% $-23,474 |
| Rate | -1.0pp $-21,551 | -0.5pp $-22,548 | base $-23,565 | +0.5pp $-24,602 | +1.0pp $-25,656 |
UW: 25.0% down · 7.5% · 30yr · 1.5% tax · 5.0% vac · 8.0% maint · 8.0% mgmt
Financing live
Cash to close
- Down payment
- $1,000,000
- Closing costs
- $120,000
- Reserves months
- —
- Total cash needed
- —
Loan-product check · same deal, 3 products live
Conventional
25% down · 7.5% · 30yr
- Down + closing
- —
- Monthly P&I
- —
- Monthly cashflow
- —
- DSCR
- —
- Eligible?
- —
Personal DTI + credit; lowest rate.
DSCR
20% down · 8.5% · 30yr
- Down + closing
- —
- Monthly P&I
- —
- Monthly cashflow
- —
- DSCR
- —
- Eligible?
- —
No personal income docs; deal must DSCR.
Hard money
10% down · 12.0% · 12mo
- Down + closing
- —
- Monthly P&I
- —
- Monthly cashflow
- —
- DSCR
- —
- Eligible?
- —
Short-term bridge; refi at stabilization.
Listing history 35 events
-
2026-06-21days on market $3,999,999 Active 69 DOM
-
2026-06-19days on market $3,999,999 Active 67 DOM
-
2026-06-18days on market $3,999,999 Active 66 DOM
-
2026-06-17days on market $3,999,999 Active 65 DOM
-
2026-06-16days on market $3,999,999 Active 64 DOM
-
2026-06-15days on market $3,999,999 Active 63 DOM
-
2026-06-14pricedays on market $3,999,999 Active 61 DOM
-
2026-06-12days on market $4,250,000 Active 60 DOM
-
2026-06-09days on market $4,250,000 Active 57 DOM
-
2026-06-08days on market $4,250,000 Active 56 DOM
-
2026-06-07days on market $4,250,000 Active 55 DOM
-
2026-06-05days on market $4,250,000 Active 52 DOM
-
2026-06-03days on market $4,250,000 Active 51 DOM
-
2026-06-02days on market $4,250,000 Active 50 DOM
-
2026-06-01days on market $4,250,000 Active 49 DOM
-
2026-05-31days on market $4,250,000 Active 48 DOM
-
2026-05-30days on market $4,250,000 Active 47 DOM
-
2026-04-13$4,250,000 Active
-
2026-03-29historical $1,025
-
2026-03-18$1,025
-
2024-05-11historical $800
-
2024-05-11$800
-
2024-04-10historical $650
-
2024-03-26$650
-
2024-03-24historical $650
-
2024-03-18$650
-
2024-03-13historical $650
-
2024-03-13historical $650
-
2024-03-13$650
-
2024-01-13$650
-
2024-01-13historical $650
-
2023-12-23$650
-
2023-11-28historical $750
-
2023-11-20$750
-
2023-06-08historical
ⓘ Source: listings_history table (triggers on properties + properties_extension) + one-shot
backfill from property_details.listing_events for pre-trigger history.
Tax reassessment forecast WV · Resets to sale price
- Current annual tax
- $21,169 · $1,764/mo
- Projected year-2 tax
- $23,600 · $1,967/mo
- Expected delta
- +$2,431/yr (+$203/mo · 11.5%)
ⓘ Screening estimate from a state-policy table — verify with the county assessor before closing.
Climate risk First Street
- Flood 10/10 Extreme FEMA zone X (shaded) · 99% chance over 30 yrs
- Wildfire 3/10 Moderate
- Heat 6/10 Major 7 d/yr ≥100°F today · 21 d/yr by 30 yrs out
- Wind 2/10 Low 100% chance of damaging wind over 30 yrs
- Air quality 2/10 Low 0 unhealthy d/yr today · 1 by 30 yrs out
Nearby sold comps map
Loading sold comps map…
Walkable amenities ~0.75 mi
Loading nearby amenities…
Taxation est. · year 1
- Rental income
- $13,800
- − Mortgage interest
- −$224,062
- − Property taxes
- −$21,169
- − Insurance
- −$20,797
- − Repairs & maintenance
- −$1,104
- − Management
- −$1,104
- − Depreciation
- −$116,364
- Taxable loss
- −$370,800
- Est. tax savings @ 24.0%
- +$88,992
- After-tax cash flow
- $-193,789/yr
For passive investors: Depreciation is non-cash, so a rental often shows a tax loss while cash-flowing — sheltering income. Rental losses are passive: they offset passive income freely, and up to $25,000/yr can offset ordinary (W-2) income if you actively participate and your MAGI is under $100k (phasing out to $0 by $150k); unused losses carry forward. On sale, claimed depreciation is recaptured at up to 25%, and gains may owe capital-gains tax (a 1031 exchange can defer both). Figures are a year-1 estimate at your 24.0% rate — not tax advice; consult a CPA.
Condition & rehab AI · 1 photo
This multi-family property requires significant exterior and interior repairs, but presents a strong investment opportunity with a diverse portfolio of units.
Repairs flagged
- Major exterior siding — Significant wear and tear
- Major roof — No visible damage, but age is implied
- Major HVAC/mechanicals — No visible systems, but age is implied
Value-add opportunities
- Both paint exterior — Enhances curb appeal and resale value
- Both repair windows — Improves energy efficiency and resale value
- Both replace HVAC — Enhances comfort and reduces utility costs
Renovation cost estimate screening
| Repair item | Severity | Est. cost |
|---|---|---|
| exterior siding · Significant wear and tear | Major | $15,000–50,000 |
| roof · No visible damage, but age is implied | Major | $15,000–50,000 |
| HVAC/mechanicals · No visible systems, but age is implied | Major | $15,000–50,000 |
| Total estimated repair cost · 3 items | $45,000–150,000 |
Value-add ROI direction
- Both paint exterior — Enhances curb appeal and resale value ↑
- Both repair windows — Improves energy efficiency and resale value ↑
- Both replace HVAC — Enhances comfort and reduces utility costs ↑
ⓘ Cost ranges are severity-bucket heuristics (US national rule-of-thumb). Get contractor quotes + a written scope before underwriting a rehab budget.
Schools (NCES district)
- District
- Kanawha County Schools
- NCES district ID
- 5400600
- Math proficiency
- 29% ▼ -13.00%
- Reading proficiency
- 40% ▼ -7.00%
- Median HH income
- $44,329
- Composite
- 29.35/100
- National rank
- #6540
- State rank
- #17 of 55 in WV
Livability — Charleston
- Score
- 85/100
- State rank
- #3
- US rank
- #524
Category grades
Schools grade is shown separately in the Schools card above.
Census & demographics
- Census place
- Charleston, WV
- County
- Kanawha County · 33,502 people
- City population
- 33,502
- Metro
- Charleston, WV
- Population (ZIP)
- 13,204
- Household income
- $55,210
- Rent vs Own
- Severe rent burden
- 679.0
Population outlook (Kanawha County) Hauer SSP2
- Today (2025)
- 178,946 people
- By 2030
- 172,906 · -3.4%
- By 2040
- 159,874 · -10.7%
- By 2050
- 148,148 · -17.2%
- By 2075
- 123,257 · -31.1%
- By 2100
- 96,454 · -46.1%
Race, ethnicity, and origin ACS 2023
- Neighborhood character
- Predominantly White (75%)
- Race & ethnicity
- White 75% Black 14% Two or more races 8% Hispanic / Latino 3% Asian 1%
- Common ancestry
- Italian 2% Slovak 2% Iranian 1%
- Foreign-born
- 1% · South Korea
Political lean MEDSL · Kanawha
- 2024 margin
- R (+17.4) · D 40.2% · R 57.6% · Other 2.2%
- 2008→2024 swing
- -17.0pp toward R · 2008: -0.4pp · 2024: -17.4pp
- All cycles
- 2024: R+17.4 2020: R+14.7 2016: R+20.6 2012: R+11.9 2008: R+0.4
Not yet ingested
- Civics
- —
Market trends
- HPI YoY
- ▼ -44.83%
- Current HPI
- 160.7081
- Rent YoY
- —
- Metro
- Charleston, WV
- State GDP YoY
- —
- F500 in state
- 0
Price history
+414534.1% since first listed18 events — show timeline
- 2026-04-13 Listed $4,250,000 KVBOR
- 2026-03-29 Rental Removed $1,025 APPFOLIO
- 2026-03-18 Listed for Rent $1,025 APPFOLIO
- 2024-05-11 Rental Removed $800 APPFOLIO
- 2024-05-11 Listed for Rent $800 APPFOLIO
- 2024-04-10 Rental Removed $650 APPFOLIO
- 2024-03-26 Listed for Rent $650 APPFOLIO
- 2024-03-24 Rental Removed $650 APPFOLIO
- 2024-03-18 Listed for Rent $650 APPFOLIO
- 2024-03-13 Rental Removed $650 APPFOLIO
- 2024-03-13 Rental Removed $650 APPFOLIO
- 2024-03-13 Listed for Rent $650 APPFOLIO
- 2024-01-13 Listed for Rent $650 APPFOLIO
- 2024-01-13 Rental Removed $650 APPFOLIO
- 2023-12-23 Listed for Rent $650 APPFOLIO
- 2023-11-28 Rental Removed $750 APPFOLIO
- 2023-11-20 Listed for Rent $750 APPFOLIO
- 2023-06-08 Rental Removed — APPFOLIO
Cash-flow waterfall
monthlySold comps — $/sqft
last 12 mo · ≤1 miLoading sold comps…