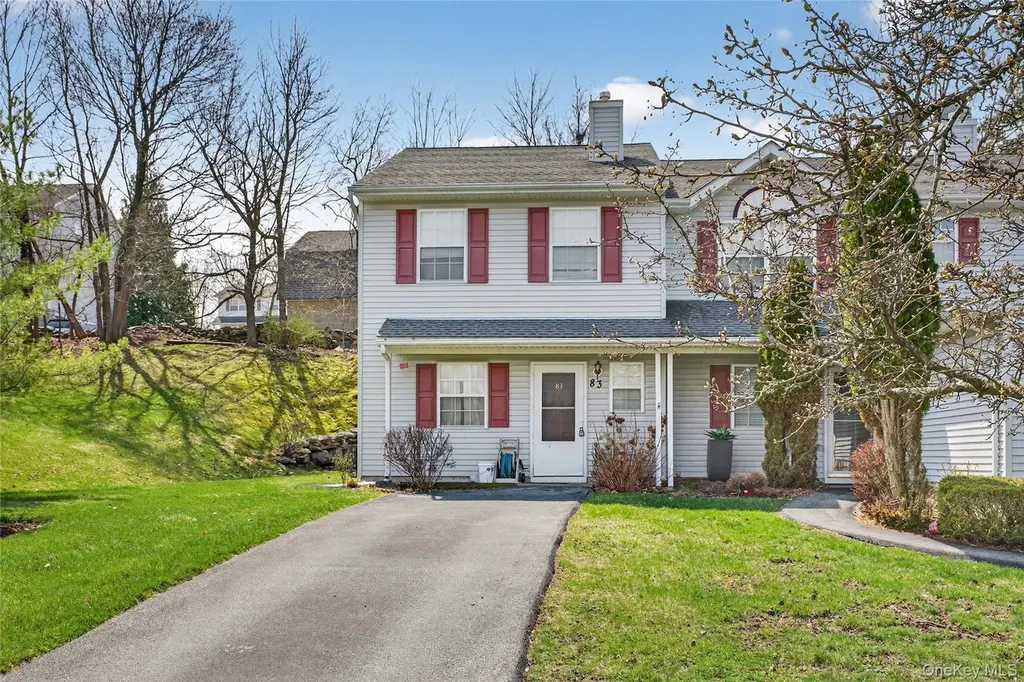
83 Lois Ln · Monroe, NY
Flood risk 1/10 · Minimal
- FEMA flood zone
- X (unshaded)
- Chance of flooding over 30 yrs
- 0.0%
- Est. flood insurance / yr
- $507 – $1,088
Fire risk 4/10 · Minor
- Est. fire insurance / yr
- $691 – $1,283
Heat risk 5/10 · Moderate
- Hot days now (above 97°F)
- 7 days/yr
- Hot days in 30 yrs
- 15 days/yr
Wind risk 4/10 · Minor
- Chance of severe wind over 30 yrs
- 16.0%
Air-quality risk 2/10 · Minimal
- Unhealthy air days now
- 2 days/yr
- Unhealthy air days in 30 yrs
- 2 days/yr
Risk factors via First Street. Map © Google.
Why this score? — see what drove the D grade
The composite is a weighted blend of 9 inputs, each scored 0–100. Each bar is that input's sub-score; the figure is the points it added to the 100-point composite (weight × sub-score).
- ARV discount +15.0/15.0
- Cash flow +7.6/30.0
- Schools +5.0/10.0
- 1% rule +4.0/10.0
- Livability +3.6/5.0
- Rent growth +2.9/5.0
- Condition / age +2.5/5.0
- DSCR +1.7/10.0
- Appreciation +0.0/10.0
$319,999
🖨 Deal sheet (PDF) 📄 Offer letter ✓ Due diligence
Listing remarks MLS
Welcome to 83 Lois Lane in Monroe—an excellent opportunity to own a 2-bedroom condo in a commuter-friendly location. This home features hardwood floors throughout the main level, where an open-concept living and dining area provides a comfortable and functional layout for everyday living and entertaining. Sliding glass doors lead to a private concrete patio, offering a great space for outdoor relaxation. The kitchen is clean and practical, complete with stainless steel appliances and ample cabinet space. A convenient powder room rounds out the first floor. Upstairs, you’ll find two generously sized bedrooms along with a full bathroom, creating a well-designed separation between living and sleeping areas. Ideally located just minutes from the NYS Thruway, this home is perfect for commuters while remaining close to shopping, dining, and everyday conveniences. Walking distance to NYC bus service and a variety of local stores and amenities. A great option for first-time buyers, downsizers, or investors.
Key facts
- $282 HOA
- Built 1995
- Listed 75 days
Neighborhood map
What this means for you Summary
Snapshot
- This is a 2-bed/1.5-bath condo listed at $320k.
Deal economics
- At list price, monthly cash flow is $-381 ($-5k/yr) — negative.
- To cash-flow at today's rent, offer at most $253k (21.0% below list).
- To meet the 1% rule (rent ≥ 1% of price), the offer needs to be $287k (10.2% below list).
- Recommended offer: $253k (21.0% below list) — sets the bar for cash-flow.
- Cap rate 4.9% vs local median 3.3% in Monroe — top-decile yield for the area; either an underpriced asset or a hidden risk that comps aren't pricing in. Stress-test before assuming the spread holds.
Location & tenants
- Location reads 72/100 on livability (#351 in NY) — a middle-class / working-renter tenant base. Strengths: employment A+, housing A+, health & safety A+; Watch: amenities F, commute F, cost of living F.
- Monroe-Woodbury Central School District (suburban): math 50% / reading 56% proficiency, ranked #250 of 590 in NY (top 42%) — acceptable for families but not a draw, mixed tenant base, ~2y average lease; only 15% free/reduced lunch — higher-income household profile.
- Zoned schools: Pine Tree Elementary School (math 43% / reading 48%, grade D-, #1,271 of 2,108 statewide, top 60%, 786 students, 42% FRL); Monroe-Woodbury Middle School (math 28% / reading 50%, grade F, #433 of 729 statewide, top 60%, 1,584 students, 40% FRL); Monroe-Woodbury High School (math 98% / reading 95%, grade A+, #56 of 1,100 statewide, top 5%, 2,353 students, 33% FRL) — zoned schools average 38% FRL vs 15% district-wide (24 pts higher); higher-poverty schools than district average — tighter screening recommended.
- Market conditions: Rents rising (+1.5%/yr); 322 active listings in the ZIP; 8 comparable units currently listed for rent nearby; rentals at typical pace (median 16d on market — plan ~3-4 weeks tenant-placement turnaround); solid renter incomes; 1,746 units permitted in Orange County in 2024 (1,265 in 5+ unit buildings).
- This rent runs 44% of the median local income ($79k/yr) — at the standard rent-burdened threshold; future hikes will face affordability resistance.
Forward outlook
- Local home prices are declining (-3.0%/yr); year-one equity from $2k of loan paydown is wiped out by about $10k of value loss. Plan a longer hold.
Negotiation context
- It's been on market 75 days — a 6% lower offer ($301k) is reasonable based on typical stale-listing flexibility.
Risks & watch-outs
- Climate carrying-cost: extreme-heat days projected 7→15/yr by 2055 (HVAC capex compounding) — expect insurance premiums to compound above CPI over the hold.
Questions for the listing agent
- What do current leases actually rent for vs. the listed asking? Can we see a recent rent roll and the last 12 months of T-12 income?
- It's been on market 75 days. Have you received any prior offers? Is the seller open to a 21% concession, seller financing, or rate buy-down credit?
- What does the HOA fee cover, when was the last increase, and are there any pending special assessments or reserve-fund shortfalls?
- Any open or pending special assessments — roof, HVAC, plumbing, elevator, façade? What's the per-unit balance and payoff schedule, and is the seller paying it off at close or rolling it to the buyer?
- Why hasn't it sold? Are there any deal-killer items the seller is aware of (foundation, flood, title, zoning, code violations)?
- Is there a deadline driving the sale (1031 exchange, divorce, estate, relocation)? That informs how much negotiation room exists.
- Schools are B-rated — typically a magnet for longer-tenancy family renters. What's the average tenant stay here, and is there a school-zone premium baked into asking?
- The area grade is low — what's the realistic commute time and amenity access for the typical tenant pool here? Any planned neighborhood developments (good or bad) we should know about?
- What's the average days-on-market for RENTAL listings here right now (not sales)? A rising rental-DOM trend means longer vacancies and softer asking-rent achievability than the comps imply.
- What's the recent tenant-quality profile in this submarket — average credit score on applications, eviction rate, late-payment / NSF rate, and stable-employment percentage? A property-management company in the area should have these aggregated.
- How much new apartment / multifamily construction is in the pipeline within 1–3 miles? Heavy new supply (>2% of stock underway) typically softens rents 12–24 months out; light construction supports rent growth.
Investment metrics
- 1% rule
- 0.90% ✗
- Cap rate
- 4.86%
- Cash-on-cash
- -5.10%
- DSCR
- 0.77
- GRM
- 9.3
CMA / ARV
- ARV (median comp)
- $396,197
- List price
- $319,999
- Delta
- -19.23%
- Verdict
- UNDERPRICED
- Comps
- 20 within 1.0 mi
Projected returns pro-forma
-3.0% appreciation · 1.5% rent growth · sell at horizon
- IRR
- -26.9%
- Equity multiple
- 0.11×
- Total profit
- $-80,071
- Equity at exit
- $47,713
- IRR
- -31.9%
- Equity multiple
- -0.30×
- Total profit
- $-116,702
- Equity at exit
- $27,668
Cash invested: $89,600 (down + closing). Projections, not guarantees.
Landlord ↔ Tenant lean methodology
- Overall (STATE)
- 15 Strongly Tenant-Friendly
- State New York
- 15 Strongly Tenant-Friendly · D+10
- County
- — inherits STATE
- City
- — inherits STATE
ZIP-level market 10950
- Rents YoY
- 1.5%
- Active inventory
- 322
- Price-to-rent
- 9.3×
Monthly cashflow live
- Estimated rent
- $2,875 high interval (Pro) →
- Mortgage (P&I)
- −$1,678
- Tax from tax record
- −$558 /mo · $6,701/yr
- Insurance
- −$133
- HOA
- −$282
- Vacancy / Maint / Mgmt
- −$604
- Net cashflow
- $-381
Break-even live
Sensitivity live
| Price | -10% $-200 | -5% $-290 | +0% $-381 | +5% $-471 | +10% $-562 |
|---|---|---|---|---|---|
| Rent | -10% $-608 | -5% $-494 | +0% $-381 | +5% $-267 | +10% $-154 |
| Rate | -1.0pp $-220 | -0.5pp $-299 | base $-381 | +0.5pp $-464 | +1.0pp $-548 |
UW: 25.0% down · 7.5% · 30yr · 1.5% tax · 5.0% vac · 8.0% maint · 8.0% mgmt
Financing live
Cash to close
- Down payment
- $80,000
- Closing costs
- $9,600
- Reserves months
- —
- Total cash needed
- —
Loan-product check · same deal, 3 products live
Conventional
25% down · 7.5% · 30yr
- Down + closing
- —
- Monthly P&I
- —
- Monthly cashflow
- —
- DSCR
- —
- Eligible?
- —
Personal DTI + credit; lowest rate.
DSCR
20% down · 8.5% · 30yr
- Down + closing
- —
- Monthly P&I
- —
- Monthly cashflow
- —
- DSCR
- —
- Eligible?
- —
No personal income docs; deal must DSCR.
Hard money
10% down · 12.0% · 12mo
- Down + closing
- —
- Monthly P&I
- —
- Monthly cashflow
- —
- DSCR
- —
- Eligible?
- —
Short-term bridge; refi at stabilization.
Rent comps 8 comps
| Address | Beds | Baths | Sqft | Rent | $/sqft | DOM | Units | Dist |
|---|---|---|---|---|---|---|---|---|
| 50 Bonney Ct Unit 50 Monroe, NY | 2.0 | 2.0 | 1235 | $2,900 | $2.35 | 25d | 1 | 0.26mi |
| 15 Forshee St Monroe, NY | 2.0 | 1.0 | 983 | $3,000 | $3.05 | 15d | 1 | 0.39mi |
| 5 Lexington Hl #7 Harriman, NY | 2.0 | 2.0 | 950 | $2,300 | $2.42 | 15d | 1 | 0.91mi |
| 13 Lake St Unit 205 Monroe, NY | 3.0 | 1.0 | 1200 | $2,600 | $2.17 | 15d | 1 | 0.97mi |
| 23 Lexington Hl #7 Harriman, NY | 2.0 | 2.0 | 950 | $2,350 | $2.47 | 15d | 1 | 1.04mi |
| 25 Lexington Hl #7 Harriman, NY | 2.0 | 2.0 | 950 | $2,400 | $2.53 | 45d | 1 | 1.06mi |
| 157 State Route 17M Harriman, NY | 3.0 | 1.5 | 1152 | $3,000 | $2.60 | 15d | 1 | 1.16mi |
| 16 N Main St Unit 2 Harriman, NY | 2.0 | 1.0 | 840 | $2,200 | $2.62 | 15d | 1 | 1.48mi |
HOA detail condo
- Monthly dues
- $282 · $3,384/yr
- Assessments
- None detected in remarks — confirm with the listing agent.
Listing history 19 events
-
2026-06-21days on market $319,999 Active 75 DOM
-
2026-06-18days on market $319,999 Active 72 DOM
-
2026-06-17days on market $319,999 Active 71 DOM
-
2026-06-16days on market $319,999 Active 70 DOM
-
2026-06-15pricedays on market $319,999 Active 69 DOM
-
2026-06-14days on market $329,999 Active 67 DOM
-
2026-06-10days on market $329,999 Active 64 DOM
-
2026-06-09days on market $329,999 Active 63 DOM
-
2026-06-08days on market $329,999 Active 62 DOM
-
2026-06-07days on market $329,999 Active 61 DOM
-
2026-06-05days on market $329,999 Active 58 DOM
-
2026-06-03days on market $329,999 Active 57 DOM
-
2026-06-02days on market $329,999 Active 56 DOM
-
2026-06-01days on market $329,999 Active 55 DOM
-
2026-05-31days on market $329,999 Active 54 DOM
-
2026-05-30days on market $329,999 Active 53 DOM
-
2026-05-11price $329,999 1029-char remark
Show marketing remark (1029 chars)
Welcome to 83 Lois Lane in Monroe—an excellent opportunity to own a 2-bedroom condo in a commuter-friendly location. This home features hardwood floors throughout the main level, where an open-concept living and dining area provides a comfortable and functional layout for everyday living and entertaining. Sliding glass doors lead to a private concrete patio, offering a great space for outdoor relaxation. The kitchen is clean and practical, complete with stainless steel appliances and ample cabinet space. A convenient powder room rounds out the first floor. Upstairs, you’ll find two generously sized bedrooms along with a full bathroom, creating a well-designed separation between living and sleeping areas. Ideally located just minutes from the NYS Thruway, this home is perfect for commuters while remaining close to shopping, dining, and everyday conveniences. Walking distance to NYC bus service and a variety of local stores and amenities. A great option for first-time buyers, downsizers, or investors.
-
2026-04-06$339,999 Active 1029-char remark
Show marketing remark (1029 chars)
Welcome to 83 Lois Lane in Monroe—an excellent opportunity to own a 2-bedroom condo in a commuter-friendly location. This home features hardwood floors throughout the main level, where an open-concept living and dining area provides a comfortable and functional layout for everyday living and entertaining. Sliding glass doors lead to a private concrete patio, offering a great space for outdoor relaxation. The kitchen is clean and practical, complete with stainless steel appliances and ample cabinet space. A convenient powder room rounds out the first floor. Upstairs, you’ll find two generously sized bedrooms along with a full bathroom, creating a well-designed separation between living and sleeping areas. Ideally located just minutes from the NYS Thruway, this home is perfect for commuters while remaining close to shopping, dining, and everyday conveniences. Walking distance to NYC bus service and a variety of local stores and amenities. A great option for first-time buyers, downsizers, or investors.
-
2006-09-22soldstatus $280,000
ⓘ Source: listings_history table (triggers on properties + properties_extension) + one-shot
backfill from property_details.listing_events for pre-trigger history.
Tax reassessment forecast NY · Partial reset (capped growth)
- Current annual tax
- $6,701 · $558/mo
- Projected year-2 tax
- $6,701 · $558/mo
- Expected delta
- $0/yr ($0/mo · -0.0%)
ⓘ Screening estimate from a state-policy table — verify with the county assessor before closing.
Climate risk First Street
- Flood 1/10 Low FEMA zone X (unshaded) · 0% chance over 30 yrs
- Wildfire 4/10 Moderate
- Heat 5/10 Major 7 d/yr ≥97°F today · 15 d/yr by 30 yrs out
- Wind 4/10 Moderate 16% chance of damaging wind over 30 yrs
- Air quality 2/10 Low 2 unhealthy d/yr today · 2 by 30 yrs out
Nearby sold comps map
Loading sold comps map…
Walkable amenities ~0.75 mi
Loading nearby amenities…
Taxation est. · year 1
- Rental income
- $34,496
- − Mortgage interest
- −$17,925
- − Property taxes
- −$6,701
- − Insurance
- −$1,600
- − Repairs & maintenance
- −$2,760
- − Management
- −$2,760
- − HOA
- −$3,384
- − Depreciation
- −$9,309
- Taxable loss
- −$9,942
- Est. tax savings @ 24.0%
- +$2,386
- After-tax cash flow
- $-2,184/yr
For passive investors: Depreciation is non-cash, so a rental often shows a tax loss while cash-flowing — sheltering income. Rental losses are passive: they offset passive income freely, and up to $25,000/yr can offset ordinary (W-2) income if you actively participate and your MAGI is under $100k (phasing out to $0 by $150k); unused losses carry forward. On sale, claimed depreciation is recaptured at up to 25%, and gains may owe capital-gains tax (a 1031 exchange can defer both). Figures are a year-1 estimate at your 24.0% rate — not tax advice; consult a CPA.
Schools (NCES district)
- District
- Monroe-Woodbury Central School District
- NCES district ID
- 3619650
- Math proficiency
- 50% ▼ -17.00%
- Reading proficiency
- 56% ▼ -1.00%
- Median HH income
- $104,681
- Composite
- 50.48/100
- National rank
- #1855
- State rank
- #250 of 590 in NY
Livability — Monroe
- Score
- 72/100
- State rank
- #351
- US rank
- #5919
Category grades
Schools grade is shown separately in the Schools card above.
Census & demographics
- Census place
- Monroe, NY
- County
- Orange County · 267,004 people
- City population
- 68,136
- Metro
- Poughkeepsie-Newburgh-Middletown, NY
- Population (ZIP)
- 68,136
- Household income
- $78,931
- Rent vs Own
- Severe rent burden
- 3149.0
Population outlook (Orange County) Hauer SSP2
- Today (2025)
- 379,830 people
- By 2030
- 378,955 · -0.2%
- By 2040
- 375,444 · -1.2%
- By 2050
- 369,311 · -2.8%
- By 2075
- 354,233 · -6.7%
- By 2100
- 318,150 · -16.2%
Race, ethnicity, and origin ACS 2023
- Neighborhood character
- Predominantly White (81%)
- Race & ethnicity
- White 81% Hispanic / Latino 12% Two or more races 6% Black 3% Asian 1%
- Hispanic origin (detail)
- Puerto Rican 5% Dominican 2%
- Common ancestry
- Romanian 3% Scandinavian 2% Italian 2%
- Foreign-born
- 11% · Canada, Dominican Republic
- Languages at home
- 33% English-only · German/W. Germanic 52% Spanish 9% Russian/Polish/Slavic 1%
Political lean MEDSL · Orange
- 2024 margin
- Lean R (+8.4) · D 45.8% · R 54.2%
- 2008→2024 swing
- -12.5pp toward R · 2008: 4.1pp · 2024: -8.4pp
- All cycles
- 2024: R+8.4 2020: R+0.2 2016: R+6.5 2012: D+5.2 2008: D+4.1
Not yet ingested
- Civics
- —
Market trends
- HPI YoY
- ▼ -309.81%
- Current HPI
- 314.2081
- Rent YoY
- ▲ 1.50%
- Metro
- Poughkeepsie-Newburgh-Middletown, NY
- State GDP YoY
- ▲ 2.60%
- F500 in state
- 92
Industry mix (Fortune 500 HQ in NY)
| Industry | F500 HQs | Revenue |
|---|---|---|
| Financial Services | 10 | $950B |
|
||
| Consumer Goods | 9 | $162B |
|
||
| Insurance | 4 | $225B |
|
||
| Telecommunications | 2 | $144B |
|
||
| Pharmaceuticals | 2 | $112B |
|
||
| Media / Entertainment | 2 | $69B |
|
||
Price history
+17.9% since first listed3 events — show timeline
- 2026-05-11 Price Changed $329,999 OneKey® MLS as Distributed by MLS Grid
- 2026-04-06 Listed $339,999 OneKey® MLS as Distributed by MLS Grid
- 2006-09-22 Sold (Public Records) $280,000 Public Records
Property tax history
+2.9%/yrLatest (2025): $6,701 · +2.0% YoY. Source: county tax records.
Cash-flow waterfall
monthlySold comps — $/sqft
last 12 mo · ≤1 miLoading sold comps…