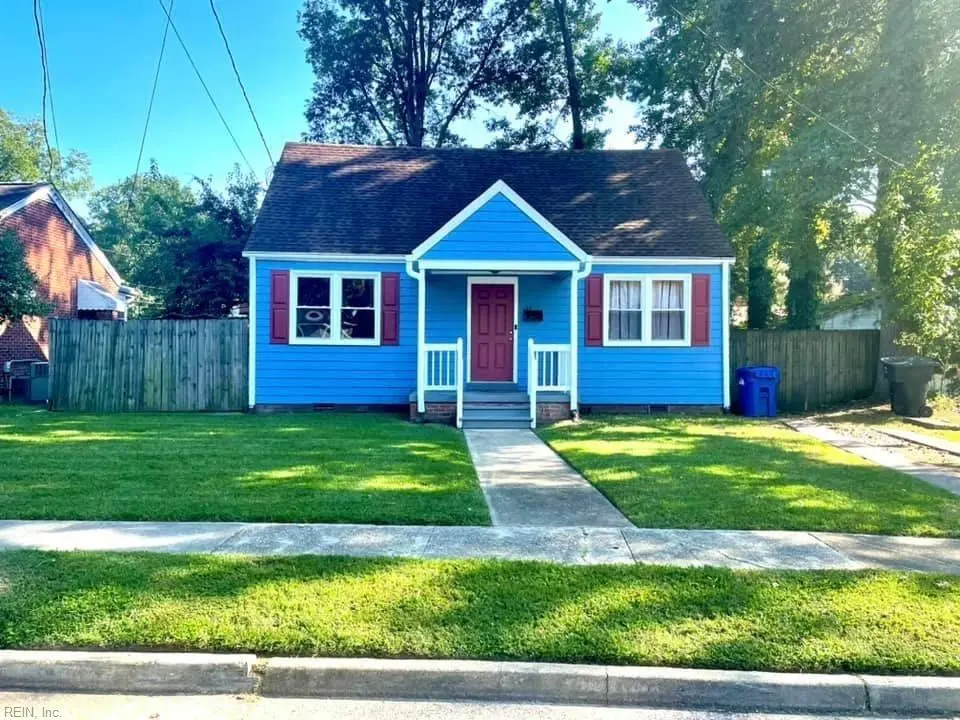
108 Channing Ave · Portsmouth, VA
Flood risk 5/10 · Moderate
- FEMA flood zone
- AE
- Chance of flooding over 30 yrs
- 0.47%
- Est. flood insurance / yr
- $1,737 – $8,500
Fire risk 1/10 · Minimal
- Est. fire insurance / yr
- $666 – $1,236
Heat risk 9/10 · Severe
- Hot days now (above 106°F)
- 7 days/yr
- Hot days in 30 yrs
- 16 days/yr
Wind risk 8/10 · Major
- Chance of severe wind over 30 yrs
- 80.0%
Air-quality risk 5/10 · Moderate
- Unhealthy air days now
- 6 days/yr
- Unhealthy air days in 30 yrs
- 7 days/yr
Risk factors via First Street. Map © Google.
Why this score? — see what drove the B grade
The composite is a weighted blend of 9 inputs, each scored 0–100. Each bar is that input's sub-score; the figure is the points it added to the 100-point composite (weight × sub-score).
- Cash flow +21.6/30.0
- ARV discount +15.0/15.0
- Appreciation +10.0/10.0
- DSCR +6.9/10.0
- 1% rule +5.2/10.0
- Schools +3.9/10.0
- Livability +3.7/5.0
- Rent growth +3.5/5.0
- Condition / age +2.5/5.0
$250,000
🖨 Deal sheet 📄 Offer letter ✓ Due diligence
Listing remarks
Welcome to 108 Channing Avenue! This adorable, updated Cape Cod home is located in the heart of Portsmouth's Cradock Neighborhood and it's move-in ready. 3 bedrooms downstairs, 2 bedrooms/office/bonus rooms located upstairs. The backyard is fenced and there's a large shed. Convenient to interstates, military installations, the shipyard, shopping, and dining.
Key facts
- Move-in ready
- Large shed
- Fenced backyard
Tags
Property features AI
Finance
- HOA & community: No HOA fees
Exterior
- Parking: Driveway spaces; On-street parking
- Utilities: City/County water; City/County sewer; Electric water heater
- Home design: Detached single-family home; Cape Cod style; 2 stories; Two living levels; Crawl foundation
- Construction: Shingle exterior; Asphalt shingle roof; Crawl space foundation
- Exterior features: Shingle siding; Back yard with wood fence; Has fence; Asphalt shingle roof
Interior
- Kitchen: Electric range; Refrigerator; Breakfast area
- Bedrooms: First-floor master bedroom; Additional bedroom(s)
- Flooring: Carpet; Vinyl; Wood
- Bathrooms: One full bathroom (first floor)
- Heating & cooling: Two-zone central air; Baseboard heating; Forced hot air; Two-zone heating
- Interior features: Cable hookup; Ceiling fan; Window treatments
- Laundry & utility: Washer hookup; Dryer hookup; Utility room; Assigned storage; Attic
Neighborhood map
What this means for you Summary
Snapshot
- This is a 5-bed/1.0-bath single-family listed at $250k.
Deal economics
- At list price, monthly cash flow is $-47 ($-565/yr) — negative.
- To cash-flow at today's rent, offer at most $242k (3.3% below list).
- Meets the 1% rule at list price ($3k rent vs $250k).
- Recommended offer: $242k (3.3% below list) — sets the bar for cash-flow.
- Cap rate 8.1% vs local median 4.6% in Portsmouth — top-decile yield for the area; either an underpriced asset or a hidden risk that comps aren't pricing in. Stress-test before assuming the spread holds.
Location & tenants
- Location reads 73/100 on livability (#172 in VA) — a middle-class / working-renter tenant base. Strengths: amenities A+, cost of living A+, housing A+; Watch: employment C-, crime F, commute F.
- Portsmouth City Public School District (urban): math 34% / reading 58% proficiency, ranked #107 of 131 in VA (top 82%) — families likely to look elsewhere, expect single-tenant / working-renter base with shorter leases.
- Market conditions: Rents rising (+4.0%/yr); 64 active listings in the ZIP; 2 comparable units currently listed for rent nearby; 300 units permitted in Portsmouth city in 2024 (112 in 5+ unit buildings).
- At $2,543/mo this rent would consume 62% of the median local household income ($49k/yr) (locally 534% of renters already pay >50% of income on rent) — very limited rent-growth headroom before tenants either downsize or default.
Forward outlook
- In year one you build about $27k of equity ($2k loan paydown + $25k appreciation (10.0% local appreciation)).
- At projected returns (10.0% appreciation + 4.0% rent growth), your $70k cash investment doubles in ~3 years — after that, you're playing with house money.
- By year 2, paydown + projected appreciation supports a ~$43k cash-out refi (75% LTV) — recoverable capital for the next deal without selling this one.
Negotiation context
- Only 5 days on market — expect competitive offers; lowballing is unlikely to land.
- 2 sale attempts since 5y ago with the ask held roughly flat each time — persistent listings suggest the price (not the market) is what's stuck; bring a comps-based counter.
- Current owner paid $160k; list at $250k implies a 56% gain — meaningful room to come down on a strong offer.
Risks & watch-outs
- Watch-outs: flood insurance adds $427/mo; built in 1951 — expect roof / HVAC / electrical / plumbing capex.
- Climate carrying-cost: in FEMA flood zone AE (mandatory federal flood insurance); severe wind risk, 80% chance of damaging wind over 30y; extreme-heat days projected 7→16/yr by 2055 (HVAC capex compounding) — expect insurance premiums to compound above CPI over the hold.
Questions for the listing agent
- What do current leases actually rent for vs. the listed asking? Can we see a recent rent roll and the last 12 months of T-12 income?
- Built in 1951 — when were the roof, HVAC, electrical panel, plumbing, and water heater last replaced?
- What's the actual annual flood-insurance premium (NFIP or private), and is the property in a SFHA with mandatory coverage?
- Is there a deadline driving the sale (1031 exchange, divorce, estate, relocation)? That informs how much negotiation room exists.
- Schools are B-rated — typically a magnet for longer-tenancy family renters. What's the average tenant stay here, and is there a school-zone premium baked into asking?
- Crime grade is F in this area — have there been break-ins, vandalism, or insurance claims at this property in the last 3 years? What carrier currently insures it and at what premium?
- What's the average days-on-market for RENTAL listings here right now (not sales)? A rising rental-DOM trend means longer vacancies and softer asking-rent achievability than the comps imply.
- What's the recent tenant-quality profile in this submarket — average credit score on applications, eviction rate, late-payment / NSF rate, and stable-employment percentage? A property-management company in the area should have these aggregated.
- How much new for-sale + rental construction is in the pipeline within 1–3 miles? Heavy new supply typically softens prices + rents 12–24 months out; constrained supply supports both.
Investment metrics
- 1% rule
- 1.02% ✓
- Cap rate
- 8.11%
- Cash-on-cash
- 6.51%
- DSCR
- 1.29
- GRM
- 8.2
CMA / ARV
- ARV (on-the-fly)
- $300,672
- Comps found
- 12
Show comp detail 12 sales within ~0.75 mi
| Address | Dist | Beds/Ba | Sqft | Sold | Price | $/sf | Match |
|---|---|---|---|---|---|---|---|
| 83 Channing Ave | 0.15mi | 4/3.0 (-1) | 1,721 (-0%) | 1mo | $307,500 | $179 | 79 |
| 13 Kennedy Dr | 0.30mi | 4/2.0 (-1) | 1,682 (-3%) | 1mo | $298,000 | $177 | 72 |
| 45 Prospect Pkwy | 0.37mi | 4/3.5 (-1) | 1,750 (+1%) | 2mo | $302,000 | $173 | 64 |
| 16 Prospect Pkwy | 0.38mi | 4/2.0 (-1) | 1,689 (-2%) | 8mo | $287,000 | $170 | 63 |
| 27 Afton Pkwy | 0.45mi | 4/2.0 (-1) | 1,631 (-6%) | 1mo | $309,000 | $189 | 60 |
| 27 Aylwin Rd | 0.58mi | 4/2.0 (-1) | 1,737 (+0%) | 4mo | $229,000 | $132 | 59 |
| 25 Cushing St | 0.51mi | 4/2.5 (-1) | 1,802 (+4%) | 1mo | $310,000 | $172 | 57 |
| 50 Cushing St | 0.46mi | 4/3.0 (-1) | 1,782 (+3%) | 5mo | $328,500 | $184 | 56 |
| 28 Alden Ave | 0.40mi | 5/2.5 | 1,936 (+12%) | 2mo | $205,000 | $106 | 54 |
| 17 Davis St | 0.53mi | 4/2.0 (-1) | 1,900 (+10%) | 1mo | $330,000 | $174 | 49 |
| 103 Good Hope Ln | 0.67mi | 4/2.5 (-1) | 1,680 (-3%) | 9mo | $367,000 | $218 | 46 |
| 311 Hanbury Ave | 0.75mi | 4/2.0 (-1) | 1,970 (+14%) | 4mo | $300,000 | $152 | 29 |
Match score weights: distance 35% · size 25% · config 20% · recency 20%. Top-matched comps best support the ARV.
Projected returns pro-forma
10.0% appreciation · 3.97% rent growth · sell at horizon
- IRR
- 24.1%
- Equity multiple
- 2.94×
- Total profit
- $135,906
- Equity at exit
- $225,220
- IRR
- 21.7%
- Equity multiple
- 6.83×
- Total profit
- $408,345
- Equity at exit
- $485,695
Cash invested: $70,000 (down + closing). Projections, not guarantees.
Landlord ↔ Tenant lean methodology
- Overall (STATE)
- 55 Moderately Landlord-Leaning
- State Virginia
- 55 Moderately Landlord-Leaning · D+2
- County
- — inherits STATE
- City
- — inherits STATE
ZIP-level market 23702
- Home prices YoY
- 5.2%
- Rents YoY
- 4.0%
- Active inventory
- 64
- Price-to-rent
- 8.2×
Monthly cashflow live
- Estimated rent
- $2,543 medium interval (Pro) →
- Mortgage (P&I)
- −$1,311
- Tax from tax record
- −$214 /mo · $2,571/yr
- Insurance
- −$104
- Flood insurance flood zone
- −$427 /mo · $5,118/yr
- HOA
- −$0
- Vacancy / Maint / Mgmt
- −$534
- Net cashflow
- $-47
Break-even live
UW: 25.0% down · 7.5% · 30yr · 1.5% tax · 5.0% vac · 8.0% maint · 8.0% mgmt
Financing live
Cash to close
- Down payment
- $62,500
- Closing costs
- $7,500
- Reserves months
- —
- Total cash needed
- —
Loan-product check · same deal, 3 products live
Conventional
25% down · 7.5% · 30yr
- Down + closing
- —
- Monthly P&I
- —
- Monthly cashflow
- —
- DSCR
- —
- Eligible?
- —
Personal DTI + credit; lowest rate.
DSCR
20% down · 8.5% · 30yr
- Down + closing
- —
- Monthly P&I
- —
- Monthly cashflow
- —
- DSCR
- —
- Eligible?
- —
No personal income docs; deal must DSCR.
Hard money
10% down · 12.0% · 12mo
- Down + closing
- —
- Monthly P&I
- —
- Monthly cashflow
- —
- DSCR
- —
- Eligible?
- —
Short-term bridge; refi at stabilization.
Rent comps 2 comps
| Address | Beds | Baths | Sqft | Rent | $/sqft | DOM | Units | Dist |
|---|---|---|---|---|---|---|---|---|
| 35 Fairview Cir S Portsmouth, VA | 4.0 | 1.5 | 1462 | $2,100 | $1.44 | 12d | 1 | 1.21mi |
| 1061 Saint Julian Dr Chesapeake, VA | 4.0 | 2.0 | 1611 | $2,550 | $1.58 | 23d | 1 | 1.41mi |
Listing history 9 events
-
2026-06-02status $250,000 Under Contract 5 DOM
-
2026-06-01days on market $250,000 Active 5 DOM
-
2026-05-31days on market $250,000 Active 4 DOM
-
2026-05-26$250,000 Active
-
2021-04-13soldstatus $160,000
-
2021-03-09status Under Contract
-
2021-02-22historical Active Under Contract
-
2021-02-04price $175,000
-
2021-01-26$179,900 Active
ⓘ Source: listings_history table (triggers on properties + properties_extension) + one-shot
backfill from property_details.listing_events for pre-trigger history.
Tax reassessment forecast VA · Resets to sale price
- Current annual tax
- $2,571 · $214/mo
- Projected year-2 tax
- $2,571 · $214/mo
- Expected delta
- $0/yr ($0/mo · 0.0%)
ⓘ Screening estimate from a state-policy table — verify with the county assessor before closing.
Climate risk First Street
- Flood 5/10 Major FEMA zone AE · 47% chance over 30 yrs
- Wildfire 1/10 Low
- Heat 9/10 Extreme 7 d/yr ≥106°F today · 16 d/yr by 30 yrs out
- Wind 8/10 Severe 80% chance of damaging wind over 30 yrs
- Air quality 5/10 Major 6 unhealthy d/yr today · 7 by 30 yrs out
Nearby sold comps map
Loading sold comps map…
Walkable amenities ~0.75 mi
Loading nearby amenities…
Taxation est. · year 1
- Rental income
- $30,515
- − Mortgage interest
- −$14,004
- − Property taxes
- −$2,571
- − Insurance
- −$6,368
- − Repairs & maintenance
- −$2,441
- − Management
- −$2,441
- − Depreciation
- −$7,273
- Taxable loss
- −$4,583
- Est. tax savings @ 24.0%
- +$1,100
- After-tax cash flow
- $535/yr
For passive investors: Depreciation is non-cash, so a rental often shows a tax loss while cash-flowing — sheltering income. Rental losses are passive: they offset passive income freely, and up to $25,000/yr can offset ordinary (W-2) income if you actively participate and your MAGI is under $100k (phasing out to $0 by $150k); unused losses carry forward. On sale, claimed depreciation is recaptured at up to 25%, and gains may owe capital-gains tax (a 1031 exchange can defer both). Figures are a year-1 estimate at your 24.0% rate — not tax advice; consult a CPA.
Schools (NCES district)
- District
- Portsmouth City Public School District
- NCES district ID
- 5103000
- Math proficiency
- 34% ▼ -40.00%
- Reading proficiency
- 58% ▼ -12.00%
- Median HH income
- $46,152
- Composite
- 39.01/100
- National rank
- #4071
- State rank
- #107 of 131 in VA
Livability — Portsmouth
- Score
- 73/100
- State rank
- #172
- US rank
- #5381
Category grades
Schools grade is shown separately in the Schools card above.
Census & demographics
- Census place
- Portsmouth, VA
- County
- Portsmouth City · 96,366 people
- City population
- 96,366
- Metro
- Virginia Beach-Norfolk-Newport News, VA-NC
- Population (ZIP)
- 12,485
- Household income
- $48,835
- Rent vs Own
- Severe rent burden
- 534.0
Population outlook (Portsmouth County) Hauer SSP2
- Today (2025)
- 96,730 people
- By 2030
- 96,760 · +0.0%
- By 2040
- 96,573 · -0.2%
- By 2050
- 95,606 · -1.2%
- By 2075
- 93,579 · -3.3%
- By 2100
- 83,756 · -13.4%
Race, ethnicity, and origin ACS 2023
- Neighborhood character
- Diverse neighborhood (Simpson 0.62)
- Race & ethnicity
- Black 50% White 35% Two or more races 9% Hispanic / Latino 8%
- Hispanic origin (detail)
- Mexican 2% Puerto Rican 3%
- Common ancestry
- Lithuanian 1% Italian 1% Slovak 1%
- Foreign-born
- 4% · Canada, South Korea
- Languages at home
- 95% English-only · Spanish 4%
Political lean MEDSL · Portsmouth
- 2024 margin
- Solid D (+38.6) · D 68.6% · R 30.0% · Other 1.4%
- 2008→2024 swing
- -0.7pp no change · 2008: 39.3pp · 2024: 38.6pp
- All cycles
- 2024: D+38.6 2020: D+40.8 2016: D+36.5 2012: D+39.6 2008: D+39.3
Not yet ingested
- Civics
- —
Market trends
- HPI YoY
- ▲ 16.70%
- Current HPI
- 340.0817
- Rent YoY
- ▲ 3.97%
- Metro
- Virginia Beach-Norfolk-Newport News, VA-NC
- State GDP YoY
- ▲ 2.40%
- F500 in state
- 50
Industry mix (Fortune 500 HQ in VA)
| Industry | F500 HQs | Revenue |
|---|---|---|
| Aerospace / Defense | 4 | $236B |
|
||
| Technology / Defense | 3 | $32B |
|
||
| Financial Services | 2 | $176B |
|
||
| Utilities | 2 | $27B |
|
||
| Insurance | 2 | $25B |
|
||
| Technology | 2 | $15B |
|
||
Price history
+39.0% since first listed6 events — show timeline
- 2026-05-26 Listed $250,000 REINMLS
- 2021-04-13 Sold (Public Records) $160,000 Public Records
- 2021-03-09 Pending — REINMLS
- 2021-02-22 Contingent — REINMLS
- 2021-02-04 Price Changed $175,000 REINMLS
- 2021-01-26 Listed $179,900 REINMLS
Property tax history
+4.0%/yrLatest (2025): $2,571 · +1.3% YoY. Source: county tax records.
Cash-flow waterfall
monthlySold comps — $/sqft
last 12 mo · ≤1 miLoading sold comps…