3 Pike Rd · Winthrop, NY
Flood risk 1/10 · Minimal
- FEMA flood zone
- X
- Chance of flooding over 30 yrs
- 0.0%
- Est. flood insurance / yr
- $507 – $1,088
Fire risk 2/10 · Minimal
- Est. fire insurance / yr
- $691 – $1,283
Heat risk 2/10 · Minimal
- Hot days now (above 94°F)
- 7 days/yr
- Hot days in 30 yrs
- 15 days/yr
Wind risk 1/10 · Minimal
- Chance of severe wind over 30 yrs
- —
Air-quality risk 1/10 · Minimal
- Unhealthy air days now
- 0 days/yr
- Unhealthy air days in 30 yrs
- 0 days/yr
Risk factors via First Street. Map © Google.
Why this score? — see what drove the B+ grade
The composite is a weighted blend of 9 inputs, each scored 0–100. Each bar is that input's sub-score; the figure is the points it added to the 100-point composite (weight × sub-score).
- Cash flow +30.0/30.0
- 1% rule +10.0/10.0
- DSCR +10.0/10.0
- ARV discount +7.5/15.0
- Appreciation +7.1/10.0
- Schools +3.5/10.0
- Livability +2.9/5.0
- Rent growth +2.5/5.0
- Condition / age +2.5/5.0
$45,000
🖨 Deal sheet 📄 Offer letter ✓ Due diligence
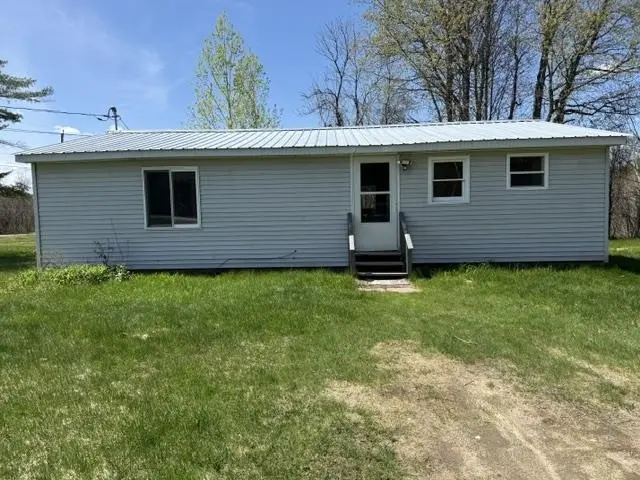
Listing remarks
Check out 3 Pike Road in Brasher Falls! This single family home has 2 bedrooms and 1 bathroom located on the corner of Mahoney Road and Pike Road. The home sits on 1.9 acres of land to offer a nice yard for gatherings. When you walk into the home you are greeted by the kitchen with plenty of natural light and cupboards. From the kitchen you move into the living room which also adds a lot of natural light. There are two bedrooms and a full bath with laundry hookup. Recent updates ~ hot water heater - 1 year ago, Stove and refrigerator - 2 years old, septic system was all replaced in 2018 with a 1,000 gallon tank with new leach field and was pumped last year. There is a shed on the property
Key facts
- Recent updates
- Hot water heater
- 1.9 acres of land
Tags
Property features AI
Finance
- Other: Lot size approximately 1.9 acres
Exterior
- Utilities: Private well water; Septic tank; Cable available
- Home design: Residential property; Single-story
- Construction: Vinyl siding
- Exterior features: Metal roof; Level lot; Publicly maintained road; Irregular lot shape
Interior
- Kitchen: Electric cooktop; Refrigerator
- Bedrooms: Total rooms: 5
- Flooring: Carpet; Vinyl
- Bathrooms: 1 full bathroom
- Heating & cooling: Electric heating; Ceiling fan(s)
- Interior features: Electric water heater; Electric cooktop; Refrigerator
- Laundry & utility: Electric water heater
Neighborhood map
What this means for you Summary
Snapshot
- This is a 2-bed/1.0-bath single-family listed at $45k.
Deal economics
- At list price, monthly cash flow is $364 ($4k/yr) — positive.
- The deal already cash-flows at list — no discount required.
- Meets the 1% rule at list price ($984 rent vs $45k).
- Recommended offer: $44k (1.5% below list) — sets the bar for market timing.
Location & tenants
- Location reads 58/100 on livability (#1,067 in NY) — a working-class tenant base; expect higher turnover. Strengths: cost of living A+, housing A+, crime A; Watch: health & safety C-, schools D-, amenities F.
- Brasher Falls Central School District (rural): math 39% / reading 45% proficiency, ranked #499 of 590 in NY (top 85%) — families likely to look elsewhere, expect single-tenant / working-renter base with shorter leases.
- Market conditions: 25 active listings in the ZIP; 215 units permitted in St. Lawrence County in 2024 (0 in 5+ unit buildings).
Forward outlook
- In year one you build about $2k of equity ($311 loan paydown + $2k appreciation (4.2% local appreciation)).
- St. Lawrence County population projected at -14% by 2050 — secular population decline; favor cash flow + early exit over multi-decade hold.
- At projected returns (4.2% appreciation + 3.0% rent growth), your $13k cash investment doubles in ~2 years — after that, you're playing with house money.
Negotiation context
- It's been on market 16 days — a 2% lower offer ($44k) is reasonable based on typical stale-listing flexibility.
- 2 sale attempts; this cycle's ask has dropped $29k (39%) from the opening price — seller is motivated, your offer sets the floor, not the list.
- Current owner paid $25k; list at $45k implies a 80% gain — meaningful room to come down on a strong offer.
Risks & watch-outs
- Watch-outs: property tax is 4.2% of price.
Questions for the listing agent
- Property tax is high relative to price — has the assessment been appealed recently, and will the sale trigger a re-assessment?
- Is there a deadline driving the sale (1031 exchange, divorce, estate, relocation)? That informs how much negotiation room exists.
- Schools are D-rated, which usually means shorter tenancies and higher turnover. Who's the typical renter profile here, and what's been the actual vacancy rate?
- What's the average days-on-market for RENTAL listings here right now (not sales)? A rising rental-DOM trend means longer vacancies and softer asking-rent achievability than the comps imply.
- What's the recent tenant-quality profile in this submarket — average credit score on applications, eviction rate, late-payment / NSF rate, and stable-employment percentage? A property-management company in the area should have these aggregated.
- How much new for-sale + rental construction is in the pipeline within 1–3 miles? Heavy new supply typically softens prices + rents 12–24 months out; constrained supply supports both.
Investment metrics
- 1% rule
- 2.19% ✓
- Cap rate
- 16.00%
- Cash-on-cash
- 34.66%
- DSCR
- 2.54
- GRM
- 3.8
CMA / ARV
No comps found within radius.
Projected returns pro-forma
4.19% appreciation · 3.0% rent growth · sell at horizon
- IRR
- 42.3%
- Equity multiple
- 3.51×
- Total profit
- $31,577
- Equity at exit
- $23,316
- IRR
- 41.0%
- Equity multiple
- 7.08×
- Total profit
- $76,639
- Equity at exit
- $38,541
Cash invested: $12,600 (down + closing). Projections, not guarantees.
Landlord ↔ Tenant lean methodology
- Overall (STATE)
- 15 Strongly Tenant-Friendly
- State New York
- 15 Strongly Tenant-Friendly · D+10
- County
- — inherits STATE
- City
- — inherits STATE
ZIP-level market 13613
- Home prices YoY
- 1.4%
- Active inventory
- 25
- Price-to-rent
- 3.8×
Monthly cashflow live
- Estimated rent
- $984 medium interval (Pro) →
- Mortgage (P&I)
- −$236
- Tax from tax record
- −$158 /mo · $1,899/yr
- Insurance
- −$19
- HOA
- −$0
- Vacancy / Maint / Mgmt
- −$207
- Net cashflow
- $364
Break-even live
UW: 25.0% down · 7.5% · 30yr · 1.5% tax · 5.0% vac · 8.0% maint · 8.0% mgmt
Financing live
Cash to close
- Down payment
- $11,250
- Closing costs
- $1,350
- Reserves months
- —
- Total cash needed
- —
Loan-product check · same deal, 3 products live
Conventional
25% down · 7.5% · 30yr
- Down + closing
- —
- Monthly P&I
- —
- Monthly cashflow
- —
- DSCR
- —
- Eligible?
- —
Personal DTI + credit; lowest rate.
DSCR
20% down · 8.5% · 30yr
- Down + closing
- —
- Monthly P&I
- —
- Monthly cashflow
- —
- DSCR
- —
- Eligible?
- —
No personal income docs; deal must DSCR.
Hard money
10% down · 12.0% · 12mo
- Down + closing
- —
- Monthly P&I
- —
- Monthly cashflow
- —
- DSCR
- —
- Eligible?
- —
Short-term bridge; refi at stabilization.
Listing history 11 events
-
2026-06-07statusdays on market $45,000 Pending 16 DOM
-
2026-06-04days on market $45,000 Active 14 DOM
-
2026-06-02days on market $45,000 Active 13 DOM
-
2026-06-01price $45,000 Active 12 DOM
-
2026-06-01days on market $74,000 Active 12 DOM
-
2026-05-31days on market $74,000 Active 11 DOM
-
2026-05-22status Active
-
2026-05-13status Pending
-
2026-05-11$74,000 Active
-
2002-10-25soldstatus $25,000
-
2001-12-06soldstatus $13,000
ⓘ Source: listings_history table (triggers on properties + properties_extension) + one-shot
backfill from property_details.listing_events for pre-trigger history.
Tax reassessment forecast NY · Partial reset (capped growth)
- Current annual tax
- $1,899 · $158/mo
- Projected year-2 tax
- $1,899 · $158/mo
- Expected delta
- $0/yr ($0/mo · -0.0%)
ⓘ Screening estimate from a state-policy table — verify with the county assessor before closing.
Climate risk First Street
- Flood 1/10 Low FEMA zone X · 0% chance over 30 yrs
- Wildfire 2/10 Low
- Heat 2/10 Low 7 d/yr ≥94°F today · 15 d/yr by 30 yrs out
- Wind 1/10 Low
- Air quality 1/10 Low 0 unhealthy d/yr today · 0 by 30 yrs out
Nearby sold comps map
Loading sold comps map…
Walkable amenities ~0.75 mi
Loading nearby amenities…
Taxation est. · year 1
- Rental income
- $11,802
- − Mortgage interest
- −$2,521
- − Property taxes
- −$1,899
- − Insurance
- −$225
- − Repairs & maintenance
- −$944
- − Management
- −$944
- − Depreciation
- −$1,309
- Taxable income
- $3,960
- Est. tax owed @ 24.0%
- −$950
- After-tax cash flow
- $3,417/yr
For passive investors: Depreciation is non-cash, so a rental often shows a tax loss while cash-flowing — sheltering income. Rental losses are passive: they offset passive income freely, and up to $25,000/yr can offset ordinary (W-2) income if you actively participate and your MAGI is under $100k (phasing out to $0 by $150k); unused losses carry forward. On sale, claimed depreciation is recaptured at up to 25%, and gains may owe capital-gains tax (a 1031 exchange can defer both). Figures are a year-1 estimate at your 24.0% rate — not tax advice; consult a CPA.
Schools (NCES district)
- District
- Brasher Falls Central School District
- NCES district ID
- 3627960
- Math proficiency
- 39% ▼ -16.00%
- Reading proficiency
- 45% ▲ 2.00%
- Median HH income
- $43,069
- Composite
- 35.47/100
- National rank
- #4926
- State rank
- #499 of 590 in NY
Livability — Winthrop
- Score
- 58/100
- State rank
- #1067
- US rank
- #21337
Category grades
Schools grade is shown separately in the Schools card above.
Census & demographics
- Population (ZIP)
- 2,733
Population outlook (St. Lawrence County) Hauer SSP2
- Today (2025)
- 110,027 people
- By 2030
- 107,455 · -2.3%
- By 2040
- 100,492 · -8.7%
- By 2050
- 94,254 · -14.3%
- By 2075
- 80,175 · -27.1%
- By 2100
- 63,140 · -42.6%
Race, ethnicity, and origin ACS 2023
- Neighborhood character
- Predominantly White (97%)
- Race & ethnicity
- White 97% Two or more races 2%
- Common ancestry
- Lithuanian 20% Romanian 5% Iranian 2%
- Foreign-born
- 2% · Canada
- Languages at home
- 97% English-only · German/W. Germanic 2%
Political lean MEDSL · St. Lawrence
- 2024 margin
- R (+18.0) · D 41.0% · R 59.0%
- 2008→2024 swing
- -34.3pp toward R · 2008: 16.3pp · 2024: -18.0pp
- All cycles
- 2024: R+18.0 2020: R+11.7 2016: R+10.8 2012: D+16.6 2008: D+16.3
Not yet ingested
- Civics
- —
Market trends
- HPI YoY
- ▲ 4.19%
- Current HPI
- 299.3344
- Rent YoY
- —
- Metro
- —
- State GDP YoY
- ▲ 2.60%
- F500 in state
- 92
Industry mix (Fortune 500 HQ in NY)
| Industry | F500 HQs | Revenue |
|---|---|---|
| Financial Services | 10 | $950B |
|
||
| Consumer Goods | 9 | $162B |
|
||
| Insurance | 4 | $225B |
|
||
| Telecommunications | 2 | $144B |
|
||
| Pharmaceuticals | 2 | $112B |
|
||
| Media / Entertainment | 2 | $69B |
|
||
Price history
+469.2% since first listed5 events — show timeline
- 2026-05-22 Relisted — SLCMLS
- 2026-05-13 Pending — SLCMLS
- 2026-05-11 Listed $74,000 SLCMLS
- 2002-10-25 Sold (Public Records) $25,000 Public Records
- 2001-12-06 Sold (Public Records) $13,000 Public Records
Property tax history
+3.9%/yrLatest (2025): $1,899 · -0.5% YoY. Source: county tax records.
Cash-flow waterfall
monthlySold comps — $/sqft
last 12 mo · ≤1 miLoading sold comps…