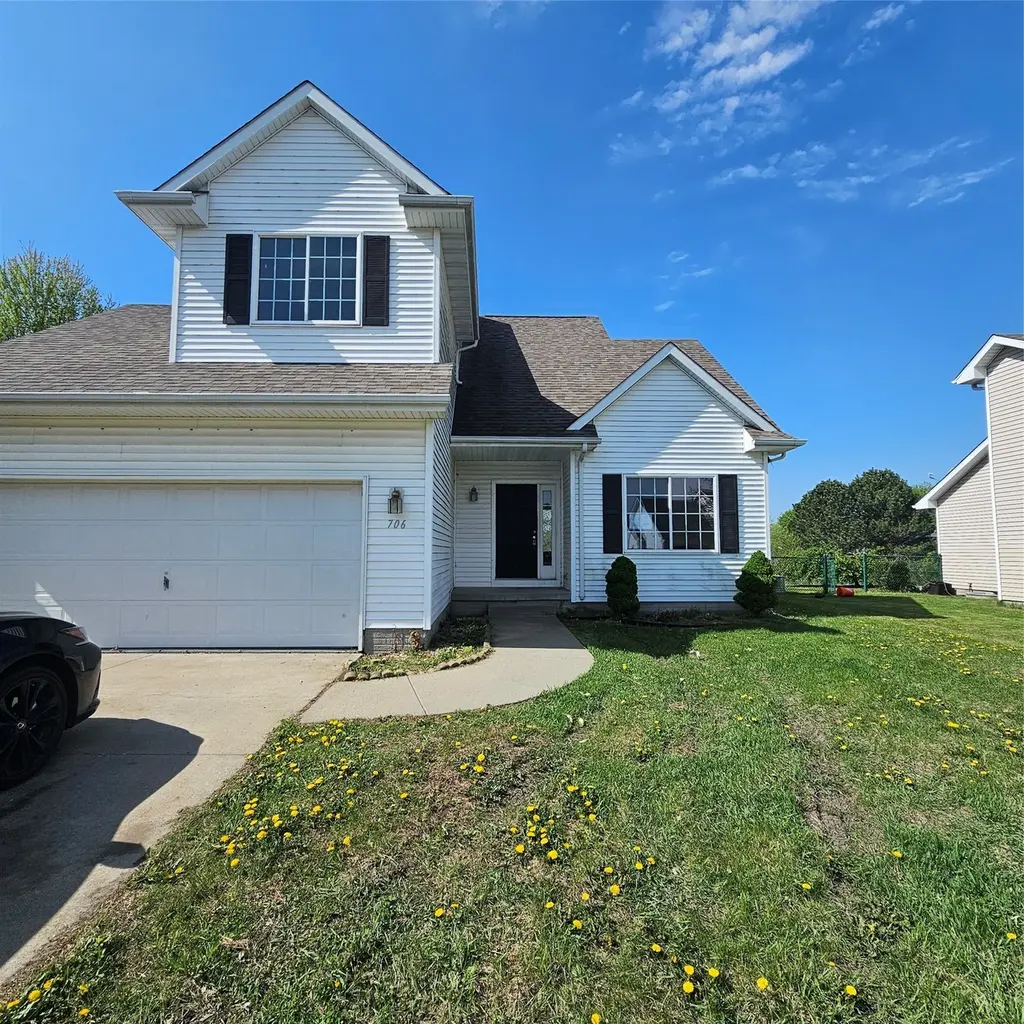
706 Filmore Ave SE · Bondurant, IA
Flood risk 1/10 · Minimal
- FEMA flood zone
- X (unshaded)
- Chance of flooding over 30 yrs
- 0.0%
- Est. flood insurance / yr
- $473 – $860
Fire risk 1/10 · Minimal
- Est. fire insurance / yr
- $902 – $1,676
Heat risk 3/10 · Minor
- Hot days now (above 103°F)
- 7 days/yr
- Hot days in 30 yrs
- 15 days/yr
Wind risk 2/10 · Minimal
- Chance of severe wind over 30 yrs
- —
Air-quality risk 1/10 · Minimal
- Unhealthy air days now
- 0 days/yr
- Unhealthy air days in 30 yrs
- 0 days/yr
Risk factors via First Street. Map © Google.
Why this score? — see what drove the D+ grade
The composite is a weighted blend of 9 inputs, each scored 0–100. Each bar is that input's sub-score; the figure is the points it added to the 100-point composite (weight × sub-score).
- ARV discount +15.0/15.0
- Cash flow +11.2/30.0
- Schools +6.2/10.0
- 1% rule +4.5/10.0
- Livability +3.8/5.0
- DSCR +3.3/10.0
- Rent growth +2.5/5.0
- Condition / age +2.5/5.0
- Appreciation +0.0/10.0
$202,860
🖨 Deal sheet 📄 Offer letter ✓ Due diligence
Listing remarks MLS
Move in ready 4 bedroom home in Bondurant is perfect size for a family. New roof being put on home first part of August. New furnace in 2015. Approx. 2000 square feet of finish. This home features a vaulted living room and a nice family room with fireplace. The kitchen's backsplash is striking. Upstairs there are 3 bedrooms, including a large vaulted master suite with walk-in closet. The finished basement includes a large family room, bathroom and a fourth bedroom. This home is in a wonderful neighborhood. Schedule a showing today. You will not be disappointed!
Key facts
- 7,800 sq ft lot
- 2 garage spots
- Built 2003
Property features AI
Exterior
- Parking: Attached two-car garage
- Utilities: Public water
- Home design: Two-story home; Vinyl siding
- Construction: Built with vinyl siding; Asphalt shingle roof; Poured foundation; Approximately 700 sq ft finished below grade
- Exterior features: Concrete road access; Lot dimensions approximately 65 x 120
Interior
- Bathrooms: 3 full bathrooms; 1 half bathroom
- Heating & cooling: Central air conditioning; Forced-air gas heating (natural gas)
- Interior features: Dining area; Eat-in kitchen; Finished basement; Gas log fireplace (1)
- Laundry & utility: Main-level laundry
Neighborhood map
What this means for you Summary
Snapshot
- This is a 3-bed/3.5-bath single-family listed at $203k.
Deal economics
- At list price, monthly cash flow is $-78 ($-938/yr) — negative.
- To cash-flow at today's rent, offer at most $189k (6.8% below list).
- To meet the 1% rule (rent ≥ 1% of price), the offer needs to be $193k (5.0% below list).
- Recommended offer: $189k (6.8% below list) — sets the bar for cash-flow.
- Cap rate 5.8% vs local median 3.1% in Bondurant — top-decile yield for the area; either an underpriced asset or a hidden risk that comps aren't pricing in. Stress-test before assuming the spread holds.
Location & tenants
- Location reads 76/100 on livability (#205 in IA, #3,724 nationally) — a middle-class / working-renter tenant base. Strengths: crime A+, employment A+, cost of living A+; Watch: amenities F, commute F, health & safety F.
- Bondurant-Farrar Community School District (rural): math 68% / reading 75% proficiency, ranked #89 of 289 in IA (top 31%) — strong family-tenant draw, lease renewals of 3-5y typical; only 14% free/reduced lunch — higher-income household profile.
- Market conditions: 252 active listings in the ZIP; 3 comparable units currently listed for rent nearby; rentals at typical pace (median 24d on market — plan ~3-4 weeks tenant-placement turnaround); 2,953 units permitted in Polk County in 2024 (540 in 5+ unit buildings).
Forward outlook
- Local home prices are declining (-3.0%/yr); year-one equity from $1k of loan paydown is wiped out by about $6k of value loss. Plan a longer hold.
- Polk County population projected at +37% by 2050 — long-run rental-demand tailwind backs the buy-and-hold thesis.
Negotiation context
- It's been on market 21 days — a 2% lower offer ($200k) is reasonable based on typical stale-listing flexibility.
- 6 sale attempts since 19y ago with the ask held roughly flat each time — persistent listings suggest the price (not the market) is what's stuck; bring a comps-based counter.
Risks & watch-outs
- Watch-outs: property tax is 2.7% of price.
Questions for the listing agent
- What do current leases actually rent for vs. the listed asking? Can we see a recent rent roll and the last 12 months of T-12 income?
- Property tax is high relative to price — has the assessment been appealed recently, and will the sale trigger a re-assessment?
- Is there a deadline driving the sale (1031 exchange, divorce, estate, relocation)? That informs how much negotiation room exists.
- Schools are A-rated — typically a magnet for longer-tenancy family renters. What's the average tenant stay here, and is there a school-zone premium baked into asking?
- The area grade is low — what's the realistic commute time and amenity access for the typical tenant pool here? Any planned neighborhood developments (good or bad) we should know about?
- What's the average days-on-market for RENTAL listings here right now (not sales)? A rising rental-DOM trend means longer vacancies and softer asking-rent achievability than the comps imply.
- What's the recent tenant-quality profile in this submarket — average credit score on applications, eviction rate, late-payment / NSF rate, and stable-employment percentage? A property-management company in the area should have these aggregated.
- How much new for-sale + rental construction is in the pipeline within 1–3 miles? Heavy new supply typically softens prices + rents 12–24 months out; constrained supply supports both.
Investment metrics
- 1% rule
- 0.95% ✗
- Cap rate
- 5.83%
- Cash-on-cash
- -1.65%
- DSCR
- 0.93
- GRM
- 8.8
CMA / ARV
- ARV (median comp)
- $265,616
- List price
- $202,860
- Delta
- -23.63%
- Verdict
- UNDERPRICED
- Comps
- 20 within 1.0 mi
Show comp detail 12 sales within ~0.75 mi
| Address | Dist | Beds/Ba | Sqft | Sold | Price | $/sf | Match |
|---|---|---|---|---|---|---|---|
| 706 Filmore Ave SE | 0.00mi | 4/3.5 (+1) | 1,382 (0%) | 0mo | $202,860 | $147 | 95 |
| 505 Cleveland Ave SE | 0.12mi | 3/2.5 | 1,433 (+4%) | 3mo | $305,000 | $213 | 82 |
| 438 4th St SE | 0.20mi | 3/2.5 | 1,430 (+4%) | 0mo | $346,000 | $242 | 81 |
| 406 3rd St SE | 0.26mi | 3/2.5 | 1,444 (+4%) | 1mo | $305,000 | $211 | 76 |
| 1003 Lincoln St SE | 0.15mi | 3/1.0 | 1,270 (-8%) | 2mo | $245,000 | $193 | 68 |
| 511 11th Ct SE | 0.08mi | 3/1.5 | 1,256 (-9%) | 7mo | $233,770 | $186 | 67 |
| 910 Lincoln Ct SE | 0.21mi | 3/1.0 | 1,260 (-9%) | 2mo | $216,500 | $172 | 63 |
| 1004 Dee St SE | 0.36mi | 4/3.0 (+1) | 1,495 (+8%) | 4mo | $338,000 | $226 | 60 |
| 500 15th St SE | 0.45mi | 3/2.0 | 1,462 (+6%) | 4mo | $277,000 | $189 | 59 |
| 901 Dee St SE | 0.36mi | 4/3.0 (+1) | 1,498 (+8%) | 4mo | $323,990 | $216 | 59 |
| 1339 Joshua Cir SE | 0.62mi | 3/2.0 | 1,421 (+3%) | 4mo | $315,000 | $222 | 57 |
| 908 14th St SE | 0.45mi | 4/3.0 (+1) | 1,514 (+10%) | 1mo | $330,000 | $218 | 55 |
Match score weights: distance 35% · size 25% · config 20% · recency 20%. Top-matched comps best support the ARV.
Projected returns pro-forma
-3.0% appreciation · 3.0% rent growth · sell at horizon
- IRR
- -18.9%
- Equity multiple
- 0.34×
- Total profit
- $-37,698
- Equity at exit
- $30,247
- IRR
- -11.3%
- Equity multiple
- 0.32×
- Total profit
- $-38,623
- Equity at exit
- $17,540
Cash invested: $56,801 (down + closing). Projections, not guarantees.
Landlord ↔ Tenant lean methodology
- Overall (STATE)
- 83 Strongly Landlord-Friendly
- State Iowa
- 83 Strongly Landlord-Friendly · R+6
- County
- — inherits STATE
- City
- — inherits STATE
ZIP-level market 50035
- Home prices YoY
- -19.9%
- Active inventory
- 252
- Price-to-rent
- 8.8×
Monthly cashflow live
- Estimated rent
- $1,926 medium interval (Pro) →
- Mortgage (P&I)
- −$1,064
- Tax from tax record
- −$452 /mo · $5,418/yr
- Insurance
- −$85
- HOA
- −$0
- Vacancy / Maint / Mgmt
- −$405
- Net cashflow
- $-78
Break-even live
UW: 25.0% down · 7.5% · 30yr · 1.5% tax · 5.0% vac · 8.0% maint · 8.0% mgmt
Financing live
Cash to close
- Down payment
- $50,715
- Closing costs
- $6,086
- Reserves months
- —
- Total cash needed
- —
Loan-product check · same deal, 3 products live
Conventional
25% down · 7.5% · 30yr
- Down + closing
- —
- Monthly P&I
- —
- Monthly cashflow
- —
- DSCR
- —
- Eligible?
- —
Personal DTI + credit; lowest rate.
DSCR
20% down · 8.5% · 30yr
- Down + closing
- —
- Monthly P&I
- —
- Monthly cashflow
- —
- DSCR
- —
- Eligible?
- —
No personal income docs; deal must DSCR.
Hard money
10% down · 12.0% · 12mo
- Down + closing
- —
- Monthly P&I
- —
- Monthly cashflow
- —
- DSCR
- —
- Eligible?
- —
Short-term bridge; refi at stabilization.
Rent comps 3 comps
| Address | Beds | Baths | Sqft | Rent | $/sqft | DOM | Units | Dist |
|---|---|---|---|---|---|---|---|---|
| 1024 Cove St SE Bondurant, IA | 4.0 | 2.5 | 1850 | $2,395 | $1.29 | 23d | 1 | 0.25mi |
| 1319 Kadin Trl Bondurant, IA | 3.0 | 1.0 | 1008 | $1,210 | $1.20 | 43d | 1 | 0.37mi |
| 121 Buffalo Ave SW Bondurant, IA | 3.0 | 2.5 | 1404 | $1,995 | $1.42 | 14d | 1 | 1.42mi |
Listing history 13 events
-
2026-05-15status Pending 659-char remark
-
2026-04-24$202,860 Active 659-char remark
-
2017-09-20soldstatus $216,000
-
2017-09-19soldstatus $216,000 567-char remark
Show marketing remark (567 chars)
Move in ready 4 bedroom home in Bondurant is perfect size for a family. New roof being put on home first part of August. New furnace in 2015. Approx. 2000 square feet of finish. This home features a vaulted living room and a nice family room with fireplace. The kitchen's backsplash is striking. Upstairs there are 3 bedrooms, including a large vaulted master suite with walk-in closet. The finished basement includes a large family room, bathroom and a fourth bedroom. This home is in a wonderful neighborhood. Schedule a showing today. You will not be disappointed!
-
2017-07-18$220,000 567-char remark
Show marketing remark (567 chars)
Move in ready 4 bedroom home in Bondurant is perfect size for a family. New roof being put on home first part of August. New furnace in 2015. Approx. 2000 square feet of finish. This home features a vaulted living room and a nice family room with fireplace. The kitchen's backsplash is striking. Upstairs there are 3 bedrooms, including a large vaulted master suite with walk-in closet. The finished basement includes a large family room, bathroom and a fourth bedroom. This home is in a wonderful neighborhood. Schedule a showing today. You will not be disappointed!
-
2017-06-27historical
-
2017-06-07$215,000
-
2017-06-01historical
-
2017-02-28historical
-
2017-02-27$200,000
-
2016-11-07$210,000
-
2008-05-13soldstatus $165,000
-
2007-10-26$165,000
ⓘ Source: listings_history table (triggers on properties + properties_extension) + one-shot
backfill from property_details.listing_events for pre-trigger history.
Tax reassessment forecast IA · Partial reset (capped growth)
- Current annual tax
- $5,418 · $452/mo
- Projected year-2 tax
- $5,418 · $452/mo
- Expected delta
- $0/yr ($0/mo · 0.0%)
ⓘ Screening estimate from a state-policy table — verify with the county assessor before closing.
Climate risk First Street
- Flood 1/10 Low FEMA zone X (unshaded) · 0% chance over 30 yrs
- Wildfire 1/10 Low
- Heat 3/10 Moderate 7 d/yr ≥103°F today · 15 d/yr by 30 yrs out
- Wind 2/10 Low
- Air quality 1/10 Low 0 unhealthy d/yr today · 0 by 30 yrs out
Nearby sold comps map
Loading sold comps map…
Walkable amenities ~0.75 mi
Loading nearby amenities…
Taxation est. · year 1
- Rental income
- $23,115
- − Mortgage interest
- −$11,363
- − Property taxes
- −$5,418
- − Insurance
- −$1,014
- − Repairs & maintenance
- −$1,849
- − Management
- −$1,849
- − Depreciation
- −$5,901
- Taxable loss
- −$4,281
- Est. tax savings @ 24.0%
- +$1,027
- After-tax cash flow
- $90/yr
For passive investors: Depreciation is non-cash, so a rental often shows a tax loss while cash-flowing — sheltering income. Rental losses are passive: they offset passive income freely, and up to $25,000/yr can offset ordinary (W-2) income if you actively participate and your MAGI is under $100k (phasing out to $0 by $150k); unused losses carry forward. On sale, claimed depreciation is recaptured at up to 25%, and gains may owe capital-gains tax (a 1031 exchange can defer both). Figures are a year-1 estimate at your 24.0% rate — not tax advice; consult a CPA.
Schools (NCES district)
- District
- Bondurant-Farrar Community School District
- NCES district ID
- 1905070
- Math proficiency
- 68% ▼ -6.00%
- Reading proficiency
- 75% ▲ 1.00%
- Median HH income
- $67,433
- Composite
- 62.25/100
- National rank
- #701
- State rank
- #89 of 289 in IA
Livability — Bondurant
- Score
- 76/100
- State rank
- #205
- US rank
- #3724
Category grades
Schools grade is shown separately in the Schools card above.
Census & demographics
- Census place
- Bondurant, IA
- City population
- 9,668
- Population (ZIP)
- 9,668
Population outlook (Polk County) Hauer SSP2
- Today (2025)
- 548,042 people
- By 2030
- 588,557 · +7.4%
- By 2040
- 670,629 · +22.4%
- By 2050
- 752,830 · +37.4%
- By 2075
- 955,069 · +74.3%
- By 2100
- 1,115,436 · +103.5%
Race, ethnicity, and origin ACS 2023
- Neighborhood character
- Predominantly White (90%)
- Race & ethnicity
- White 90% Black 5% Hispanic / Latino 3% Two or more races 1%
- Common ancestry
- Portuguese 7% Iranian 4% Swiss 4%
- Foreign-born
- 4% · Canada
- Languages at home
- 96% English-only · Spanish 2% Russian/Polish/Slavic 1%
Political lean MEDSL · Polk
- 2024 margin
- D (+10.9) · D 54.8% · R 43.9% · Other 1.3%
- 2008→2024 swing
- -3.7pp toward R · 2008: 14.6pp · 2024: 10.9pp
- All cycles
- 2024: D+10.9 2020: D+15.2 2016: D+11.5 2012: D+14.2 2008: D+14.6
Not yet ingested
- Civics
- —
Market trends
- HPI YoY
- ▼ -59.18%
- Current HPI
- 237.4352
- Rent YoY
- —
- Metro
- —
- State GDP YoY
- ▲ 2.48%
- F500 in state
- 4
Industry mix (Fortune 500 HQ in IA)
| Industry | F500 HQs | Revenue |
|---|---|---|
| Financial Services | 1 | $16B |
|
||
| Retail / Convenience | 1 | $15B |
|
||
Price history
+22.9% since first listed14 events — show timeline
- 2026-06-12 Sold (MLS) $202,860 DMMLS
- 2026-05-15 Pending — DMMLS
- 2026-04-24 Listed $202,860 DMMLS
- 2017-09-20 Sold (Public Records) $216,000 Public Records
- 2017-09-19 Sold (MLS) $216,000 DMMLS
- 2017-07-18 Listed $220,000 DMMLS
- 2017-06-27 Listing Removed — DMMLS
- 2017-06-07 Listed $215,000 DMMLS
- 2017-06-01 Listing Removed — DMMLS
- 2017-02-28 Listing Removed — DMMLS
- 2017-02-27 Listed $200,000 DMMLS
- 2016-11-07 Listed $210,000 DMMLS
- 2008-05-13 Sold (MLS) $165,000 DMMLS
- 2007-10-26 Listed $165,000 DMMLS
Property tax history
+8.6%/yrLatest (2025): $5,418 · +2.3% YoY. Source: county tax records.
Cash-flow waterfall
monthlySold comps — $/sqft
last 12 mo · ≤1 miLoading sold comps…