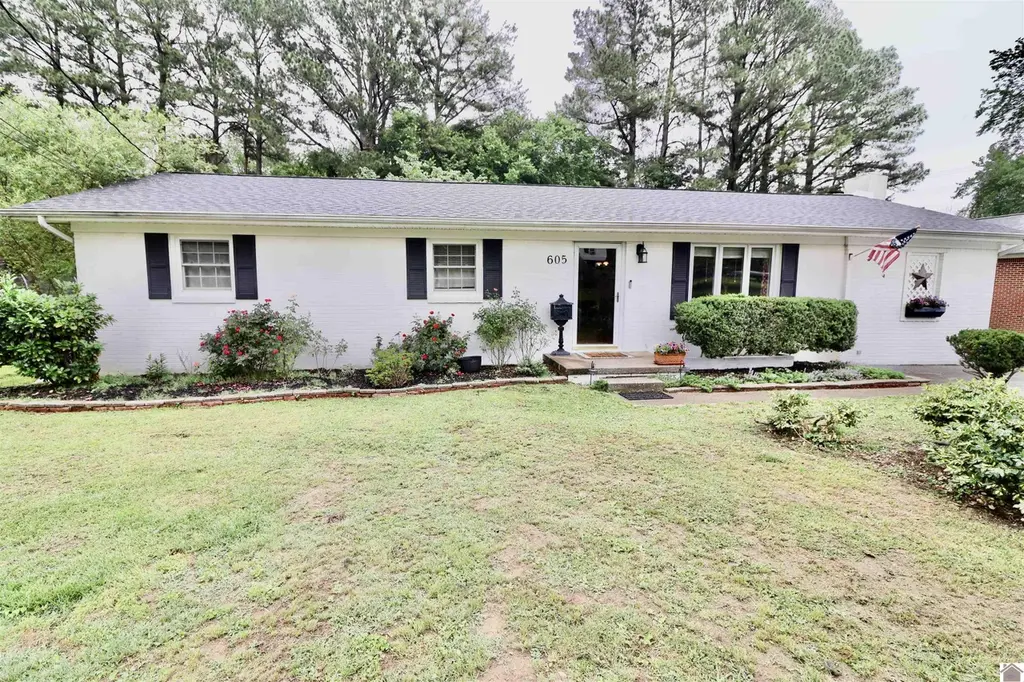
605 Meadow Ln · Murray, KY
Flood risk 1/10 · Minimal
- FEMA flood zone
- X (unshaded)
- Chance of flooding over 30 yrs
- 0.0%
- Est. flood insurance / yr
- $507 – $1,088
Fire risk 3/10 · Minor
- Est. fire insurance / yr
- $839 – $1,559
Heat risk 6/10 · Moderate
- Hot days now (above 108°F)
- 7 days/yr
- Hot days in 30 yrs
- 20 days/yr
Wind risk 4/10 · Minor
- Chance of severe wind over 30 yrs
- 9.0%
Air-quality risk 1/10 · Minimal
- Unhealthy air days now
- 0 days/yr
- Unhealthy air days in 30 yrs
- 0 days/yr
Risk factors via First Street. Map © Google.
Why this score? — see what drove the D+ grade
The composite is a weighted blend of 9 inputs, each scored 0–100. Each bar is that input's sub-score; the figure is the points it added to the 100-point composite (weight × sub-score).
- Cash flow +14.0/30.0
- ARV discount +12.4/15.0
- Schools +5.0/10.0
- Rent growth +4.3/5.0
- DSCR +4.2/10.0
- Livability +3.1/5.0
- 1% rule +2.6/10.0
- Condition / age +2.5/5.0
- Appreciation +0.0/10.0
$199,999
🖨 Deal sheet (PDF) 📄 Offer letter ✓ Due diligence
Listing remarks MLS
This home has beautiful refinished wood floors and open living and dining areas. Ventless gas logs in an attractive fireplace. Features include breakers, crown molding in the master, replacement windows, large pantry, and new ss appliances. Painted with decorator colors throughout. Large deck and storage building in the back. Perfect starter home in a central location complete with front landscaping and great curb appeal.
Key facts
- Spacious kitchen
- New roof
- 0.32 acre lot
Tags
Property features AI
Exterior
- Parking: Paved parking
- Security: Security system; Smoke detector(s)
- Utilities: Public water; Public sewer; Natural gas available
- Home design: Single-family residence; One story
- Construction: Frame construction; Shingle roof; Crawl space foundation; Built as residential single family
- Exterior features: Deck; Storm door(s); Outbuilding; Level lot
Interior
- Kitchen: Dishwasher; Refrigerator; Cooktop
- Flooring: Carpet; Ceramic tile; Tile; Vinyl; Wood
- Bathrooms: 1 full bathroom
- Heating & cooling: Central air; Ceiling fan(s)
- Interior features: Pantry; Insulated windows; Fireplace in family room with gas log
- Laundry & utility: Electric water heater
Neighborhood map
What this means for you Summary
Snapshot
- This is a 3-bed/1.0-bath single-family listed at $200k.
Deal economics
- At list price, monthly cash flow is $26 ($309/yr) — positive.
- The deal already cash-flows at list — no discount required.
- To meet the 1% rule (rent ≥ 1% of price), the offer needs to be $152k (24.2% below list).
- Recommended offer: $152k (24.2% below list) — sets the bar for 1% rule.
- Cap rate 6.4% vs local median 3.5% in Murray — top-decile yield for the area; either an underpriced asset or a hidden risk that comps aren't pricing in. Stress-test before assuming the spread holds.
Location & tenants
- Location reads 61/100 on livability (#380 in KY) — a middle-class / working-renter tenant base. Strengths: cost of living A+, crime A; Watch: amenities F, commute F, employment F.
- Murray Independent (town): math 58% / reading 63% proficiency, ranked #5 of 165 in KY (top 3%) — acceptable for families but not a draw, mixed tenant base, ~2y average lease.
- Zoned schools: Murray Elementary School (math 52% / reading 57%, grade C, #66 of 676 statewide, top 11%, 544 students, 48% FRL); Murray Middle School (math 60% / reading 65%, grade B+, #2 of 217 statewide, top 0%, 653 students, 47% FRL); Murray High School (math 52% / reading 57%, grade C-, #7 of 254 statewide, top 2%, 553 students, 49% FRL).
- Market conditions: Rents rising fast (+7.2%/yr); 256 active listings in the ZIP; 2 comparable units currently listed for rent nearby; 81 units permitted in Calloway County in 2024 (66 in 5+ unit buildings).
- This rent runs 36% of the median local income ($50k/yr) — at the standard rent-burdened threshold; future hikes will face affordability resistance.
Forward outlook
- Local home prices are declining (-3.0%/yr); year-one equity from $1k of loan paydown is wiped out by about $6k of value loss. Plan a longer hold.
- Calloway County population projected at +18% by 2050 — long-run rental-demand tailwind backs the buy-and-hold thesis.
Negotiation context
- It's been on market 27 days — a 2% lower offer ($197k) is reasonable based on typical stale-listing flexibility.
- 3 sale attempts since 9y ago; this cycle's ask has dropped $15k (7%) from the opening price — seller is motivated, your offer sets the floor, not the list.
- Current owner paid $122k; list at $200k implies a 64% gain — meaningful room to come down on a strong offer.
Risks & watch-outs
- Climate carrying-cost: extreme-heat days projected 7→20/yr by 2055 (HVAC capex compounding) — expect insurance premiums to compound above CPI over the hold.
Questions for the listing agent
- Built in 1966 — when were the roof, HVAC, electrical panel, plumbing, and water heater last replaced?
- Is there a deadline driving the sale (1031 exchange, divorce, estate, relocation)? That informs how much negotiation room exists.
- Schools are B-rated — typically a magnet for longer-tenancy family renters. What's the average tenant stay here, and is there a school-zone premium baked into asking?
- The area grade is low — what's the realistic commute time and amenity access for the typical tenant pool here? Any planned neighborhood developments (good or bad) we should know about?
- What's the average days-on-market for RENTAL listings here right now (not sales)? A rising rental-DOM trend means longer vacancies and softer asking-rent achievability than the comps imply.
- What's the recent tenant-quality profile in this submarket — average credit score on applications, eviction rate, late-payment / NSF rate, and stable-employment percentage? A property-management company in the area should have these aggregated.
- How much new for-sale + rental construction is in the pipeline within 1–3 miles? Heavy new supply typically softens prices + rents 12–24 months out; constrained supply supports both.
Investment metrics
- 1% rule
- 0.76% ✗
- Cap rate
- 6.45%
- Cash-on-cash
- 0.55%
- DSCR
- 1.02
- GRM
- 11.0
CMA / ARV
- ARV (on-the-fly)
- $224,613
- Comps found
- 12
Show comp detail 12 sales within ~0.75 mi
| Address | Dist | Beds/Ba | Sqft | Sold | Price | $/sf | Match |
|---|---|---|---|---|---|---|---|
| 512 Stone Ridge Ln | 0.07mi | 3/2.5 | 1,616 (+1%) | 7mo | $255,000 | $158 | 82 |
| 1511 Sycamore St | 0.22mi | 3/2.0 | 1,588 (-0%) | 6mo | $224,500 | $141 | 80 |
| 500 S 13th St | 0.24mi | 3/1.5 | 1,633 (+2%) | 8mo | $188,000 | $115 | 76 |
| 310 S 13th St | 0.33mi | 4/1.5 (+1) | 1,604 (+1%) | 1mo | $90,000 | $56 | 76 |
| 1398 Johnson Blvd | 0.11mi | 3/2.0 | 1,798 (+13%) | 2mo | $235,000 | $131 | 68 |
| 1515 Kirkwood Dr | 0.40mi | 3/2.0 | 1,446 (-9%) | 1mo | $240,500 | $166 | 61 |
| 300 S 16th St | 0.47mi | 3/2.0 | 1,530 (-4%) | 8mo | $205,000 | $134 | 61 |
| 200 Woodlawn Ave | 0.50mi | 3/2.0 | 1,640 (+3%) | 11mo | $205,000 | $125 | 59 |
| 1508 Glendale Rd | 0.51mi | 3/2.0 | 1,712 (+8%) | 10mo | $260,000 | $152 | 51 |
| 1603 Catalina Dr | 0.62mi | 4/2.0 (+1) | 1,450 (-9%) | 1mo | $238,850 | $165 | 46 |
| 1223 W Dogwood Dr | 0.52mi | 3/3.0 | 1,768 (+11%) | 10mo | $195,000 | $110 | 41 |
| 804 Guthrie Dr | 0.72mi | 3/2.5 | 1,367 (-14%) | 1mo | $222,900 | $163 | 36 |
Match score weights: distance 35% · size 25% · config 20% · recency 20%. Top-matched comps best support the ARV.
Projected returns pro-forma
-3.0% appreciation · 7.18% rent growth · sell at horizon
- IRR
- -11.5%
- Equity multiple
- 0.57×
- Total profit
- $-24,227
- Equity at exit
- $29,821
- IRR
- 2.2%
- Equity multiple
- 1.18×
- Total profit
- $10,322
- Equity at exit
- $17,292
Cash invested: $56,000 (down + closing). Projections, not guarantees.
Landlord ↔ Tenant lean methodology
- Overall (STATE)
- 83 Strongly Landlord-Friendly
- State Kentucky
- 83 Strongly Landlord-Friendly · R+16
- County
- — inherits STATE
- City
- — inherits STATE
ZIP-level market 42071
- Home prices YoY
- -8.5%
- Rents YoY
- 7.2%
- Active inventory
- 256
- Price-to-rent
- 11.0×
Monthly cashflow live
- Estimated rent
- $1,517 medium interval (Pro) →
- Mortgage (P&I)
- −$1,049
- Tax from tax record
- −$40 /mo · $485/yr
- Insurance
- −$83
- HOA
- −$0
- Vacancy / Maint / Mgmt
- −$319
- Net cashflow
- $26
Break-even live
Sensitivity live
| Price | -10% $139 | -5% $82 | +0% $26 | +5% $-31 | +10% $-87 |
|---|---|---|---|---|---|
| Rent | -10% $-94 | -5% $-34 | +0% $26 | +5% $86 | +10% $146 |
| Rate | -1.0pp $126 | -0.5pp $77 | base $26 | +0.5pp $-26 | +1.0pp $-79 |
UW: 25.0% down · 7.5% · 30yr · 1.5% tax · 5.0% vac · 8.0% maint · 8.0% mgmt
Financing live
Cash to close
- Down payment
- $50,000
- Closing costs
- $6,000
- Reserves months
- —
- Total cash needed
- —
Loan-product check · same deal, 3 products live
Conventional
25% down · 7.5% · 30yr
- Down + closing
- —
- Monthly P&I
- —
- Monthly cashflow
- —
- DSCR
- —
- Eligible?
- —
Personal DTI + credit; lowest rate.
DSCR
20% down · 8.5% · 30yr
- Down + closing
- —
- Monthly P&I
- —
- Monthly cashflow
- —
- DSCR
- —
- Eligible?
- —
No personal income docs; deal must DSCR.
Hard money
10% down · 12.0% · 12mo
- Down + closing
- —
- Monthly P&I
- —
- Monthly cashflow
- —
- DSCR
- —
- Eligible?
- —
Short-term bridge; refi at stabilization.
Rent comps 2 comps
| Address | Beds | Baths | Sqft | Rent | $/sqft | DOM | Units | Dist |
|---|---|---|---|---|---|---|---|---|
| 104 Williams Ave Murray, KY | 3.0 | 2.0 | 1200 | $1,698 | $1.42 | 45d | 1 | 0.64mi |
| 400a Main St Murray, KY | 2.0 | 1.0 | 1200 | $1,298 | $1.08 | 45d | 1 | 1.25mi |
Listing history 23 events
-
2026-06-19days on market $199,999 Active 27 DOM
-
2026-06-18days on market $199,999 Active 26 DOM
-
2026-06-17days on market $199,999 Active 25 DOM
-
2026-06-16days on market $199,999 Active 24 DOM
-
2026-06-15days on market $199,999 Active 23 DOM
-
2026-06-14days on market $199,999 Active 21 DOM
-
2026-06-12days on market $199,999 Active 20 DOM
-
2026-06-09days on market $199,999 Active 17 DOM
-
2026-06-08days on market $199,999 Active 16 DOM
-
2026-06-07days on market $199,999 Active 15 DOM
-
2026-06-05pricedays on market $199,999 Active 12 DOM
-
2026-06-02days on market $214,900 Active 10 DOM
-
2026-06-01days on market $214,900 Active 9 DOM
-
2026-05-31days on market $214,900 Active 8 DOM
-
2026-05-30days on market $214,900 Active 7 DOM
-
2026-05-23$214,900 Active
-
2018-09-19soldstatus $121,750
-
2018-09-18soldstatus $121,750 425-char remark
Show marketing remark (425 chars)
This home has beautiful refinished wood floors and open living and dining areas. Ventless gas logs in an attractive fireplace. Features include breakers, crown molding in the master, replacement windows, large pantry, and new ss appliances. Painted with decorator colors throughout. Large deck and storage building in the back. Perfect starter home in a central location complete with front landscaping and great curb appeal.
-
2018-03-31$119,900 425-char remark
Show marketing remark (425 chars)
This home has beautiful refinished wood floors and open living and dining areas. Ventless gas logs in an attractive fireplace. Features include breakers, crown molding in the master, replacement windows, large pantry, and new ss appliances. Painted with decorator colors throughout. Large deck and storage building in the back. Perfect starter home in a central location complete with front landscaping and great curb appeal.
-
2017-10-14$124,900
-
2012-03-09soldstatus $123,000
-
2006-12-28soldstatus $105,000
-
2000-06-01soldstatus $77,000
ⓘ Source: listings_history table (triggers on properties + properties_extension) + one-shot
backfill from property_details.listing_events for pre-trigger history.
Tax reassessment forecast KY · Resets to sale price
- Current annual tax
- $485 · $40/mo
- Projected year-2 tax
- $1,720 · $143/mo
- Expected delta
- +$1,235/yr (+$103/mo · 254.4%)
ⓘ Screening estimate from a state-policy table — verify with the county assessor before closing.
Climate risk First Street
- Flood 1/10 Low FEMA zone X (unshaded) · 0% chance over 30 yrs
- Wildfire 3/10 Moderate
- Heat 6/10 Major 7 d/yr ≥108°F today · 20 d/yr by 30 yrs out
- Wind 4/10 Moderate 9% chance of damaging wind over 30 yrs
- Air quality 1/10 Low 0 unhealthy d/yr today · 0 by 30 yrs out
Nearby sold comps map
Loading sold comps map…
Walkable amenities ~0.75 mi
Loading nearby amenities…
Taxation est. · year 1
- Rental income
- $18,203
- − Mortgage interest
- −$11,203
- − Property taxes
- −$485
- − Insurance
- −$1,000
- − Repairs & maintenance
- −$1,456
- − Management
- −$1,456
- − Depreciation
- −$5,818
- Taxable loss
- −$3,216
- Est. tax savings @ 24.0%
- +$772
- After-tax cash flow
- $1,081/yr
For passive investors: Depreciation is non-cash, so a rental often shows a tax loss while cash-flowing — sheltering income. Rental losses are passive: they offset passive income freely, and up to $25,000/yr can offset ordinary (W-2) income if you actively participate and your MAGI is under $100k (phasing out to $0 by $150k); unused losses carry forward. On sale, claimed depreciation is recaptured at up to 25%, and gains may owe capital-gains tax (a 1031 exchange can defer both). Figures are a year-1 estimate at your 24.0% rate — not tax advice; consult a CPA.
Schools (NCES district)
- District
- Murray Independent
- NCES district ID
- 2104380
- Math proficiency
- 58% ▼ -15.00%
- Reading proficiency
- 63% ▼ -14.00%
- Median HH income
- $37,625
- Composite
- 50.29/100
- National rank
- #1882
- State rank
- #5 of 165 in KY
Livability — Murray
- Score
- 61/100
- State rank
- #380
- US rank
- #18091
Category grades
Schools grade is shown separately in the Schools card above.
Census & demographics
- Census place
- Murray, KY
- County
- Calloway County · 30,981 people
- City population
- 30,981
- Metro
- Murray, KY
- Population (ZIP)
- 30,981
- Household income
- $50,198
- Rent vs Own
- Severe rent burden
- 1046.0
Population outlook (Calloway County) Hauer SSP2
- Today (2025)
- 41,071 people
- By 2030
- 42,608 · +3.7%
- By 2040
- 45,435 · +10.6%
- By 2050
- 48,501 · +18.1%
- By 2075
- 56,481 · +37.5%
- By 2100
- 63,271 · +54.1%
Race, ethnicity, and origin ACS 2023
- Neighborhood character
- Predominantly White (87%)
- Race & ethnicity
- White 87% Black 4% Hispanic / Latino 3% Two or more races 3% Asian 2%
- Common ancestry
- Italian 3% Lithuanian 2% Slovak 2%
- Foreign-born
- 4% · Canada
- Languages at home
- 96% English-only · Spanish 2% Other Asian/Pacific 1% Other Indo-European 1%
Political lean MEDSL · Calloway
- 2024 margin
- Solid R (+38.0) · D 30.2% · R 68.1% · Other 1.7%
- 2008→2024 swing
- -19.6pp toward R · 2008: -18.4pp · 2024: -38.0pp
- All cycles
- 2024: R+38.0 2020: R+31.8 2016: R+35.0 2012: R+27.4 2008: R+18.4
Not yet ingested
- Civics
- —
Market trends
- HPI YoY
- ▼ -25.43%
- Current HPI
- 274.5366
- Rent YoY
- ▲ 7.18%
- Metro
- Murray, KY
- State GDP YoY
- ▲ 1.81%
- F500 in state
- 4
Industry mix (Fortune 500 HQ in KY)
| Industry | F500 HQs | Revenue |
|---|---|---|
| Healthcare | 1 | $118B |
|
||
| Food / Beverage | 1 | $7B |
|
||
Price history
+179.1% since first listed8 events — show timeline
- 2026-05-23 Listed $214,900 WKRMLS
- 2018-09-19 Sold (Public Records) $121,750 Public Records
- 2018-09-18 Sold (MLS) $121,750 WKRMLS
- 2018-03-31 Listed $119,900 WKRMLS
- 2017-10-14 Listed $124,900 WKRMLS
- 2012-03-09 Sold (Public Records) $123,000 Public Records
- 2006-12-28 Sold (Public Records) $105,000 Public Records
- 2000-06-01 Sold (Public Records) $77,000 Public Records
Property tax history
-7.7%/yrLatest (2025): $485 · +7.6% YoY. Source: county tax records.
Cash-flow waterfall
monthlySold comps — $/sqft
last 12 mo · ≤1 miLoading sold comps…