8392 US Highway 50 Cmn · Shoals, IN
Flood risk 1/10 · Minimal
- FEMA flood zone
- X (unshaded)
- Chance of flooding over 30 yrs
- 0.0%
- Est. flood insurance / yr
- $507 – $1,088
Fire risk 3/10 · Minor
- Est. fire insurance / yr
- $717 – $1,331
Heat risk 4/10 · Minor
- Hot days now (above 104°F)
- 7 days/yr
- Hot days in 30 yrs
- 19 days/yr
Wind risk 2/10 · Minimal
- Chance of severe wind over 30 yrs
- 1.0%
Air-quality risk 2/10 · Minimal
- Unhealthy air days now
- 1 days/yr
- Unhealthy air days in 30 yrs
- 1 days/yr
Risk factors via First Street. Map © Google.
Why this score? — see what drove the D+ grade
The composite is a weighted blend of 9 inputs, each scored 0–100. Each bar is that input's sub-score; the figure is the points it added to the 100-point composite (weight × sub-score).
- Cash flow +16.1/30.0
- ARV discount +7.5/15.0
- Appreciation +7.1/10.0
- DSCR +5.0/10.0
- 1% rule +3.1/10.0
- Livability +3.1/5.0
- Rent growth +2.5/5.0
- Schools +2.5/10.0
- Condition / age +2.5/5.0
$136,900
🖨 Deal sheet 📄 Offer letter ✓ Due diligence
Listing remarks
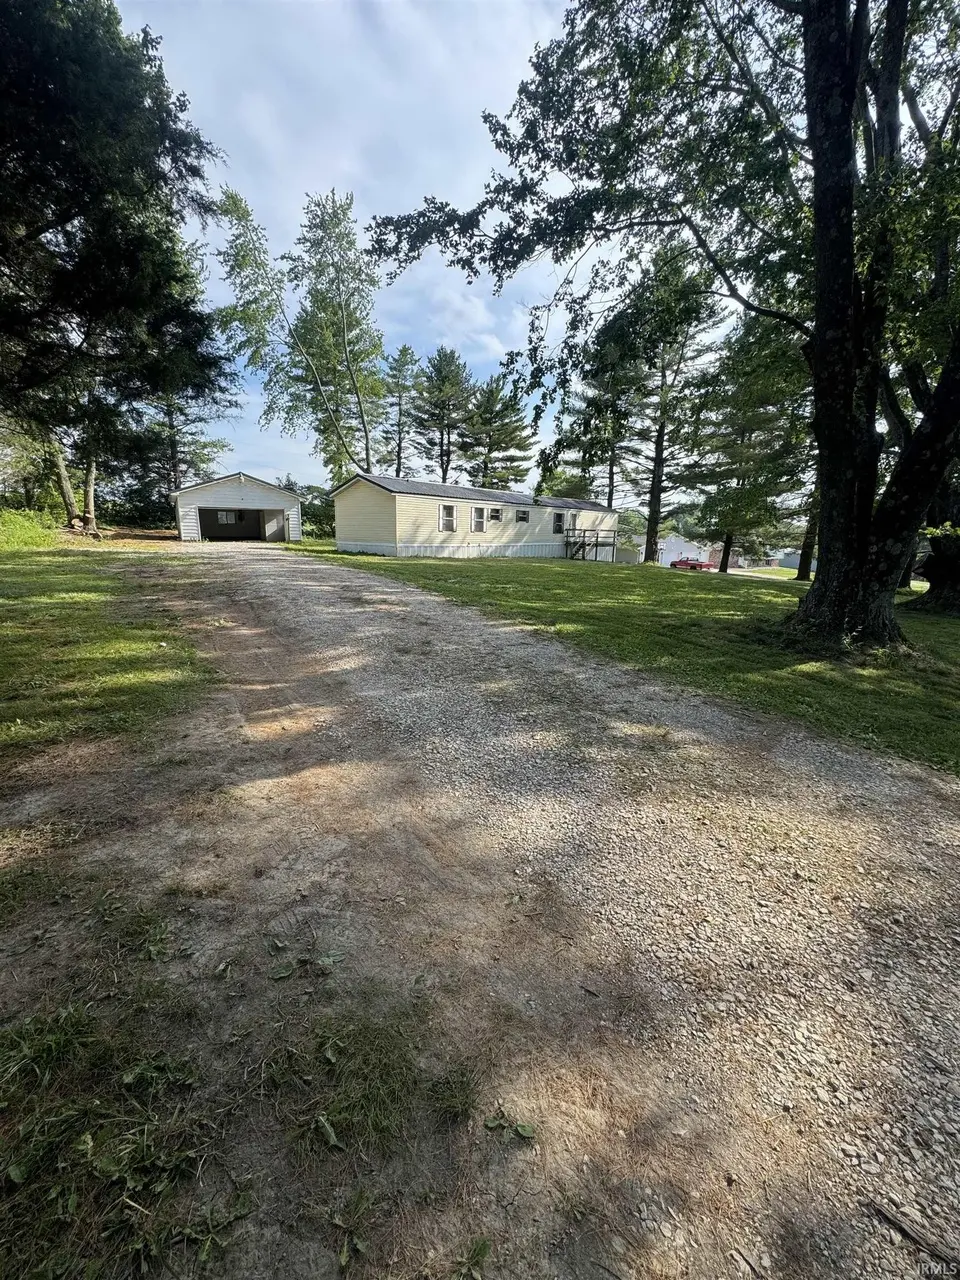
Welcome to country living with the convenience of town just minutes away! Situated on a beautiful 1-acre lot in Shoals, Indiana, this well-located 3-bedroom, 2-bath home offers the perfect combination of privacy, space, and accessibility. Featuring 1,216 square feet of living space, this home provides a comfortable layout designed for everyday living. Whether you're looking for your first home, a place to raise a family, or simply want to enjoy a quieter lifestyle, this property offers plenty of potential and room to make it your own. The private setting allows you to enjoy the peaceful atmosphere of country living while still benefiting from an excellent location. Conveniently located alon
Key facts
- 1 acre lot
- Private setting
- Detached garage
Tags
Property features AI
Finance
- Financial info: Annual property tax reported
Exterior
- Parking: Detached 1-car garage
- Utilities: Public water; Public sewer
- Home design: Manufactured home (residential); Vinyl siding
- Construction: Vinyl siding construction
- Exterior features: Wooded lot; Approximately 1 acre
Interior
- Bedrooms: 3 total rooms
- Bathrooms: 2 full bathrooms, both on the main level
- Heating & cooling: Central air conditioning; Natural gas and electric heating
- Interior features: One fireplace
- Laundry & utility: Laundry on the main level
Neighborhood map
What this means for you Summary
Snapshot
- This is a 3-bed/2.0-bath manufactured listed at $137k.
Deal economics
- At list price, monthly cash flow is $71 ($857/yr) — positive.
- The deal already cash-flows at list — no discount required.
- To meet the 1% rule (rent ≥ 1% of price), the offer needs to be $110k (19.5% below list).
- Recommended offer: $110k (19.5% below list) — sets the bar for 1% rule.
Location & tenants
- Location reads 62/100 on livability (#484 in IN) — a middle-class / working-renter tenant base. Strengths: cost of living A+, housing A+; Watch: crime C-, health & safety C-, amenities F.
- Shoals Community School Corporation (rural): math 24% / reading 34% proficiency, ranked #248 of 301 in IN (top 82%) — low school quality limits family demand, transient renter base, plan for 1-2y turnover.
- Zoned schools: Shoals Community Elementary School (math 32% / reading 32%, grade F, #652 of 994 statewide, top 68%, 314 students, 52% FRL); Shoals Community High School (math 15% / reading 54%, grade F, #269 of 369 statewide, top 73%, 192 students, 54% FRL) — zoned schools at 53% FRL track the district average.
- Market conditions: 18 active listings in the ZIP; 2 units permitted in Martin County in 2024 (0 in 5+ unit buildings).
Forward outlook
- In year one you build about $7k of equity ($946 loan paydown + $6k appreciation (4.2% local appreciation)).
- Martin County population projected at -22% by 2050 — secular population decline; favor cash flow + early exit over multi-decade hold.
- At projected returns (4.2% appreciation + 3.0% rent growth), your $38k cash investment doubles in ~5 years — after that, you're playing with house money.
- By year 6, paydown + projected appreciation supports a ~$36k cash-out refi (75% LTV) — recoverable capital for the next deal without selling this one.
Negotiation context
- Only 11 days on market — expect competitive offers; lowballing is unlikely to land.
- Current owner paid $35k; list at $137k implies a 291% gain — meaningful room to come down on a strong offer.
Questions for the listing agent
- Is there a deadline driving the sale (1031 exchange, divorce, estate, relocation)? That informs how much negotiation room exists.
- Schools are F-rated, which usually means shorter tenancies and higher turnover. Who's the typical renter profile here, and what's been the actual vacancy rate?
- The area grade is low — what's the realistic commute time and amenity access for the typical tenant pool here? Any planned neighborhood developments (good or bad) we should know about?
- What's the average days-on-market for RENTAL listings here right now (not sales)? A rising rental-DOM trend means longer vacancies and softer asking-rent achievability than the comps imply.
- What's the recent tenant-quality profile in this submarket — average credit score on applications, eviction rate, late-payment / NSF rate, and stable-employment percentage? A property-management company in the area should have these aggregated.
- How much new for-sale + rental construction is in the pipeline within 1–3 miles? Heavy new supply typically softens prices + rents 12–24 months out; constrained supply supports both.
Investment metrics
- 1% rule
- 0.81% ✗
- Cap rate
- 6.92%
- Cash-on-cash
- 2.23%
- DSCR
- 1.10
- GRM
- 10.3
CMA / ARV
No comps found within radius.
Projected returns pro-forma
4.24% appreciation · 3.0% rent growth · sell at horizon
- IRR
- 12.8%
- Equity multiple
- 1.79×
- Total profit
- $30,150
- Equity at exit
- $71,328
- IRR
- 14.1%
- Equity multiple
- 3.35×
- Total profit
- $90,133
- Equity at exit
- $118,218
Cash invested: $38,332 (down + closing). Projections, not guarantees.
Landlord ↔ Tenant lean methodology
- Overall (STATE)
- 90 Strongly Landlord-Friendly
- State Indiana
- 90 Strongly Landlord-Friendly · R+11
- County
- — inherits STATE
- City
- — inherits STATE
ZIP-level market 47581
- Home prices YoY
- 1.7%
- Active inventory
- 18
- Price-to-rent
- 10.3×
Monthly cashflow live
- Estimated rent
- $1,102 medium interval (Pro) →
- Mortgage (P&I)
- −$718
- Tax from tax record
- −$25 /mo · $295/yr
- Insurance
- −$57
- HOA
- −$0
- Vacancy / Maint / Mgmt
- −$232
- Net cashflow
- $71
Break-even live
UW: 25.0% down · 7.5% · 30yr · 1.5% tax · 5.0% vac · 8.0% maint · 8.0% mgmt
Financing live
Cash to close
- Down payment
- $34,225
- Closing costs
- $4,107
- Reserves months
- —
- Total cash needed
- —
Loan-product check · same deal, 3 products live
Conventional
25% down · 7.5% · 30yr
- Down + closing
- —
- Monthly P&I
- —
- Monthly cashflow
- —
- DSCR
- —
- Eligible?
- —
Personal DTI + credit; lowest rate.
DSCR
20% down · 8.5% · 30yr
- Down + closing
- —
- Monthly P&I
- —
- Monthly cashflow
- —
- DSCR
- —
- Eligible?
- —
No personal income docs; deal must DSCR.
Hard money
10% down · 12.0% · 12mo
- Down + closing
- —
- Monthly P&I
- —
- Monthly cashflow
- —
- DSCR
- —
- Eligible?
- —
Short-term bridge; refi at stabilization.
Listing history 9 events
-
2026-06-18days on market $136,900 Active 11 DOM
-
2026-06-17days on market $136,900 Active 10 DOM
-
2026-06-16days on market $136,900 Active 9 DOM
-
2026-06-15days on market $136,900 Active 8 DOM
-
2026-06-13days on market $136,900 Active 6 DOM
-
2026-06-12days on market $136,900 Active 5 DOM
-
2026-06-09days on market $136,900 Active 2 DOM
-
2026-06-08remarks 699-char remark
-
2026-06-08$136,900 Active 1 DOM
ⓘ Source: listings_history table (triggers on properties + properties_extension) + one-shot
backfill from property_details.listing_events for pre-trigger history.
Tax reassessment forecast IN · Partial reset (capped growth)
- Current annual tax
- $295 · $25/mo
- Projected year-2 tax
- $729 · $61/mo
- Expected delta
- +$434/yr (+$36/mo · 147.1%)
ⓘ Screening estimate from a state-policy table — verify with the county assessor before closing.
Climate risk First Street
- Flood 1/10 Low FEMA zone X (unshaded) · 0% chance over 30 yrs
- Wildfire 3/10 Moderate
- Heat 4/10 Moderate 7 d/yr ≥104°F today · 19 d/yr by 30 yrs out
- Wind 2/10 Low 100% chance of damaging wind over 30 yrs
- Air quality 2/10 Low 1 unhealthy d/yr today · 1 by 30 yrs out
Nearby sold comps map
Loading sold comps map…
Walkable amenities ~0.75 mi
Loading nearby amenities…
Taxation est. · year 1
- Rental income
- $13,230
- − Mortgage interest
- −$7,669
- − Property taxes
- −$295
- − Insurance
- −$684
- − Repairs & maintenance
- −$1,058
- − Management
- −$1,058
- − Depreciation
- −$3,983
- Taxable loss
- −$1,518
- Est. tax savings @ 24.0%
- +$364
- After-tax cash flow
- $1,221/yr
For passive investors: Depreciation is non-cash, so a rental often shows a tax loss while cash-flowing — sheltering income. Rental losses are passive: they offset passive income freely, and up to $25,000/yr can offset ordinary (W-2) income if you actively participate and your MAGI is under $100k (phasing out to $0 by $150k); unused losses carry forward. On sale, claimed depreciation is recaptured at up to 25%, and gains may owe capital-gains tax (a 1031 exchange can defer both). Figures are a year-1 estimate at your 24.0% rate — not tax advice; consult a CPA.
Schools (NCES district)
- District
- Shoals Community School Corporation
- NCES district ID
- 1810170
- Math proficiency
- 24% ▼ -9.00%
- Reading proficiency
- 34% ▼ -3.00%
- Median HH income
- $43,155
- Composite
- 24.69/100
- National rank
- #7614
- State rank
- #248 of 301 in IN
Livability — Shoals
- Score
- 62/100
- State rank
- #484
- US rank
- #17159
Category grades
Schools grade is shown separately in the Schools card above.
Census & demographics
- Population (ZIP)
- 2,828
Population outlook (Martin County) Hauer SSP2
- Today (2025)
- 9,585 people
- By 2030
- 9,198 · -4.0%
- By 2040
- 8,365 · -12.7%
- By 2050
- 7,518 · -21.6%
- By 2075
- 5,674 · -40.8%
- By 2100
- 3,916 · -59.1%
Race, ethnicity, and origin ACS 2023
- Neighborhood character
- Predominantly White (95%)
- Race & ethnicity
- White 95% Two or more races 4%
- Common ancestry
- Slovak 4% Iranian 3% Italian 2%
- Foreign-born
- 0%
- Languages at home
- 99% English-only · Spanish 1%
Political lean MEDSL · Martin
- 2024 margin
- Solid R (+60.7) · D 18.7% · R 79.4% · Other 1.9%
- 2008→2024 swing
- -31.8pp toward R · 2008: -28.9pp · 2024: -60.7pp
- All cycles
- 2024: R+60.7 2020: R+58.7 2016: R+58.5 2012: R+40.3 2008: R+28.9
Not yet ingested
- Civics
- —
Market trends
- HPI YoY
- ▲ 4.24%
- Current HPI
- 252.4425
- Rent YoY
- —
- Metro
- —
- State GDP YoY
- ▲ 2.90%
- F500 in state
- 18
Industry mix (Fortune 500 HQ in IN)
| Industry | F500 HQs | Revenue |
|---|---|---|
| Industrial Machinery | 2 | $37B |
|
||
| Healthcare | 1 | $177B |
|
||
| Pharmaceuticals | 1 | $45B |
|
||
| Metals / Steel | 1 | $18B |
|
||
| Agriculture | 1 | $17B |
|
||
| Packaging | 1 | $12B |
|
||
Price history
+291.1% since first listed2 events — show timeline
- 2026-06-08 Listed $136,900 IRMLS
- 2024-07-05 Sold (Public Records) $35,000 Public Records
Property tax history
+32.2%/yrLatest (2024): $295 · +0.3% YoY. Source: county tax records.
Cash-flow waterfall
monthlySold comps — $/sqft
last 12 mo · ≤1 miLoading sold comps…