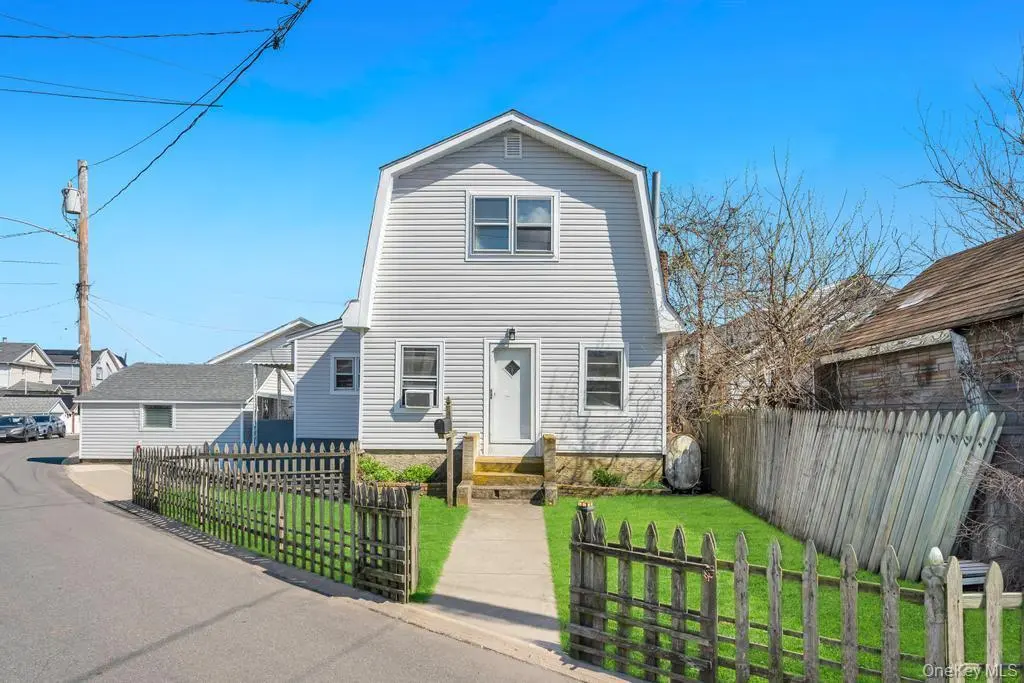
64 West Ave · Woodmere, NY
Flood risk 9/10 · Severe
- FEMA flood zone
- AE
- Chance of flooding over 30 yrs
- 0.99%
- Est. flood insurance / yr
- $1,737 – $8,500
Fire risk 1/10 · Minimal
- Est. fire insurance / yr
- $691 – $1,283
Heat risk 6/10 · Moderate
- Hot days now (above 95°F)
- 7 days/yr
- Hot days in 30 yrs
- 15 days/yr
Wind risk 6/10 · Moderate
- Chance of severe wind over 30 yrs
- 72.0%
Air-quality risk 4/10 · Minor
- Unhealthy air days now
- 4 days/yr
- Unhealthy air days in 30 yrs
- 6 days/yr
Risk factors via First Street. Map © Google.
Why this score? — see what drove the C- grade
The composite is a weighted blend of 9 inputs, each scored 0–100. Each bar is that input's sub-score; the figure is the points it added to the 100-point composite (weight × sub-score).
- ARV discount +15.0/15.0
- Cash flow +10.4/30.0
- Appreciation +10.0/10.0
- Schools +4.2/10.0
- Livability +4.1/5.0
- DSCR +3.0/10.0
- Rent growth +2.5/5.0
- Condition / age +2.5/5.0
- 1% rule +2.3/10.0
$729,000
🖨 Deal sheet 📄 Offer letter ✓ Due diligence
Listing remarks MLS
Charming Cape Cod–style 4-bedroom, 2-bathroom home offering a cozy and inviting layout. This well-maintained residence features bright living spaces with plenty of natural light and a comfortable flow throughout. Full of character and warmth, this home is perfect for everyday living and entertaining. Conveniently located near shopping, dining, and transportation. A wonderful opportunity to own a move-in ready home!All information including but not limited to taxes, lot size, square footage, permits, zoning, and property condition is deemed reliable but not guaranteed and must be independently verified by the buyers.
Key facts
- 2,900 sq ft lot
- Garage
- Built 1930
Neighborhood map
What this means for you Summary
Snapshot
- This is a 4-bed/1.5-bath single-family listed at $729k.
Deal economics
- At list price, monthly cash flow is $-814 ($-10k/yr) — negative.
- To cash-flow at today's rent, offer at most $585k (19.7% below list).
- To meet the 1% rule (rent ≥ 1% of price), the offer needs to be $532k (27.0% below list).
- Recommended offer: $532k (27.0% below list) — sets the bar for 1% rule.
- Cap rate 5.7% vs local median 2.4% in Woodmere — top-decile yield for the area; either an underpriced asset or a hidden risk that comps aren't pricing in. Stress-test before assuming the spread holds.
Location & tenants
- Location reads 82/100 on livability (#76 in NY, #1,189 nationally) — a professional / high-income tenant draw. Strengths: schools A+, crime A+, commute A+; Watch: cost of living F.
- Lawrence Union Free School District (suburban): math 43% / reading 46% proficiency, ranked #399 of 590 in NY (top 68%) — families likely to look elsewhere, expect single-tenant / working-renter base with shorter leases.
- Market conditions: 53 active listings in the ZIP; 7 comparable units currently listed for rent nearby; rentals leasing fast (median 13d on market — plan ~1-2 weeks tenant-placement turnaround); 824 units permitted in Nassau County in 2024 (153 in 5+ unit buildings).
Forward outlook
- In year one you build about $78k of equity ($5k loan paydown + $73k appreciation (10.0% local appreciation)).
- Nassau County population projected at +7% by 2050 — modest demand growth; plan on rents tracking national, not racing it.
- By year 2, paydown + projected appreciation supports a ~$125k cash-out refi (75% LTV) — recoverable capital for the next deal without selling this one.
Negotiation context
- It's been on market 58 days — a 3% lower offer ($707k) is reasonable based on typical stale-listing flexibility.
- 5 sale attempts since 11y ago with the ask held roughly flat each time — persistent listings suggest the price (not the market) is what's stuck; bring a comps-based counter.
- Current owner paid $415k; list at $729k implies a 76% gain — meaningful room to come down on a strong offer.
Risks & watch-outs
- Watch-outs: flood insurance adds $427/mo; built in 1930 — expect roof / HVAC / electrical / plumbing capex.
- Climate carrying-cost: in FEMA flood zone AE (mandatory federal flood insurance); major wind risk, 72% chance of damaging wind over 30y; extreme-heat days projected 7→15/yr by 2055 (HVAC capex compounding) — expect insurance premiums to compound above CPI over the hold.
Questions for the listing agent
- What do current leases actually rent for vs. the listed asking? Can we see a recent rent roll and the last 12 months of T-12 income?
- It's been on market 58 days. Have you received any prior offers? Is the seller open to a 27% concession, seller financing, or rate buy-down credit?
- Built in 1930 — when were the roof, HVAC, electrical panel, plumbing, and water heater last replaced?
- What's the actual annual flood-insurance premium (NFIP or private), and is the property in a SFHA with mandatory coverage?
- Is there a deadline driving the sale (1031 exchange, divorce, estate, relocation)? That informs how much negotiation room exists.
- Schools are A-rated — typically a magnet for longer-tenancy family renters. What's the average tenant stay here, and is there a school-zone premium baked into asking?
- What's the average days-on-market for RENTAL listings here right now (not sales)? A rising rental-DOM trend means longer vacancies and softer asking-rent achievability than the comps imply.
- What's the recent tenant-quality profile in this submarket — average credit score on applications, eviction rate, late-payment / NSF rate, and stable-employment percentage? A property-management company in the area should have these aggregated.
- How much new for-sale + rental construction is in the pipeline within 1–3 miles? Heavy new supply typically softens prices + rents 12–24 months out; constrained supply supports both.
Investment metrics
- 1% rule
- 0.73% ✗
- Cap rate
- 5.66%
- Cash-on-cash
- -2.28%
- DSCR
- 0.90
- GRM
- 11.4
CMA / ARV
- ARV (median comp)
- $882,431
- List price
- $729,000
- Delta
- -17.39%
- Verdict
- UNDERPRICED
- Comps
- 12 within 1.0 mi
Show comp detail 3 sales within ~0.75 mi
| Address | Dist | Beds/Ba | Sqft | Sold | Price | $/sf | Match |
|---|---|---|---|---|---|---|---|
| 17 West Ave | 0.11mi | 3/2.0 (-1) | 1,392 (-3%) | 14mo | $712,000 | $511 | 71 |
| 19 West Ave | 0.11mi | 4/1.0 | 1,595 (+11%) | 11mo | $720,000 | $451 | 66 |
| 482 Harbor Dr | 0.59mi | 4/2.5 | 1,652 (+15%) | 18mo | $905,000 | $548 | 28 |
Match score weights: distance 35% · size 25% · config 20% · recency 20%. Top-matched comps best support the ARV.
Projected returns pro-forma
10.0% appreciation · 3.0% rent growth · sell at horizon
- IRR
- 20.9%
- Equity multiple
- 2.69×
- Total profit
- $345,282
- Equity at exit
- $656,741
- IRR
- 19.0%
- Equity multiple
- 6.18×
- Total profit
- $1,057,684
- Equity at exit
- $1,416,287
Cash invested: $204,120 (down + closing). Projections, not guarantees.
Landlord ↔ Tenant lean methodology
- Overall (STATE)
- 15 Strongly Tenant-Friendly
- State New York
- 15 Strongly Tenant-Friendly · D+10
- County
- — inherits STATE
- City
- — inherits STATE
ZIP-level market 11559
- Home prices YoY
- 4.1%
- Active inventory
- 53
- Price-to-rent
- 11.4×
Monthly cashflow live
- Estimated rent
- $5,322 high interval (Pro) →
- Mortgage (P&I)
- −$3,823
- Tax from tax record
- −$465 /mo · $5,577/yr
- Insurance
- −$304
- Flood insurance flood zone
- −$427 /mo · $5,118/yr
- HOA
- −$0
- Vacancy / Maint / Mgmt
- −$1,118
- Net cashflow
- $-814
Break-even live
UW: 25.0% down · 7.5% · 30yr · 1.5% tax · 5.0% vac · 8.0% maint · 8.0% mgmt
Financing live
Cash to close
- Down payment
- $182,250
- Closing costs
- $21,870
- Reserves months
- —
- Total cash needed
- —
Loan-product check · same deal, 3 products live
Conventional
25% down · 7.5% · 30yr
- Down + closing
- —
- Monthly P&I
- —
- Monthly cashflow
- —
- DSCR
- —
- Eligible?
- —
Personal DTI + credit; lowest rate.
DSCR
20% down · 8.5% · 30yr
- Down + closing
- —
- Monthly P&I
- —
- Monthly cashflow
- —
- DSCR
- —
- Eligible?
- —
No personal income docs; deal must DSCR.
Hard money
10% down · 12.0% · 12mo
- Down + closing
- —
- Monthly P&I
- —
- Monthly cashflow
- —
- DSCR
- —
- Eligible?
- —
Short-term bridge; refi at stabilization.
Rent comps 7 comps
| Address | Beds | Baths | Sqft | Rent | $/sqft | DOM | Units | Dist |
|---|---|---|---|---|---|---|---|---|
| 482 Harbor Dr Cedarhurst, NY | 4.0 | 2.5 | 1652 | $7,495 | $4.54 | 19d | 1 | 0.59mi |
| 324 Buckingham Rd Cedarhurst, NY | 3.0 | 2.0 | 1583 | $7,000 | $4.42 | 13d | 1 | 0.88mi |
| 256-20 Craft Ave Unit 2nd Floor Jamaica, NY | 3.0 | 2.0 | 1250 | $3,200 | $2.56 | 11d | 1 | 1.08mi |
| 238-23 148th Dr Unit 1st Floor Jamaica, NY | 3.0 | 1.5 | 1435 | $3,500 | $2.44 | 19d | 1 | 1.14mi |
| 245-33 147th Rd Unit 2 Jamaica, NY | 4.0 | 2.0 | 1000 | $4,300 | $4.30 | 19d | 1 | 1.38mi |
| 245-33 147th Rd Unit 1 Jamaica, NY | 4.0 | 2.0 | 1000 | $4,300 | $4.30 | 1d | 1 | 1.38mi |
| 120 Maple Ave Unit 2nd FLOOR Cedarhurst, NY | 3.0 | 2.0 | 1150 | $4,275 | $3.72 | 11d | 1 | 1.43mi |
Listing history 27 events
-
2026-06-18days on market $729,000 Active 58 DOM
-
2026-06-17days on market $729,000 Active 57 DOM
-
2026-06-16days on market $729,000 Active 56 DOM
-
2026-06-15days on market $729,000 Active 55 DOM
-
2026-06-13days on market $729,000 Active 53 DOM
-
2026-06-13days on market $729,000 Active 52 DOM
-
2026-06-09days on market $729,000 Active 49 DOM
-
2026-06-08days on market $729,000 Active 48 DOM
-
2026-06-07days on market $729,000 Active 47 DOM
-
2026-06-04days on market $729,000 Active 44 DOM
-
2026-06-03days on market $729,000 Active 43 DOM
-
2026-06-02days on market $729,000 Active 42 DOM
-
2026-06-01days on market $729,000 Active 41 DOM
-
2026-05-31days on market $729,000 Active 40 DOM
-
2026-04-21$729,000 Active 629-char remark
Show marketing remark (629 chars)
Charming Cape Cod–style 4-bedroom, 2-bathroom home offering a cozy and inviting layout. This well-maintained residence features bright living spaces with plenty of natural light and a comfortable flow throughout. Full of character and warmth, this home is perfect for everyday living and entertaining. Conveniently located near shopping, dining, and transportation. A wonderful opportunity to own a move-in ready home!All information including but not limited to taxes, lot size, square footage, permits, zoning, and property condition is deemed reliable but not guaranteed and must be independently verified by the buyers.
-
2026-01-02historical
-
2025-11-07$659,000 Active
-
2023-12-21soldstatus $415,000
-
2023-12-08soldstatus $415,000 Closed
-
2023-10-04status Pending
-
2023-06-28status Active
-
2023-02-23status Pending
-
2023-01-05$399,000 Active
-
2016-05-06historical
-
2015-09-17$250,000
-
2007-10-03soldstatus $360,000
-
2001-11-05soldstatus $192,000
ⓘ Source: listings_history table (triggers on properties + properties_extension) + one-shot
backfill from property_details.listing_events for pre-trigger history.
Tax reassessment forecast NY · Partial reset (capped growth)
- Current annual tax
- $5,577 · $465/mo
- Projected year-2 tax
- $8,948 · $746/mo
- Expected delta
- +$3,372/yr (+$281/mo · 60.5%)
ⓘ Screening estimate from a state-policy table — verify with the county assessor before closing.
Climate risk First Street
- Flood 9/10 Extreme FEMA zone AE · 99% chance over 30 yrs
- Wildfire 1/10 Low
- Heat 6/10 Major 7 d/yr ≥95°F today · 15 d/yr by 30 yrs out
- Wind 6/10 Major 72% chance of damaging wind over 30 yrs
- Air quality 4/10 Moderate 4 unhealthy d/yr today · 6 by 30 yrs out
Nearby sold comps map
Loading sold comps map…
Walkable amenities ~0.75 mi
Loading nearby amenities…
Taxation est. · year 1
- Rental income
- $63,864
- − Mortgage interest
- −$40,835
- − Property taxes
- −$5,577
- − Insurance
- −$8,764
- − Repairs & maintenance
- −$5,109
- − Management
- −$5,109
- − Depreciation
- −$21,207
- Taxable loss
- −$22,737
- Est. tax savings @ 24.0%
- +$5,457
- After-tax cash flow
- $-4,306/yr
For passive investors: Depreciation is non-cash, so a rental often shows a tax loss while cash-flowing — sheltering income. Rental losses are passive: they offset passive income freely, and up to $25,000/yr can offset ordinary (W-2) income if you actively participate and your MAGI is under $100k (phasing out to $0 by $150k); unused losses carry forward. On sale, claimed depreciation is recaptured at up to 25%, and gains may owe capital-gains tax (a 1031 exchange can defer both). Figures are a year-1 estimate at your 24.0% rate — not tax advice; consult a CPA.
Schools (NCES district)
- District
- Lawrence Union Free School District
- NCES district ID
- 3616830
- Math proficiency
- 43% ▼ -2.00%
- Reading proficiency
- 46% ▼ -8.00%
- Median HH income
- $91,008
- Composite
- 42.14/100
- National rank
- #3307
- State rank
- #399 of 590 in NY
Livability — Woodmere
- Score
- 82/100
- State rank
- #76
- US rank
- #1189
Category grades
Schools grade is shown separately in the Schools card above.
Census & demographics
- Census place
- Woodmere, NY
- City population
- 14,316
- Population (ZIP)
- 9,130
Population outlook (Nassau County) Hauer SSP2
- Today (2025)
- 1,409,302 people
- By 2030
- 1,431,482 · +1.6%
- By 2040
- 1,471,607 · +4.4%
- By 2050
- 1,502,845 · +6.6%
- By 2075
- 1,575,403 · +11.8%
- By 2100
- 1,554,356 · +10.3%
Race, ethnicity, and origin ACS 2023
- Neighborhood character
- Predominantly White (76%)
- Race & ethnicity
- White 76% Hispanic / Latino 17% Black 5% Two or more races 2% Asian 2%
- Hispanic origin (detail)
- Puerto Rican 3% Dominican 2%
- Common ancestry
- Romanian 19% Slovak 3% Hispanic 3%
- Foreign-born
- 20% · Canada
- Languages at home
- 67% English-only · Spanish 11% French/Haitian/Cajun 4% Russian/Polish/Slavic 3%
Political lean MEDSL · Nassau
- 2024 margin
- Toss-up / Even · D 47.9% · R 52.1%
- 2008→2024 swing
- -12.6pp toward R · 2008: 8.4pp · 2024: -4.2pp
- All cycles
- 2024: R+4.2 2020: D+9.5 2016: D+5.3 2012: D+6.7 2008: D+8.4
Not yet ingested
- Civics
- —
Market trends
- HPI YoY
- ▲ 17.24%
- Current HPI
- 436.7253
- Rent YoY
- —
- Metro
- —
- State GDP YoY
- ▲ 2.60%
- F500 in state
- 92
Industry mix (Fortune 500 HQ in NY)
| Industry | F500 HQs | Revenue |
|---|---|---|
| Financial Services | 10 | $950B |
|
||
| Consumer Goods | 9 | $162B |
|
||
| Insurance | 4 | $225B |
|
||
| Telecommunications | 2 | $144B |
|
||
| Pharmaceuticals | 2 | $112B |
|
||
| Media / Entertainment | 2 | $69B |
|
||
Price history
+279.7% since first listed13 events — show timeline
- 2026-04-21 Listed $729,000 OneKey® MLS as Distributed by MLS Grid
- 2026-01-02 Listing Removed — OneKey® MLS as Distributed by MLS Grid
- 2025-11-07 Listed $659,000 OneKey® MLS as Distributed by MLS Grid
- 2023-12-21 Sold (Public Records) $415,000 Public Records
- 2023-12-08 Sold (MLS) $415,000 OneKey® MLS as Distributed by MLS Grid
- 2023-10-04 Pending — OneKey® MLS as Distributed by MLS Grid
- 2023-06-28 Relisted — OneKey® MLS as Distributed by MLS Grid
- 2023-02-23 Pending — OneKey® MLS as Distributed by MLS Grid
- 2023-01-05 Listed $399,000 OneKey® MLS as Distributed by MLS Grid
- 2016-05-06 Listing Removed — OneKey® MLS as Distributed by MLS Grid
- 2015-09-17 Listed $250,000 OneKey® MLS as Distributed by MLS Grid
- 2007-10-03 Sold (Public Records) $360,000 Public Records
- 2001-11-05 Sold (Public Records) $192,000 Public Records
Property tax history
+1.3%/yrLatest (2024): $5,577 · -5.1% YoY. Source: county tax records.
Cash-flow waterfall
monthlySold comps — $/sqft
last 12 mo · ≤1 miLoading sold comps…