 Duplex
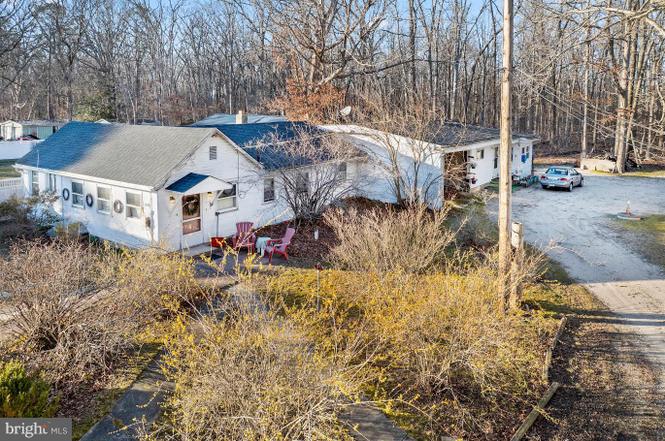
1244 Garry Ave · Vineland, NJ
Flood risk 1/10 · Minimal
- FEMA flood zone
- X (unshaded)
- Chance of flooding over 30 yrs
- 0.0%
- Est. flood insurance / yr
- $507 – $1,088
Fire risk 5/10 · Moderate
- Est. fire insurance / yr
- $526 – $976
Heat risk 6/10 · Moderate
- Hot days now (above 102°F)
- 7 days/yr
- Hot days in 30 yrs
- 14 days/yr
Wind risk 6/10 · Moderate
- Chance of severe wind over 30 yrs
- 71.0%
Air-quality risk 3/10 · Minor
- Unhealthy air days now
- 3 days/yr
- Unhealthy air days in 30 yrs
- 5 days/yr
Risk factors via First Street. Map © Google.
Why this score? — see what drove the B- grade
The composite is a weighted blend of 9 inputs, each scored 0–100. Each bar is that input's sub-score; the figure is the points it added to the 100-point composite (weight × sub-score).
- Cash flow +30.0/30.0
- 1% rule +10.0/10.0
- DSCR +10.0/10.0
- ARV discount +7.5/15.0
- Livability +3.3/5.0
- Rent growth +2.5/5.0
- Condition / age +2.5/5.0
- Schools +1.9/10.0
- Appreciation +0.0/10.0
$245,000
🖨 Deal sheet (PDF) 📄 Offer letter ✓ Due diligence
Multi-family units
County records classify this as Multi-Family (2-4 Unit). Listing-text estimate: 2 units. confirmed
Listing remarks MLS
No rental info-used w/ in family. Many improvements & updates, call for details. Appliances/furniture negotiable. Unit 1 has oil radiant heat, Unit 2 has electric heat. Separate utility rooms. Undergrnd tank not used since 1980.
Key facts
- 0.53 acre lot
- 6 parking spots
- Built 1955
Property features AI
Finance
- Other: Building has 1 total unit listed in building info; Above-grade finished area approximately 1,728
- Financial info: Existing leases may be long-term, yearly, or month-to-month; Two units currently leased, two units vacant
Exterior
- Parking: Total of 6 parking spaces; Driveway with 3 spaces; 3 off-street spaces
- Utilities: Public water; On-site septic
- Home design: Semi-detached structure; Fee simple ownership
- Construction: Foundation: Other; Building not winterized
- Exterior features: Lot dimensions approximately 100 x 231; No tidal water; Other above- and below-grade structures noted
Interior
- Bedrooms: One 1‑bedroom unit; One 2‑bedroom unit
- Heating & cooling: Heating: Other; Heating fuel: Oil and Electric; Electric hot water
- Interior features: Two or more access exits
Neighborhood map
What this means for you Summary
Snapshot
- This is a 2 × 3-bed/2.0-bath units multifamily listed at $245k.
Deal economics
- At list price, monthly cash flow is $1k ($14k/yr) — positive. Per door: $576/mo.
- The deal already cash-flows at list — no discount required.
- Meets the 1% rule at list price ($4k rent vs $245k).
- Recommended offer: $216k (12.0% below list) — sets the bar for market timing.
- Cap rate 11.9% vs local median 4.5% in Vineland — top-decile yield for the area; either an underpriced asset or a hidden risk that comps aren't pricing in. Stress-test before assuming the spread holds.
Location & tenants
- Location reads 66/100 on livability (#363 in NJ) — a middle-class / working-renter tenant base. Strengths: housing A+, health & safety A+; Watch: employment D+, schools D, crime F.
- Vineland Public School District (urban): math 9% / reading 34% proficiency, ranked #418 of 472 in NJ (top 89%) — low school quality limits family demand, transient renter base, plan for 1-2y turnover.
- Market conditions: 87 active listings in the ZIP; 216 units permitted in Cumberland County in 2024 (73 in 5+ unit buildings).
Forward outlook
- Local home prices are declining (-3.0%/yr); year-one equity from $2k of loan paydown is wiped out by about $7k of value loss. Plan a longer hold.
- Cumberland County population projected to shrink 7% by 2050 — rents likely to lag national; underwrite the cash flow, not the appreciation.
- At projected returns (-3.0% appreciation + 3.0% rent growth), your $69k cash investment doubles in ~7 years — after that, you're playing with house money.
Negotiation context
- It's been on market 170 days — a 12% lower offer ($216k) is reasonable based on typical stale-listing flexibility.
- 2 sale attempts since 23y ago; this cycle's ask has dropped $20k (8%) from the opening price — seller is motivated, your offer sets the floor, not the list.
- Current owner paid $95k; list at $245k implies a 158% gain — meaningful room to come down on a strong offer.
Risks & watch-outs
- Watch-outs: built in 1955 — expect roof / HVAC / electrical / plumbing capex.
- Climate carrying-cost: major wind risk, 71% chance of damaging wind over 30y; moderate wildfire risk; extreme-heat days projected 7→14/yr by 2055 (HVAC capex compounding) — expect insurance premiums to compound above CPI over the hold.
Questions for the listing agent
- It's been on market 170 days. Have you received any prior offers? Is the seller open to a 12% concession, seller financing, or rate buy-down credit?
- Can we see the unit-by-unit rent roll, current vacancy, and any below-market leases? What's the average tenancy length?
- What capital expenditures (roof, boiler, parking lot, exteriors) have been made in the last 5 years, and what's planned in the next 2?
- Built in 1955 — when were the roof, HVAC, electrical panel, plumbing, and water heater last replaced?
- Why hasn't it sold? Are there any deal-killer items the seller is aware of (foundation, flood, title, zoning, code violations)?
- Is there a deadline driving the sale (1031 exchange, divorce, estate, relocation)? That informs how much negotiation room exists.
- Schools are D-rated, which usually means shorter tenancies and higher turnover. Who's the typical renter profile here, and what's been the actual vacancy rate?
- Crime grade is F in this area — have there been break-ins, vandalism, or insurance claims at this property in the last 3 years? What carrier currently insures it and at what premium?
- What's the average days-on-market for RENTAL listings here right now (not sales)? A rising rental-DOM trend means longer vacancies and softer asking-rent achievability than the comps imply.
- What's the recent tenant-quality profile in this submarket — average credit score on applications, eviction rate, late-payment / NSF rate, and stable-employment percentage? A property-management company in the area should have these aggregated.
- How much new apartment / multifamily construction is in the pipeline within 1–3 miles? Heavy new supply (>2% of stock underway) typically softens rents 12–24 months out; light construction supports rent growth.
Investment metrics
- 1% rule
- 1.51% ✓
- Cap rate
- 11.93%
- Cash-on-cash
- 20.13%
- DSCR
- 1.90
- GRM
- 5.5
CMA / ARV
No comps found within radius.
Projected returns pro-forma
-3.0% appreciation · 3.0% rent growth · sell at horizon
- IRR
- 12.4%
- Equity multiple
- 1.49×
- Total profit
- $33,714
- Equity at exit
- $36,530
- IRR
- 21.3%
- Equity multiple
- 2.81×
- Total profit
- $124,186
- Equity at exit
- $21,183
Cash invested: $68,600 (down + closing). Projections, not guarantees.
Landlord ↔ Tenant lean methodology
- Overall (STATE)
- 21 Tenant-Leaning
- State New Jersey
- 21 Tenant-Leaning · D+6
- County
- — inherits STATE
- City
- — inherits STATE
ZIP-level market 08361
- Active inventory
- 87
- Price-to-rent
- 11.0×
Monthly cashflow live
- Estimated rent
- $3,704 medium interval (Pro) →
- Mortgage (P&I)
- −$1,285
- Tax from tax record
- −$388 /mo · $4,659/yr
- Insurance
- −$102
- HOA
- −$0
- Vacancy / Maint / Mgmt
- −$778
- Net cashflow
- $1,151
Break-even live
Sensitivity live
| Price | -10% $1,290 | -5% $1,220 | +0% $1,151 | +5% $1,082 | +10% $1,012 |
|---|---|---|---|---|---|
| Rent | -10% $858 | -5% $1,005 | +0% $1,151 | +5% $1,297 | +10% $1,444 |
| Rate | -1.0pp $1,274 | -0.5pp $1,213 | base $1,151 | +0.5pp $1,088 | +1.0pp $1,023 |
2-unit breakdown (identical units grouped — click to expand)
| Units | Beds | Baths | Est. rent |
|---|---|---|---|
| 2× units | 3 | 2 | $3,704 |
| #1 | 3 | 2 | $1,852 |
| #2 | 3 | 2 | $1,852 |
| Total (2 units) | $3,704 | ||
UW: 25.0% down · 7.5% · 30yr · 1.5% tax · 5.0% vac · 8.0% maint · 8.0% mgmt
Financing live
Cash to close
- Down payment
- $61,250
- Closing costs
- $7,350
- Reserves months
- —
- Total cash needed
- —
Loan-product check · same deal, 3 products live
Conventional
25% down · 7.5% · 30yr
- Down + closing
- —
- Monthly P&I
- —
- Monthly cashflow
- —
- DSCR
- —
- Eligible?
- —
Personal DTI + credit; lowest rate.
DSCR
20% down · 8.5% · 30yr
- Down + closing
- —
- Monthly P&I
- —
- Monthly cashflow
- —
- DSCR
- —
- Eligible?
- —
No personal income docs; deal must DSCR.
Hard money
10% down · 12.0% · 12mo
- Down + closing
- —
- Monthly P&I
- —
- Monthly cashflow
- —
- DSCR
- —
- Eligible?
- —
Short-term bridge; refi at stabilization.
Listing history 11 events
-
2026-06-19days on market $245,000 Active 170 DOM
-
2026-06-18status $245,000 Active 169 DOM
-
2026-06-07status $245,000 Pending 169 DOM
-
2026-05-18historical Active Under Contract
-
2026-03-12price $245,000
-
2025-12-01$265,000 Active
-
2025-11-17historical $265,000
-
2003-10-30soldstatus $95,000 234-char remark
Show marketing remark (234 chars)
No rental info-used w/ in family. Many improvements & updates, call for details. Appliances/furniture negotiable. Unit 1 has oil radiant heat, Unit 2 has electric heat. Separate utility rooms. Undergrnd tank not used since 1980.
-
2003-10-03soldstatus $95,000
-
2003-04-07historical 234-char remark
Show marketing remark (234 chars)
No rental info-used w/ in family. Many improvements & updates, call for details. Appliances/furniture negotiable. Unit 1 has oil radiant heat, Unit 2 has electric heat. Separate utility rooms. Undergrnd tank not used since 1980.
-
2003-04-01$99,700 234-char remark
Show marketing remark (234 chars)
No rental info-used w/ in family. Many improvements & updates, call for details. Appliances/furniture negotiable. Unit 1 has oil radiant heat, Unit 2 has electric heat. Separate utility rooms. Undergrnd tank not used since 1980.
ⓘ Source: listings_history table (triggers on properties + properties_extension) + one-shot
backfill from property_details.listing_events for pre-trigger history.
Tax reassessment forecast NJ · Partial reset (capped growth)
- Current annual tax
- $4,659 · $388/mo
- Projected year-2 tax
- $5,380 · $448/mo
- Expected delta
- +$721/yr (+$60/mo · 15.5%)
ⓘ Screening estimate from a state-policy table — verify with the county assessor before closing.
Climate risk First Street
- Flood 1/10 Low FEMA zone X (unshaded) · 0% chance over 30 yrs
- Wildfire 5/10 Major
- Heat 6/10 Major 7 d/yr ≥102°F today · 14 d/yr by 30 yrs out
- Wind 6/10 Major 71% chance of damaging wind over 30 yrs
- Air quality 3/10 Moderate 3 unhealthy d/yr today · 5 by 30 yrs out
Nearby sold comps map
Loading sold comps map…
Walkable amenities ~0.75 mi
Loading nearby amenities…
Taxation est. · year 1
- Rental income
- $44,448
- − Mortgage interest
- −$13,724
- − Property taxes
- −$4,659
- − Insurance
- −$1,225
- − Repairs & maintenance
- −$3,556
- − Management
- −$3,556
- − Depreciation
- −$7,127
- Taxable income
- $10,601
- Est. tax owed @ 24.0%
- −$2,544
- After-tax cash flow
- $11,268/yr
For passive investors: Depreciation is non-cash, so a rental often shows a tax loss while cash-flowing — sheltering income. Rental losses are passive: they offset passive income freely, and up to $25,000/yr can offset ordinary (W-2) income if you actively participate and your MAGI is under $100k (phasing out to $0 by $150k); unused losses carry forward. On sale, claimed depreciation is recaptured at up to 25%, and gains may owe capital-gains tax (a 1031 exchange can defer both). Figures are a year-1 estimate at your 24.0% rate — not tax advice; consult a CPA.
Schools (NCES district)
- District
- Vineland Public School District
- NCES district ID
- 3416800
- Math proficiency
- 9% ▼ -17.00%
- Reading proficiency
- 34% ▬ 0.00%
- Median HH income
- $51,168
- Composite
- 19.17/100
- National rank
- #8819
- State rank
- #418 of 472 in NJ
Livability — Vineland
- Score
- 66/100
- State rank
- #363
- US rank
- #12180
Category grades
Schools grade is shown separately in the Schools card above.
Census & demographics
- Census place
- Vineland, NJ
- City population
- 45,038
- Population (ZIP)
- 18,375
Population outlook (Cumberland County) Hauer SSP2
- Today (2025)
- 152,743 people
- By 2030
- 150,373 · -1.6%
- By 2040
- 146,881 · -3.8%
- By 2050
- 142,653 · -6.6%
- By 2075
- 129,468 · -15.2%
- By 2100
- 107,456 · -29.6%
Race, ethnicity, and origin ACS 2023
- Neighborhood character
- Diverse neighborhood (Simpson 0.59)
- Race & ethnicity
- White 57% Hispanic / Latino 27% Two or more races 13% Black 10% Asian 3% Native American 2%
- Hispanic origin (detail)
- Mexican 2% Puerto Rican 20% Dominican 3%
- Common ancestry
- Romanian 2% Scotch-Irish 2% Subsaharan African 2%
- Foreign-born
- 9% · Canada
- Languages at home
- 75% English-only · Spanish 16% Other Indo-European 4% Russian/Polish/Slavic 2%
Political lean MEDSL · Cumberland
- 2024 margin
- Toss-up / Even · D 47.6% · R 51.3% · Other 1.1%
- 2008→2024 swing
- -25.4pp toward R · 2008: 21.6pp · 2024: -3.8pp
- All cycles
- 2024: R+3.8 2020: D+6.0 2016: D+5.3 2012: D+23.1 2008: D+21.6
Not yet ingested
- Civics
- —
Market trends
- HPI YoY
- ▼ -215.80%
- Current HPI
- 291.3404
- Rent YoY
- —
- Metro
- —
- State GDP YoY
- ▲ 2.05%
- F500 in state
- 34
Industry mix (Fortune 500 HQ in NJ)
| Industry | F500 HQs | Revenue |
|---|---|---|
| Consumer Goods | 3 | $31B |
|
||
| Pharmaceuticals | 2 | $153B |
|
||
| Technology | 2 | $21B |
|
||
| Insurance | 2 | $20B |
|
||
| Healthcare | 2 | $19B |
|
||
| Financial Services | 1 | $70B |
|
||
Price history
+145.7% since first listed8 events — show timeline
- 2026-05-18 Contingent — BRIGHT MLS
- 2026-03-12 Price Changed $245,000 BRIGHT MLS
- 2025-12-01 Listed $265,000 BRIGHT MLS
- 2025-11-17 Coming Soon $265,000 BRIGHT MLS
- 2003-10-30 Sold (MLS) $95,000 SJSRMLS
- 2003-10-03 Sold (Public Records) $95,000 Public Records
- 2003-04-07 Listing Removed — SJSRMLS
- 2003-04-01 Listed $99,700 SJSRMLS
Property tax history
+3.2%/yrLatest (2025): $4,659 · +3.9% YoY. Source: county tax records.
Cash-flow waterfall
monthlySold comps — $/sqft
last 12 mo · ≤1 miLoading sold comps…