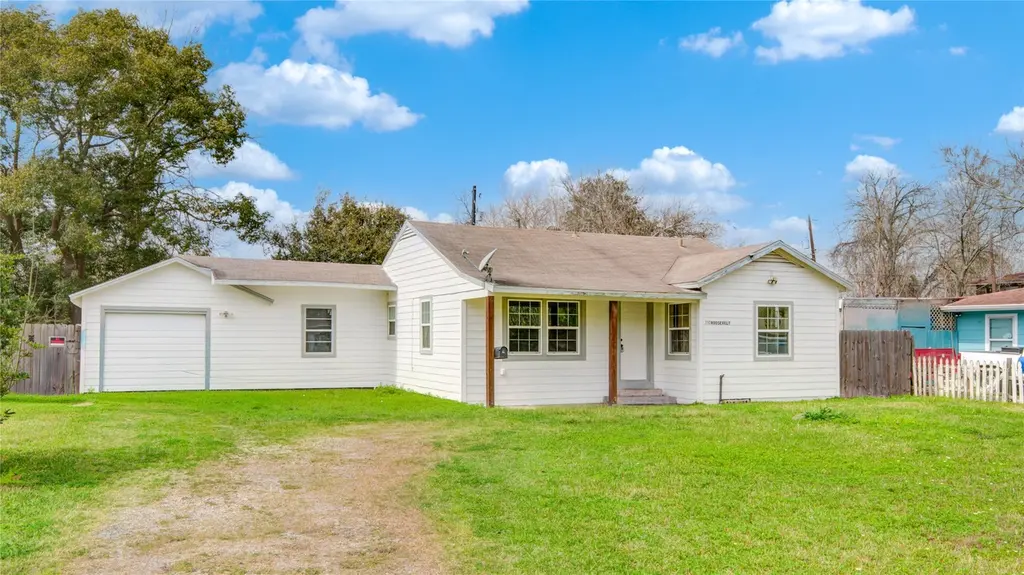
710 Roosevelt St · La Marque, TX
Flood risk 7/10 · Major
- FEMA flood zone
- X (shaded)
- Chance of flooding over 30 yrs
- 0.59%
- Est. flood insurance / yr
- $507 – $1,088
Fire risk 1/10 · Minimal
- Est. fire insurance / yr
- $1,222 – $2,270
Heat risk 10/10 · Severe
- Hot days now (above 110°F)
- 7 days/yr
- Hot days in 30 yrs
- 27 days/yr
Wind risk 10/10 · Severe
- Chance of severe wind over 30 yrs
- 99.0%
Air-quality risk 3/10 · Minor
- Unhealthy air days now
- 2 days/yr
- Unhealthy air days in 30 yrs
- 2 days/yr
Risk factors via First Street. Map © Google.
Why this score? — see what drove the D grade
The composite is a weighted blend of 9 inputs, each scored 0–100. Each bar is that input's sub-score; the figure is the points it added to the 100-point composite (weight × sub-score).
- ARV discount +12.5/15.0
- Cash flow +12.2/30.0
- 1% rule +4.2/10.0
- DSCR +3.6/10.0
- Rent growth +3.5/5.0
- Livability +3.0/5.0
- Condition / age +2.5/5.0
- Schools +2.4/10.0
- Appreciation +0.0/10.0
$149,000
🖨 Deal sheet (PDF) 📄 Offer letter ✓ Due diligence
Listing remarks MLS
A welcoming 2-bedroom home that blends comfort with practical everyday living. The layout opens into a bright main living area with enough space for relaxing. The kitchen is fully equipped with a dishwasher, generous counter space, and cabinetry that makes cooking easy. Both bedrooms offer comfortable proportions and natural light, making them ideal for sleeping, working, or creating a personalized retreat. One standout feature is the indoor utility room, conveniently located to keep laundry and household tasks out of sight while still easily accessible. Schedule your showing today!
Key facts
- Main living area
- Indoor utility room
- 8,768 sq ft lot
Tags
Neighborhood map
What this means for you Summary
Snapshot
- This is a 2-bed/1.0-bath single-family listed at $149k.
Deal economics
- At list price, monthly cash flow is $-96 ($-1k/yr) — negative.
- To cash-flow at today's rent, offer at most $132k (11.3% below list).
- To meet the 1% rule (rent ≥ 1% of price), the offer needs to be $137k (8.1% below list).
- Recommended offer: $132k (11.3% below list) — sets the bar for cash-flow.
Location & tenants
- Location reads 59/100 on livability (#1,136 in TX) — a working-class tenant base; expect higher turnover. Strengths: cost of living A+, housing A+; Watch: employment D, schools F, crime F.
- Texas City ISD (suburban): math 28% / reading 29% proficiency, ranked #655 of 826 in TX (top 79%) — low school quality limits family demand, transient renter base, plan for 1-2y turnover; 66% free/reduced lunch — lower-income household profile, screen leases tightly.
- Market conditions: Rents rising (+4.0%/yr); 661 active listings in the ZIP; 14 comparable units currently listed for rent nearby; rentals at typical pace (median 26d on market — plan ~3-4 weeks tenant-placement turnaround); 3,258 units permitted in Galveston County in 2024 (0 in 5+ unit buildings).
Forward outlook
- Local home prices are declining (-3.0%/yr); year-one equity from $1k of loan paydown is wiped out by about $4k of value loss. Plan a longer hold.
- Galveston County population projected at +43% by 2050 — long-run rental-demand tailwind backs the buy-and-hold thesis.
Negotiation context
- It's been on market 108 days — a 9% lower offer ($136k) is reasonable based on typical stale-listing flexibility.
- 2 sale attempts since 4y ago with the ask held roughly flat each time — persistent listings suggest the price (not the market) is what's stuck; bring a comps-based counter.
Risks & watch-outs
- Watch-outs: flood insurance adds $66/mo; built in 1950 — expect roof / HVAC / electrical / plumbing capex.
- Climate carrying-cost: major flood risk; severe wind risk, 99% chance of damaging wind over 30y; extreme-heat days projected 7→27/yr by 2055 (HVAC capex compounding) — expect insurance premiums to compound above CPI over the hold.
Questions for the listing agent
- What do current leases actually rent for vs. the listed asking? Can we see a recent rent roll and the last 12 months of T-12 income?
- It's been on market 108 days. Have you received any prior offers? Is the seller open to a 11% concession, seller financing, or rate buy-down credit?
- Built in 1950 — when were the roof, HVAC, electrical panel, plumbing, and water heater last replaced?
- What's the actual annual flood-insurance premium (NFIP or private), and is the property in a SFHA with mandatory coverage?
- Why hasn't it sold? Are there any deal-killer items the seller is aware of (foundation, flood, title, zoning, code violations)?
- Is there a deadline driving the sale (1031 exchange, divorce, estate, relocation)? That informs how much negotiation room exists.
- Schools are F-rated, which usually means shorter tenancies and higher turnover. Who's the typical renter profile here, and what's been the actual vacancy rate?
- Crime grade is F in this area — have there been break-ins, vandalism, or insurance claims at this property in the last 3 years? What carrier currently insures it and at what premium?
- The area grade is low — what's the realistic commute time and amenity access for the typical tenant pool here? Any planned neighborhood developments (good or bad) we should know about?
- What's the average days-on-market for RENTAL listings here right now (not sales)? A rising rental-DOM trend means longer vacancies and softer asking-rent achievability than the comps imply.
- What's the recent tenant-quality profile in this submarket — average credit score on applications, eviction rate, late-payment / NSF rate, and stable-employment percentage? A property-management company in the area should have these aggregated.
- How much new for-sale + rental construction is in the pipeline within 1–3 miles? Heavy new supply typically softens prices + rents 12–24 months out; constrained supply supports both.
Investment metrics
- 1% rule
- 0.92% ✗
- Cap rate
- 6.06%
- Cash-on-cash
- -0.84%
- DSCR
- 0.96
- GRM
- 9.1
CMA / ARV
- ARV (median comp)
- $167,418
- List price
- $149,000
- Delta
- -11.00%
- Verdict
- UNDERPRICED
- Comps
- 20 within 1.0 mi
Show comp detail 12 sales within ~0.75 mi
| Address | Dist | Beds/Ba | Sqft | Sold | Price | $/sf | Match |
|---|---|---|---|---|---|---|---|
| 606 Roosevelt St | 0.08mi | 3/1.5 (+1) | 1,092 (-4%) | 4mo | $179,900 | $165 | 79 |
| 1815 Thompson St | 0.19mi | 3/2.0 (+1) | 1,250 (+9%) | 1mo | $199,000 | $159 | 66 |
| 1813 Thompson St | 0.20mi | 3/2.0 (+1) | 1,250 (+9%) | 5mo | $209,000 | $167 | 62 |
| 1013 Veronica St | 0.30mi | 2/2.0 | 1,246 (+9%) | 8mo | $165,000 | $132 | 60 |
| 113 Lake Rd | 0.36mi | 3/1.0 (+1) | 1,040 (-9%) | 6mo | $80,000 | $77 | 58 |
| 503 Raymond Ave | 0.53mi | 3/2.0 (+1) | 1,198 (+5%) | 4mo | $150,000 | $125 | 55 |
| 1102 Linden St | 0.29mi | 2/1.0 | 982 (-14%) | 10mo | $115,000 | $117 | 55 |
| 2026 Rosalee St | 0.42mi | 3/2.0 (+1) | 1,270 (+11%) | 1mo | $189,000 | $149 | 52 |
| 2918 Katherine St | 0.72mi | 3/1.0 (+1) | 1,195 (+4%) | 4mo | $154,500 | $129 | 50 |
| 2806 Ashley St | 0.60mi | 3/2.0 (+1) | 1,204 (+5%) | 5mo | $110,000 | $91 | 50 |
| 118 Brown St | 0.66mi | 3/1.0 (+1) | 1,275 (+12%) | 1mo | $205,000 | $161 | 44 |
| 504 Raymond St | 0.56mi | 3/2.0 (+1) | 1,313 (+15%) | 2mo | $120,000 | $91 | 39 |
Match score weights: distance 35% · size 25% · config 20% · recency 20%. Top-matched comps best support the ARV.
Projected returns pro-forma
-3.0% appreciation · 3.95% rent growth · sell at horizon
- IRR
- -19.6%
- Equity multiple
- 0.31×
- Total profit
- $-28,802
- Equity at exit
- $22,216
- IRR
- -10.1%
- Equity multiple
- 0.35×
- Total profit
- $-26,940
- Equity at exit
- $12,883
Cash invested: $41,720 (down + closing). Projections, not guarantees.
Landlord ↔ Tenant lean methodology
- Overall (STATE)
- 87 Strongly Landlord-Friendly
- State Texas
- 87 Strongly Landlord-Friendly · R+5
- County
- — inherits STATE
- City
- — inherits STATE
ZIP-level market 77568
- Home prices YoY
- -22.7%
- Rents YoY
- 4.0%
- Active inventory
- 661
- Price-to-rent
- 9.1×
Monthly cashflow live
- Estimated rent
- $1,370 high interval (Pro) →
- Mortgage (P&I)
- −$781
- Tax from tax record
- −$268 /mo · $3,217/yr
- Insurance
- −$62
- Flood insurance flood zone
- −$66 /mo · $798/yr
- HOA
- −$0
- Vacancy / Maint / Mgmt
- −$288
- Net cashflow
- $-96
Break-even live
Sensitivity live
| Price | -10% $-11 | -5% $-53 | +0% $-96 | +5% $-138 | +10% $-180 |
|---|---|---|---|---|---|
| Rent | -10% $-204 | -5% $-150 | +0% $-96 | +5% $-42 | +10% $13 |
| Rate | -1.0pp $-21 | -0.5pp $-58 | base $-96 | +0.5pp $-134 | +1.0pp $-174 |
UW: 25.0% down · 7.5% · 30yr · 1.5% tax · 5.0% vac · 8.0% maint · 8.0% mgmt
Financing live
Cash to close
- Down payment
- $37,250
- Closing costs
- $4,470
- Reserves months
- —
- Total cash needed
- —
Loan-product check · same deal, 3 products live
Conventional
25% down · 7.5% · 30yr
- Down + closing
- —
- Monthly P&I
- —
- Monthly cashflow
- —
- DSCR
- —
- Eligible?
- —
Personal DTI + credit; lowest rate.
DSCR
20% down · 8.5% · 30yr
- Down + closing
- —
- Monthly P&I
- —
- Monthly cashflow
- —
- DSCR
- —
- Eligible?
- —
No personal income docs; deal must DSCR.
Hard money
10% down · 12.0% · 12mo
- Down + closing
- —
- Monthly P&I
- —
- Monthly cashflow
- —
- DSCR
- —
- Eligible?
- —
Short-term bridge; refi at stabilization.
Rent comps 14 comps
| Address | Beds | Baths | Sqft | Rent | $/sqft | DOM | Units | Dist |
|---|---|---|---|---|---|---|---|---|
| 2328 Boss St La Marque, TX | 2.0 | 1.0 | 848 | $925 | $1.09 | 14d | 2 | 0.15mi |
| 306 Lake Rd Unit B La Marque, TX | 2.0 | 1.0 | 816 | $995 | $1.22 | 45d | 1 | 0.25mi |
| 203 Beatrice St La Marque, TX | 3.0 | 1.0 | 1304 | $1,395 | $1.07 | 26d | 1 | 0.40mi |
| 309 S Bell Dr Texas City, TX | 2.0 | 2.0 | 1316 | $1,650 | $1.25 | 45d | 1 | 0.43mi |
| 1013 Margot St La Marque, TX | 3.0 | 2.0 | 1099 | $1,500 | $1.36 | 20d | 1 | 0.47mi |
| 1006 E Camp Cir La Marque, TX | 3.0 | 1.0 | 1230 | $1,500 | $1.22 | 26d | 1 | 0.60mi |
| 711 Avenue A Unit 4 La Marque, TX | 2.0 | 1.0 | 750 | $799 | $1.07 | 45d | 1 | 0.80mi |
| 1825 Bayou Rd La Marque, TX | 2.0 | 1.0 | 1200 | $1,195 | $1.00 | 45d | 1 | 0.87mi |
| 4417 Edward St Texas City, TX | 2.0 | 2.0 | 983 | $1,150 | $1.17 | 4d | 1 | 1.08mi |
| 4417 Edward St Texas City, TX | 2.0 | 2.0 | 983 | $1,100 | $1.12 | 5d | 1 | 1.08mi |
| 619 N Vionett Ln Texas City, TX | 3.0 | 2.0 | 1204 | $1,550 | $1.29 | 7d | 1 | 1.08mi |
| 7510 Hummingbird Ln Texas City, TX | 3.0 | 1.5 | 1200 | $1,550 | $1.29 | 4d | 1 | 1.24mi |
| 2729 Main St La Marque, TX | 2.0 | 1.0–2.0 | 864 | $950 | $1.10 | 0d | 3 | 1.26mi |
| 6607 Memorial Dr Texas City, TX | 2.0 | 1.0 | 936 | $1,200 | $1.28 | 45d | 1 | 1.32mi |
Listing history 22 events
-
2026-06-21days on market $149,000 Active 108 DOM
-
2026-06-18days on market $149,000 Active 105 DOM
-
2026-06-17days on market $149,000 Active 104 DOM
-
2026-06-16days on market $149,000 Active 103 DOM
-
2026-06-15days on market $149,000 Active 102 DOM
-
2026-06-13days on market $149,000 Active 100 DOM
-
2026-06-09days on market $149,000 Active 96 DOM
-
2026-06-08days on market $149,000 Active 95 DOM
-
2026-06-07days on market $149,000 Active 94 DOM
-
2026-06-04days on market $149,000 Active 91 DOM
-
2026-06-03days on market $149,000 Active 90 DOM
-
2026-06-02days on market $149,000 Active 89 DOM
-
2026-06-01days on market $149,000 Active 88 DOM
-
2026-05-31days on market $149,000 Active 87 DOM
-
2026-03-05$149,000 Active 589-char remark
Show marketing remark (589 chars)
A welcoming 2-bedroom home that blends comfort with practical everyday living. The layout opens into a bright main living area with enough space for relaxing. The kitchen is fully equipped with a dishwasher, generous counter space, and cabinetry that makes cooking easy. Both bedrooms offer comfortable proportions and natural light, making them ideal for sleeping, working, or creating a personalized retreat. One standout feature is the indoor utility room, conveniently located to keep laundry and household tasks out of sight while still easily accessible. Schedule your showing today!
-
2022-04-28soldstatus
-
2022-04-23soldstatus Sold 184-char remark
Show marketing remark (184 chars)
WOW HOUSE WITH BEAUTIFUL UPDATES !!!! Updates include; windows, interior and exterior paint, carpet, vinyl plank flooring, lights, spotlights, fan, doors, baseboards and COOLING !!!!.
-
2022-03-19status Pending, Continue to Show 184-char remark
Show marketing remark (184 chars)
WOW HOUSE WITH BEAUTIFUL UPDATES !!!! Updates include; windows, interior and exterior paint, carpet, vinyl plank flooring, lights, spotlights, fan, doors, baseboards and COOLING !!!!.
-
2022-01-08$154,500 Active 184-char remark
Show marketing remark (184 chars)
WOW HOUSE WITH BEAUTIFUL UPDATES !!!! Updates include; windows, interior and exterior paint, carpet, vinyl plank flooring, lights, spotlights, fan, doors, baseboards and COOLING !!!!.
-
2021-03-04soldstatus
-
2020-10-02soldstatus
-
2020-10-01soldstatus
ⓘ Source: listings_history table (triggers on properties + properties_extension) + one-shot
backfill from property_details.listing_events for pre-trigger history.
Tax reassessment forecast TX · Resets to sale price
- Current annual tax
- $3,217 · $268/mo
- Projected year-2 tax
- $3,217 · $268/mo
- Expected delta
- $0/yr ($0/mo · 0.0%)
ⓘ Screening estimate from a state-policy table — verify with the county assessor before closing.
Climate risk First Street
- Flood 7/10 Severe FEMA zone X (shaded) · 59% chance over 30 yrs
- Wildfire 1/10 Low
- Heat 10/10 Extreme 7 d/yr ≥110°F today · 27 d/yr by 30 yrs out
- Wind 10/10 Extreme 99% chance of damaging wind over 30 yrs
- Air quality 3/10 Moderate 2 unhealthy d/yr today · 2 by 30 yrs out
Nearby sold comps map
Loading sold comps map…
Walkable amenities ~0.75 mi
Loading nearby amenities…
Taxation est. · year 1
- Rental income
- $16,440
- − Mortgage interest
- −$8,346
- − Property taxes
- −$3,217
- − Insurance
- −$1,542
- − Repairs & maintenance
- −$1,315
- − Management
- −$1,315
- − Depreciation
- −$4,335
- Taxable loss
- −$3,630
- Est. tax savings @ 24.0%
- +$871
- After-tax cash flow
- $-277/yr
For passive investors: Depreciation is non-cash, so a rental often shows a tax loss while cash-flowing — sheltering income. Rental losses are passive: they offset passive income freely, and up to $25,000/yr can offset ordinary (W-2) income if you actively participate and your MAGI is under $100k (phasing out to $0 by $150k); unused losses carry forward. On sale, claimed depreciation is recaptured at up to 25%, and gains may owe capital-gains tax (a 1031 exchange can defer both). Figures are a year-1 estimate at your 24.0% rate — not tax advice; consult a CPA.
Schools (NCES district)
- District
- Texas City ISD
- NCES district ID
- 4842510
- Math proficiency
- 28% ▼ -10.00%
- Reading proficiency
- 29% ▼ -4.00%
- Median HH income
- $44,875
- Composite
- 24.47/100
- National rank
- #7664
- State rank
- #655 of 826 in TX
Livability — La Marque
- Score
- 59/100
- State rank
- #1136
- US rank
- #20037
Category grades
Schools grade is shown separately in the Schools card above.
Census & demographics
- Census place
- La Marque, TX
- County
- Galveston County · 357,330 people
- City population
- 23,083
- Metro
- Houston-The Woodlands-Sugar Land, TX
- Population (ZIP)
- 23,083
- Household income
- $74,694
- Rent vs Own
- Severe rent burden
- 700.0
Population outlook (Galveston County) Hauer SSP2
- Today (2025)
- 390,640 people
- By 2030
- 425,226 · +8.9%
- By 2040
- 493,765 · +26.4%
- By 2050
- 559,698 · +43.3%
- By 2075
- 719,260 · +84.1%
- By 2100
- 819,628 · +109.8%
Race, ethnicity, and origin ACS 2023
- Neighborhood character
- Highly diverse neighborhood (Simpson 0.71)
- Race & ethnicity
- White 37% Hispanic / Latino 29% Black 26% Two or more races 17% Asian 3%
- Hispanic origin (detail)
- Mexican 22% Puerto Rican 1%
- Common ancestry
- Lithuanian 1% Italian 1% Serbian 1%
- Foreign-born
- 8% · Canada
- Languages at home
- 77% English-only · Spanish 21% Tagalog/Filipino 1% Other Asian/Pacific 1%
Political lean MEDSL · Galveston
- 2024 margin
- Strong R (+27.4) · D 35.7% · R 63.1% · Other 1.2%
- 2008→2024 swing
- -7.9pp toward R · 2008: -19.5pp · 2024: -27.4pp
- All cycles
- 2024: R+27.4 2020: R+22.6 2016: R+22.6 2012: R+26.9 2008: R+19.5
Not yet ingested
- Civics
- —
Market trends
- HPI YoY
- ▼ -69.39%
- Current HPI
- 236.0239
- Rent YoY
- ▲ 3.95%
- Metro
- Houston-The Woodlands-Sugar Land, TX
- State GDP YoY
- ▲ 3.95%
- F500 in state
- 110
Industry mix (Fortune 500 HQ in TX)
| Industry | F500 HQs | Revenue |
|---|---|---|
| Energy | 16 | $1,198B |
|
||
| Technology | 5 | $198B |
|
||
| Engineering / Construction | 4 | $72B |
|
||
| Energy Services | 3 | $60B |
|
||
| Utilities | 3 | $41B |
|
||
| Healthcare | 2 | $330B |
|
||
Price history
-3.6% since first listed8 events — show timeline
- 2026-03-05 Listed $149,000 HARMLS
- 2022-04-28 Sold (Public Records) — Public Records
- 2022-04-23 Sold (MLS) — HARMLS
- 2022-03-19 Pending — HARMLS
- 2022-01-08 Listed $154,500 HARMLS
- 2021-03-04 Sold (Public Records) — Public Records
- 2020-10-02 Sold (Public Records) — Public Records
- 2020-10-01 Sold (Public Records) — Public Records
Property tax history
+10.6%/yrLatest (2025): $3,217 · +7.3% YoY. Source: county tax records.
Cash-flow waterfall
monthlySold comps — $/sqft
last 12 mo · ≤1 miLoading sold comps…