 Triplex
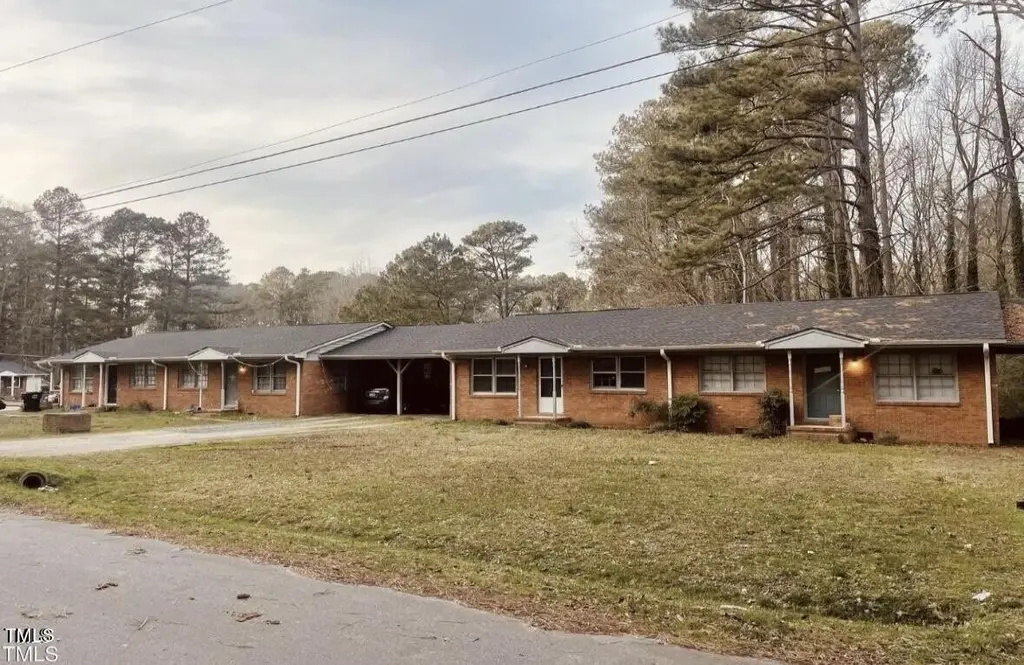
626 Maple Ln · Garner, NC
Flood risk 1/10 · Minimal
- FEMA flood zone
- X (unshaded)
- Chance of flooding over 30 yrs
- 0.0%
- Est. flood insurance / yr
- $507 – $1,088
Fire risk 3/10 · Minor
- Est. fire insurance / yr
- $906 – $1,684
Heat risk 6/10 · Moderate
- Hot days now (above 105°F)
- 7 days/yr
- Hot days in 30 yrs
- 17 days/yr
Wind risk 6/10 · Moderate
- Chance of severe wind over 30 yrs
- 66.0%
Air-quality risk 2/10 · Minimal
- Unhealthy air days now
- 1 days/yr
- Unhealthy air days in 30 yrs
- 1 days/yr
Risk factors via First Street. Map © Google.
Why this score? — see what drove the D- grade
The composite is a weighted blend of 9 inputs, each scored 0–100. Each bar is that input's sub-score; the figure is the points it added to the 100-point composite (weight × sub-score).
- Cash flow +9.6/30.0
- ARV discount +7.5/15.0
- Schools +4.9/10.0
- Livability +3.8/5.0
- Rent growth +2.9/5.0
- DSCR +2.7/10.0
- Condition / age +2.5/5.0
- 1% rule +2.0/10.0
- Appreciation +0.0/10.0
$700,000
🖨 Deal sheet (PDF) 📄 Offer letter ✓ Due diligence
Multi-family units
County records classify this as Multi-Family (2-4 Unit). Listing-text estimate: 3 units. confirmed
Listing remarks
INVESTOR ALERT!!! Call or text listing agent to schedule showing to see these occupied duplexes! 2 adjoined duplexes for sale for a total of 4 units! Priced BELOW tax value! Are you looking for an investment property to add to your portfolio? This income producing property is in a fantastic location and looking for it's next owner. This 8 bed, 4 bath property is perfect for adding to your income stream. NO HOA or restrictive covenants, and on 1.24 acres!! All 4 units are on month to month leases. Call listing agent for details.
Key facts
- 1.24 acres
- No hoa
- 1.24 acre lot
Tags
Property features AI
Finance
- Other: Living area approximately 3,408
- Financial info: 4 total units (multifamily); Owner responsible for HVAC maintenance, management, and repairs
- HOA & community: No association
Exterior
- Parking: Open parking with 8 spaces; Carport; Gravel parking area
- Utilities: Septic tank for sewer; Shared well water
- Home design: Duplex; One level
- Construction: Brick construction
- Exterior features: Shingle roof; Brick/mortar foundation; 1.24-acre lot; Publicly maintained road access
Interior
- Kitchen: Electric range; Refrigerator
- Bedrooms: 8 bedrooms total
- Flooring: Hardwood; Luxury vinyl; Wood
- Bathrooms: 4 full bathrooms
- Heating & cooling: Heat pump heating; Central air conditioning
- Interior features: Electric range and refrigerator included; Hardwood, luxury vinyl, and wood flooring
Neighborhood map
What this means for you Summary
Snapshot
- This is a 3 × 3-bed/?-bath units multifamily listed at $700k.
Deal economics
- At list price, monthly cash flow is $-471 ($-6k/yr) — negative. Per door: $-157/mo.
- To cash-flow at today's rent, offer at most $617k (11.9% below list).
- To meet the 1% rule (rent ≥ 1% of price), the offer needs to be $491k (29.8% below list).
- Recommended offer: $491k (29.8% below list) — sets the bar for 1% rule.
- Cap rate 5.5% vs local median 3.3% in Garner — top-decile yield for the area; either an underpriced asset or a hidden risk that comps aren't pricing in. Stress-test before assuming the spread holds.
Location & tenants
- Location reads 76/100 on livability (#35 in NC, #3,421 nationally) — a middle-class / working-renter tenant base. Strengths: housing A+, commute A-, cost of living A-; Watch: amenities D, crime F.
- Wake County Schools (suburban): math 52% / reading 60% proficiency, ranked #35 of 178 in NC (top 20%) — acceptable for families but not a draw, mixed tenant base, ~2y average lease.
- Zoned schools: Smith Elementary (math 27% / reading 32%, grade F, #975 of 1,410 statewide, top 71%, 530 students, 68% FRL); North Garner Middle (math 29% / reading 38%, grade F, #299 of 475 statewide, top 64%, 975 students, 57% FRL); Garner High (math 32% / reading 56%, grade F, #367 of 535 statewide, top 69%, 1,683 students, 50% FRL) — zoned schools average 58% FRL vs 30% district-wide (28 pts higher); higher-poverty schools than district average — tighter screening recommended.
- Zoned-school proficiency averages 36% at this address vs 56% district-wide (-20 pts) — the specific schools serving this property underperform the Wake County Schools average; the district grade overstates school quality for this exact location.
- Market conditions: Rents rising (+1.6%/yr); 493 active listings in the ZIP; solid renter incomes; 15,249 units permitted in Wake County in 2024 (5,568 in 5+ unit buildings).
- At $4,911/mo this rent would consume 65% of the median local household income ($90k/yr) (locally 1914% of renters already pay >50% of income on rent) — very limited rent-growth headroom before tenants either downsize or default.
Forward outlook
- Local home prices are declining (-3.0%/yr); year-one equity from $5k of loan paydown is wiped out by about $21k of value loss. Plan a longer hold.
- Wake County population projected at +51% by 2050 — long-run rental-demand tailwind backs the buy-and-hold thesis.
Negotiation context
- It's been on market 198 days — a 12% lower offer ($616k) is reasonable based on typical stale-listing flexibility.
- 9 sale attempts since 7y ago; this cycle's ask is 7% above the opening price — seller raised mid-cycle; expect resistance to lowballs.
- Current owner paid $515k; 36% above their basis — modest negotiation headroom, anchor on the comps not their cost.
Risks & watch-outs
- Climate carrying-cost: major wind risk, 66% chance of damaging wind over 30y; extreme-heat days projected 7→17/yr by 2055 (HVAC capex compounding) — expect insurance premiums to compound above CPI over the hold.
Questions for the listing agent
- What do current leases actually rent for vs. the listed asking? Can we see a recent rent roll and the last 12 months of T-12 income?
- It's been on market 198 days. Have you received any prior offers? Is the seller open to a 30% concession, seller financing, or rate buy-down credit?
- Can we see the unit-by-unit rent roll, current vacancy, and any below-market leases? What's the average tenancy length?
- What capital expenditures (roof, boiler, parking lot, exteriors) have been made in the last 5 years, and what's planned in the next 2?
- Built in 1964 — when were the roof, HVAC, electrical panel, plumbing, and water heater last replaced?
- Why hasn't it sold? Are there any deal-killer items the seller is aware of (foundation, flood, title, zoning, code violations)?
- Is there a deadline driving the sale (1031 exchange, divorce, estate, relocation)? That informs how much negotiation room exists.
- Schools are D-rated, which usually means shorter tenancies and higher turnover. Who's the typical renter profile here, and what's been the actual vacancy rate?
- Crime grade is F in this area — have there been break-ins, vandalism, or insurance claims at this property in the last 3 years? What carrier currently insures it and at what premium?
- The area grade is low — what's the realistic commute time and amenity access for the typical tenant pool here? Any planned neighborhood developments (good or bad) we should know about?
- What's the average days-on-market for RENTAL listings here right now (not sales)? A rising rental-DOM trend means longer vacancies and softer asking-rent achievability than the comps imply.
- What's the recent tenant-quality profile in this submarket — average credit score on applications, eviction rate, late-payment / NSF rate, and stable-employment percentage? A property-management company in the area should have these aggregated.
- How much new apartment / multifamily construction is in the pipeline within 1–3 miles? Heavy new supply (>2% of stock underway) typically softens rents 12–24 months out; light construction supports rent growth.
Investment metrics
- 1% rule
- 0.70% ✗
- Cap rate
- 5.48%
- Cash-on-cash
- -2.89%
- DSCR
- 0.87
- GRM
- 11.9
CMA / ARV
No comps found within radius.
Projected returns pro-forma
-3.0% appreciation · 1.59% rent growth · sell at horizon
- IRR
- -22.6%
- Equity multiple
- 0.23×
- Total profit
- $-150,555
- Equity at exit
- $104,372
- IRR
- -20.4%
- Equity multiple
- -0.01×
- Total profit
- $-198,087
- Equity at exit
- $60,523
Cash invested: $196,000 (down + closing). Projections, not guarantees.
Landlord ↔ Tenant lean methodology
- Overall (STATE)
- 85 Strongly Landlord-Friendly
- State North Carolina
- 85 Strongly Landlord-Friendly · R+3
- County
- — inherits STATE
- City
- — inherits STATE
ZIP-level market 27603
- Rents YoY
- 1.6%
- Active inventory
- 493
- Price-to-rent
- 35.6×
Monthly cashflow live
- Estimated rent
- $4,911 medium interval (Pro) →
- Mortgage (P&I)
- −$3,671
- Tax from tax record
- −$389 /mo · $4,664/yr
- Insurance
- −$292
- HOA
- −$0
- Vacancy / Maint / Mgmt
- −$1,031
- Net cashflow
- $-471
Break-even live
Sensitivity live
| Price | -10% $-75 | -5% $-273 | +0% $-471 | +5% $-670 | +10% $-868 |
|---|---|---|---|---|---|
| Rent | -10% $-859 | -5% $-665 | +0% $-471 | +5% $-278 | +10% $-84 |
| Rate | -1.0pp $-119 | -0.5pp $-293 | base $-471 | +0.5pp $-653 | +1.0pp $-837 |
3-unit breakdown (identical units grouped — click to expand)
| Units | Beds | Baths | Est. rent |
|---|---|---|---|
| 3× units | 3 | — | $4,911 |
| #1 | 3 | — | $1,637 |
| #2 | 3 | — | $1,637 |
| #3 | 3 | — | $1,637 |
| Total (3 units) | $4,911 | ||
UW: 25.0% down · 7.5% · 30yr · 1.5% tax · 5.0% vac · 8.0% maint · 8.0% mgmt
Financing live
Cash to close
- Down payment
- $175,000
- Closing costs
- $21,000
- Reserves months
- —
- Total cash needed
- —
Loan-product check · same deal, 3 products live
Conventional
25% down · 7.5% · 30yr
- Down + closing
- —
- Monthly P&I
- —
- Monthly cashflow
- —
- DSCR
- —
- Eligible?
- —
Personal DTI + credit; lowest rate.
DSCR
20% down · 8.5% · 30yr
- Down + closing
- —
- Monthly P&I
- —
- Monthly cashflow
- —
- DSCR
- —
- Eligible?
- —
No personal income docs; deal must DSCR.
Hard money
10% down · 12.0% · 12mo
- Down + closing
- —
- Monthly P&I
- —
- Monthly cashflow
- —
- DSCR
- —
- Eligible?
- —
Short-term bridge; refi at stabilization.
Listing history 42 events
-
2026-06-21days on market $700,000 Active 198 DOM
-
2026-06-18days on market $700,000 Active 195 DOM
-
2026-06-17days on market $700,000 Active 194 DOM
-
2026-06-16days on market $700,000 Active 193 DOM
-
2026-06-15days on market $700,000 Active 192 DOM
-
2026-06-13days on market $700,000 Active 190 DOM
-
2026-06-13days on market $700,000 Active 189 DOM
-
2026-06-09days on market $700,000 Active 186 DOM
-
2026-06-08days on market $700,000 Active 185 DOM
-
2026-06-07days on market $700,000 Active 184 DOM
-
2026-06-05days on market $700,000 Active 181 DOM
-
2026-06-03days on market $700,000 Active 180 DOM
-
2026-06-02days on market $700,000 Active 179 DOM
-
2026-06-01days on market $700,000 Active 178 DOM
-
2026-05-31days on market $700,000 Active 177 DOM
-
2025-12-15price $700,000
-
2025-12-05$654,900 Active
-
2024-12-05historical
-
2024-09-04$654,900 Active
-
2024-09-04historical
-
2024-09-03price $649,995
-
2024-07-12price $660,000
-
2024-07-07$675,000 Active
-
2024-05-09status Pending
-
2024-05-08historical
-
2024-03-21status Active
-
2024-01-20status Pending
-
2024-01-11$675,000 Active
-
2021-05-19soldstatus $515,000 Closed
-
2021-05-19soldstatus $515,000
-
2021-05-19soldstatus $515,000
-
2021-04-21status Pending
-
2021-03-05$525,000 Active
-
2021-03-05$525,000
-
2019-12-31soldstatus $375,000 Closed
-
2019-12-31soldstatus $375,000
-
2019-12-31soldstatus $375,000
-
2019-12-06historical Contingent
-
2019-12-02$375,000 Active
-
2019-12-02$375,000
-
2000-07-31soldstatus $255,000
-
1995-06-16soldstatus $108,000
ⓘ Source: listings_history table (triggers on properties + properties_extension) + one-shot
backfill from property_details.listing_events for pre-trigger history.
Tax reassessment forecast NC · Resets to sale price
- Current annual tax
- $4,664 · $389/mo
- Projected year-2 tax
- $5,740 · $478/mo
- Expected delta
- +$1,076/yr (+$90/mo · 23.1%)
ⓘ Screening estimate from a state-policy table — verify with the county assessor before closing.
Climate risk First Street
- Flood 1/10 Low FEMA zone X (unshaded) · 0% chance over 30 yrs
- Wildfire 3/10 Moderate
- Heat 6/10 Major 7 d/yr ≥105°F today · 17 d/yr by 30 yrs out
- Wind 6/10 Major 66% chance of damaging wind over 30 yrs
- Air quality 2/10 Low 1 unhealthy d/yr today · 1 by 30 yrs out
Nearby sold comps map
Loading sold comps map…
Walkable amenities ~0.75 mi
Loading nearby amenities…
Taxation est. · year 1
- Rental income
- $58,932
- − Mortgage interest
- −$39,211
- − Property taxes
- −$4,664
- − Insurance
- −$3,500
- − Repairs & maintenance
- −$4,715
- − Management
- −$4,715
- − Depreciation
- −$20,364
- Taxable loss
- −$18,235
- Est. tax savings @ 24.0%
- +$4,376
- After-tax cash flow
- $-1,281/yr
For passive investors: Depreciation is non-cash, so a rental often shows a tax loss while cash-flowing — sheltering income. Rental losses are passive: they offset passive income freely, and up to $25,000/yr can offset ordinary (W-2) income if you actively participate and your MAGI is under $100k (phasing out to $0 by $150k); unused losses carry forward. On sale, claimed depreciation is recaptured at up to 25%, and gains may owe capital-gains tax (a 1031 exchange can defer both). Figures are a year-1 estimate at your 24.0% rate — not tax advice; consult a CPA.
Schools (NCES district)
- District
- Wake County Schools
- NCES district ID
- 3704720
- Math proficiency
- 52% ▲ 2.00%
- Reading proficiency
- 60% ▲ 4.00%
- Median HH income
- $67,509
- Composite
- 49.41/100
- National rank
- #2010
- State rank
- #35 of 178 in NC
Livability — Garner
- Score
- 76/100
- State rank
- #35
- US rank
- #3421
Category grades
Schools grade is shown separately in the Schools card above.
Census & demographics
- County
- Wake County · 1,216,256 people
- City population
- 55,242
- Metro
- Raleigh-Cary, NC
- Population (ZIP)
- 53,972
- Household income
- $90,484
- Rent vs Own
- Severe rent burden
- 1914.0
Population outlook (Wake County) Hauer SSP2
- Today (2025)
- 1,293,152 people
- By 2030
- 1,428,223 · +10.4%
- By 2040
- 1,698,188 · +31.3%
- By 2050
- 1,955,807 · +51.2%
- By 2075
- 2,520,273 · +94.9%
- By 2100
- 2,893,335 · +123.7%
Race, ethnicity, and origin ACS 2023
- Neighborhood character
- Diverse neighborhood (Simpson 0.57)
- Race & ethnicity
- White 62% Black 17% Hispanic / Latino 14% Two or more races 10% Asian 2%
- Hispanic origin (detail)
- Mexican 9% Puerto Rican 1%
- Common ancestry
- Serbian 3% Slovak 2% Italian 2%
- Foreign-born
- 10% · Canada, China
- Languages at home
- 85% English-only · Spanish 10% Other Indo-European 1% Arabic 1%
Political lean MEDSL · Wake
- 2024 margin
- Strong D (+25.5) · D 61.9% · R 36.4% · Other 1.7%
- 2008→2024 swing
- +11.1pp toward D · 2008: 14.4pp · 2024: 25.5pp
- All cycles
- 2024: D+25.5 2020: D+26.4 2016: D+20.5 2012: D+10.2 2008: D+14.4
Not yet ingested
- Civics
- —
Market trends
- HPI YoY
- ▼ -132.00%
- Current HPI
- 243.2963
- Rent YoY
- ▲ 1.59%
- Metro
- Raleigh-Cary, NC
- State GDP YoY
- ▲ 3.28%
- F500 in state
- 26
Industry mix (Fortune 500 HQ in NC)
| Industry | F500 HQs | Revenue |
|---|---|---|
| Financial Services | 2 | $213B |
|
||
| Retail | 2 | $95B |
|
||
| Industrial Conglomerate | 1 | $38B |
|
||
| Metals / Steel | 1 | $35B |
|
||
| Utilities | 1 | $30B |
|
||
| Industrial Machinery | 1 | $19B |
|
||
Price history
+548.1% since first listed27 events — show timeline
- 2025-12-15 Price Changed $700,000 TMLS
- 2025-12-05 Listed $654,900 TMLS
- 2024-12-05 Listing Removed — TMLS
- 2024-09-04 Listing Removed — TMLS
- 2024-09-04 Listed $654,900 TMLS
- 2024-09-03 Price Changed $649,995 TMLS
- 2024-07-12 Price Changed $660,000 TMLS
- 2024-07-07 Listed $675,000 TMLS
- 2024-05-09 Pending — TMLS
- 2024-05-08 Listing Removed — TMLS
- 2024-03-21 Relisted — TMLS
- 2024-01-20 Pending — TMLS
- 2024-01-11 Listed $675,000 TMLS
- 2021-05-19 Sold (Public Records) $515,000 Public Records
- 2021-05-19 Sold (MLS) $515,000 AMLSNC
- 2021-05-19 Sold (MLS) $515,000 TMLS
- 2021-04-21 Pending — TMLS
- 2021-03-05 Listed $525,000 AMLSNC
- 2021-03-05 Listed $525,000 TMLS
- 2019-12-31 Sold (Public Records) $375,000 Public Records
- 2019-12-31 Sold (MLS) $375,000 AMLSNC
- 2019-12-31 Sold (MLS) $375,000 TMLS
- 2019-12-06 Contingent — TMLS
- 2019-12-02 Listed $375,000 AMLSNC
- 2019-12-02 Listed $375,000 TMLS
- 2000-07-31 Sold (Public Records) $255,000 Public Records
- 1995-06-16 Sold (Public Records) $108,000 Public Records
Property tax history
+6.3%/yrLatest (2025): $4,664 · +2.9% YoY. Source: county tax records.
Cash-flow waterfall
monthlySold comps — $/sqft
last 12 mo · ≤1 miLoading sold comps…