 Fourplex
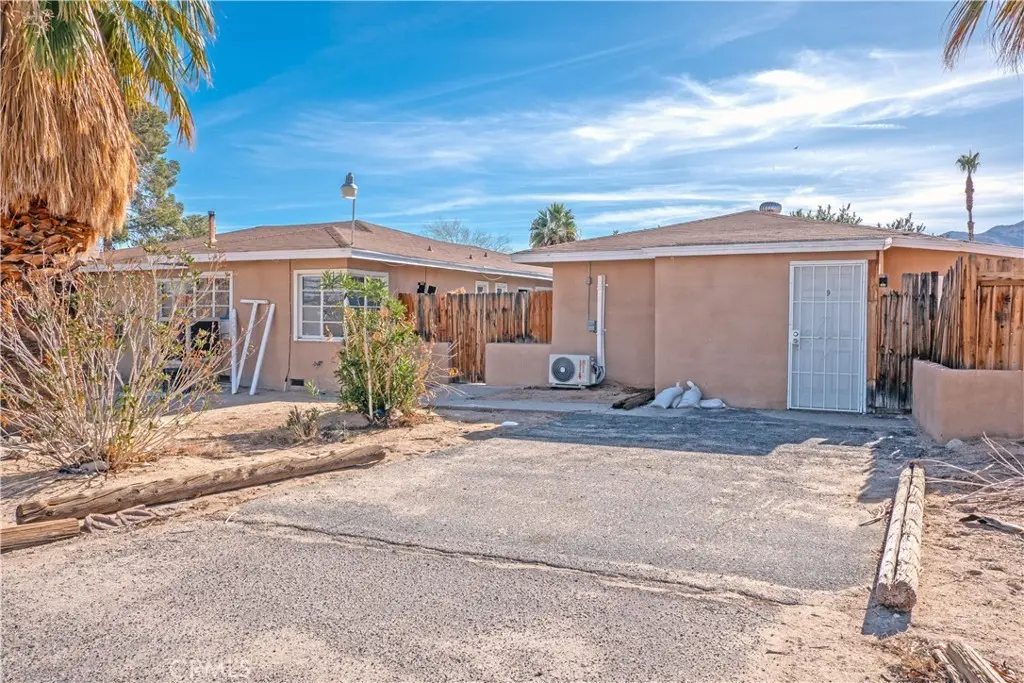
6038 Bagley Ave · Twentynine Palms, CA
Flood risk 1/10 · Minimal
- FEMA flood zone
- X (unshaded)
- Chance of flooding over 30 yrs
- 0.0%
- Est. flood insurance / yr
- $507 – $1,088
Fire risk 1/10 · Minimal
- Est. fire insurance / yr
- $659 – $1,223
Heat risk 8/10 · Major
- Hot days now (above 103°F)
- 7 days/yr
- Hot days in 30 yrs
- 21 days/yr
Wind risk 1/10 · Minimal
- Chance of severe wind over 30 yrs
- —
Air-quality risk 6/10 · Moderate
- Unhealthy air days now
- 9 days/yr
- Unhealthy air days in 30 yrs
- 12 days/yr
Risk factors via First Street. Map © Google.
Why this score? — see what drove the F grade
The composite is a weighted blend of 9 inputs, each scored 0–100. Each bar is that input's sub-score; the figure is the points it added to the 100-point composite (weight × sub-score).
- ARV discount +7.5/15.0
- Cash flow +4.8/30.0
- Rent growth +3.6/5.0
- Livability +3.0/5.0
- Condition / age +2.5/5.0
- Schools +2.2/10.0
- 1% rule +0.0/10.0
- DSCR +0.0/10.0
- Appreciation +0.0/10.0
$979,900
🖨 Deal sheet 📄 Offer letter ✓ Due diligence
Multi-family units
County records classify this as Multi-Family (5+ Unit). Listing-text estimate: 4 units. estimate disagrees with records
5+ unit building — per-unit beds/baths from public records are typically unavailable; the breakdown below (if shown) is an estimate from the listing text.
Listing remarks MLS
* * * MASSIVE PRICE REDUCTION * * * Welcome to a lucrative investment opportunity nestled in the heart of 29 Palms. This multi-unit property, located at 6038 Bagley Avenue, boasts 10 spacious and well-maintained units, offering a blend of comfort and convenience. This property is an ideal addition to any investment portfolio, offering a winning combination of current income and future appreciation. The area is known for its proximity to Joshua Tree National Park, making it a popular spot for nature lovers and those seeking outdoor activities. Don't miss this opportunity to acquire a valuable piece of real estate in a growing community. 10 well maintained units the have a solid rental track record. Mix of a Studio, 1's, 2's & Onsite laundry. Also, each unit is individually metered for electricity! Current Actual Cap rate 7.42%!!! and GRM is 9.8%!!
Key facts
- 1.03 acre lot
- 12 parking spots
- Built 1947
Neighborhood map
What this means for you Summary
Snapshot
- This is a 4 × 1-bed/?-bath units multifamily listed at $980k.
Deal economics
- At list price, monthly cash flow is $-2k ($-29k/yr) — negative. Per door: $-598/mo.
- To cash-flow at today's rent, offer at most $557k (43.1% below list).
- To meet the 1% rule (rent ≥ 1% of price), the offer needs to be $455k (53.6% below list).
- Recommended offer: $455k (53.6% below list) — sets the bar for 1% rule.
- Cap rate 3.4% vs local median 4.3% in Twentynine Palms — below-typical yield; the buyer is paying a premium for something (appreciation thesis, condition, location) that the cap rate doesn't capture.
Location & tenants
- Location reads 59/100 on livability (#622 in CA) — a working-class tenant base; expect higher turnover. Strengths: commute A+, housing A+; Watch: schools D, amenities F, employment D-.
- Morongo Unified (town): math 15% / reading 38% proficiency, ranked #395 of 517 in CA (top 76%) — low school quality limits family demand, transient renter base, plan for 1-2y turnover.
- Market conditions: Rents rising fast (+4.5%/yr); 734 active listings in the ZIP; 26 comparable units currently listed for rent nearby; rentals at typical pace (median 18d on market — plan ~3-4 weeks tenant-placement turnaround); 5,458 units permitted in San Bernardino County in 2024 (1,500 in 5+ unit buildings).
- At $4,546/mo this rent would consume 90% of the median local household income ($61k/yr) (locally 1057% of renters already pay >50% of income on rent) — very limited rent-growth headroom before tenants either downsize or default.
Forward outlook
- Local home prices are declining (-3.0%/yr); year-one equity from $7k of loan paydown is wiped out by about $29k of value loss. Plan a longer hold.
- San Bernardino County population projected at +15% by 2050 — modest demand growth; plan on rents tracking national, not racing it.
Negotiation context
- It's been on market 682 days — a 12% lower offer ($862k) is reasonable based on typical stale-listing flexibility.
- 15 sale attempts since 20y ago; this cycle's ask has dropped $270k (22%) from the opening price — seller is motivated, your offer sets the floor, not the list.
- Current owner paid $415k; list at $980k implies a 136% gain — meaningful room to come down on a strong offer.
Risks & watch-outs
- Watch-outs: built in 1947 — expect roof / HVAC / electrical / plumbing capex.
- Climate carrying-cost: extreme-heat days projected 7→21/yr by 2055 (HVAC capex compounding) — expect insurance premiums to compound above CPI over the hold.
Questions for the listing agent
- What do current leases actually rent for vs. the listed asking? Can we see a recent rent roll and the last 12 months of T-12 income?
- It's been on market 682 days. Have you received any prior offers? Is the seller open to a 54% concession, seller financing, or rate buy-down credit?
- Can we see the unit-by-unit rent roll, current vacancy, and any below-market leases? What's the average tenancy length?
- What capital expenditures (roof, boiler, parking lot, exteriors) have been made in the last 5 years, and what's planned in the next 2?
- Built in 1947 — when were the roof, HVAC, electrical panel, plumbing, and water heater last replaced?
- Why hasn't it sold? Are there any deal-killer items the seller is aware of (foundation, flood, title, zoning, code violations)?
- Is there a deadline driving the sale (1031 exchange, divorce, estate, relocation)? That informs how much negotiation room exists.
- Schools are D-rated, which usually means shorter tenancies and higher turnover. Who's the typical renter profile here, and what's been the actual vacancy rate?
- The area grade is low — what's the realistic commute time and amenity access for the typical tenant pool here? Any planned neighborhood developments (good or bad) we should know about?
- What's the average days-on-market for RENTAL listings here right now (not sales)? A rising rental-DOM trend means longer vacancies and softer asking-rent achievability than the comps imply.
- What's the recent tenant-quality profile in this submarket — average credit score on applications, eviction rate, late-payment / NSF rate, and stable-employment percentage? A property-management company in the area should have these aggregated.
- How much new apartment / multifamily construction is in the pipeline within 1–3 miles? Heavy new supply (>2% of stock underway) typically softens rents 12–24 months out; light construction supports rent growth.
Investment metrics
- 1% rule
- 0.46% ✗
- Cap rate
- 3.36%
- Cash-on-cash
- -10.46%
- DSCR
- 0.53
- GRM
- 18.0
CMA / ARV
- ARV (on-the-fly)
- $359,090
- Comps found
- 1
Show comp detail 1 sale within ~0.75 mi
| Address | Dist | Beds/Ba | Sqft | Sold | Price | $/sf | Match |
|---|---|---|---|---|---|---|---|
| 73757 Sunnyslope Dr | 0.34mi | 3/2.0 (+1) | 1,702 (+14%) | 23mo | $410,000 | $241 | 32 |
Match score weights: distance 35% · size 25% · config 20% · recency 20%. Top-matched comps best support the ARV.
Projected returns pro-forma
-3.0% appreciation · 4.45% rent growth · sell at horizon
- IRR
- -34.0%
- Equity multiple
- -0.11×
- Total profit
- $-304,821
- Equity at exit
- $146,106
- IRR
- -36.6%
- Equity multiple
- -0.58×
- Total profit
- $-434,857
- Equity at exit
- $84,724
Cash invested: $274,372 (down + closing). Projections, not guarantees.
Landlord ↔ Tenant lean methodology
- Overall (STATE)
- 18 Strongly Tenant-Friendly
- State California
- 18 Strongly Tenant-Friendly · D+13
- County
- — inherits STATE
- City
- — inherits STATE
ZIP-level market 92277
- Home prices YoY
- -3.1%
- Rents YoY
- 4.5%
- Active inventory
- 734
- Price-to-rent
- 71.8×
Monthly cashflow live
- Estimated rent
- $4,546 medium interval (Pro) →
- Mortgage (P&I)
- −$5,139
- Tax from tax record
- −$436 /mo · $5,236/yr
- Insurance
- −$408
- HOA
- −$0
- Vacancy / Maint / Mgmt
- −$955
- Net cashflow
- $-2,392
Break-even live
4-unit breakdown (identical units grouped — click to expand)
| Units | Beds | Baths | Est. rent |
|---|---|---|---|
| 4× units | 1 | — | $4,548 |
| #1 | 1 | — | $1,137 |
| #2 | 1 | — | $1,137 |
| #3 | 1 | — | $1,137 |
| #4 | 1 | — | $1,137 |
| Total (4 units) | $4,546 | ||
UW: 25.0% down · 7.5% · 30yr · 1.5% tax · 5.0% vac · 8.0% maint · 8.0% mgmt
Financing live
Cash to close
- Down payment
- $244,975
- Closing costs
- $29,397
- Reserves months
- —
- Total cash needed
- —
Loan-product check · same deal, 3 products live
Conventional
25% down · 7.5% · 30yr
- Down + closing
- —
- Monthly P&I
- —
- Monthly cashflow
- —
- DSCR
- —
- Eligible?
- —
Personal DTI + credit; lowest rate.
DSCR
20% down · 8.5% · 30yr
- Down + closing
- —
- Monthly P&I
- —
- Monthly cashflow
- —
- DSCR
- —
- Eligible?
- —
No personal income docs; deal must DSCR.
Hard money
10% down · 12.0% · 12mo
- Down + closing
- —
- Monthly P&I
- —
- Monthly cashflow
- —
- DSCR
- —
- Eligible?
- —
Short-term bridge; refi at stabilization.
Rent comps 26 comps
| Address | Beds | Baths | Sqft | Rent | $/sqft | DOM | Units | Dist |
|---|---|---|---|---|---|---|---|---|
| 6061 Bagley Ave Twentynine Palms, CA | 3.0 | 2.0 | 1260 | $1,375 | $1.09 | 5d | 2 | 0.09mi |
| 6061 Bagley Ave #27 Twentynine Palms, CA | 3.0 | 2.0 | 1260 | $1,400 | $1.11 | 24d | 1 | 0.09mi |
| 73596 Buena Vista Dr Twentynine Palms, CA | 3.0 | 2.0 | 1732 | $2,500 | $1.44 | 12d | 1 | 0.25mi |
| 73477 Desert Trail Dr Twentynine Palms, CA | 3.0 | 2.0 | 1388 | $2,200 | $1.59 | 24d | 1 | 0.32mi |
| 73482 Desert Trail Dr Twentynine Palms, CA | 2.0 | 2.0 | 1260 | $1,275 | $1.01 | 43d | 1 | 0.37mi |
| 73871 Desert Trail Dr Unit B Twentynine Palms, CA | 2.0 | 1.5 | 875 | $1,100 | $1.26 | 18d | 1 | 0.49mi |
| 5673 Skyview Ln Unit 29 Twentynine Palms, CA | 3.0 | 2.0 | 1600 | $2,195 | $1.37 | 43d | 1 | 0.54mi |
| 6614 Tamarisk Ave Twentynine Palms, CA | 2.0 | 1.0 | 1139 | $1,400 | $1.23 | 20d | 1 | 0.74mi |
| 5900 Desert Knoll Ave Twentynine Palms, CA | 2.0–3.0 | 1.5–2.5 | 907 | $1,450 | $1.60 | 1d | 1 | 0.75mi |
| 73777 Playa Vista Dr Unit 29 Twentynine Palms, CA | 3.0 | 2.0 | 1860 | $2,350 | $1.26 | 2d | 1 | 0.80mi |
| 73777 Playa Vista Dr Unit 29 Twentynine Palms, CA | 3.0 | 2.0 | 1860 | $2,495 | $1.34 | 16d | 1 | 0.80mi |
| 6615 National Park Dr Twentynine Palms, CA | 1.0 | 1.0 | 900 | $1,895 | $2.11 | 17d | 1 | 0.80mi |
| 6448 Palm View Ave Twentynine Palms, CA | 3.0 | 2.0 | 1100 | $1,795 | $1.63 | 43d | 1 | 0.81mi |
| 6627 National Park Dr Twentynine Palms, CA | 1.0 | 1.0 | 900 | $1,595 | $1.77 | 1d | 1 | 0.82mi |
| 6445 Palm View Ave Unit 29 Twentynine Palms, CA | 2.0 | 1.0 | 1344 | $1,090 | $0.81 | 2d | 1 | 0.82mi |
| 6628 National Park Dr Twentynine Palms, CA | 1.0 | 1.0 | 900 | $1,595 | $1.77 | 15d | 1 | 0.85mi |
| 6688 National Park Dr Apt A Twentynine Palms, CA | 2.0 | 1.0 | 1056 | $1,425 | $1.35 | 43d | 1 | 0.94mi |
| 74071 Playa Vista Dr Unit 29 Twentynine Palms, CA | 3.0 | 2.0 | 1633 | $1,995 | $1.22 | 43d | 1 | 0.95mi |
| 72949 Siesta Dr Twentynine Palms, CA | 3.0 | 1.5 | 1380 | $2,350 | $1.70 | 3d | 1 | 0.97mi |
| 5254 Verenda Ave Twentynine Palms, CA | 3.0 | 2.0 | 1350 | $2,100 | $1.56 | 5d | 1 | 0.99mi |
| 74144 Cactus Dr Twentynine Palms, CA | 2.0 | 1.0 | 974 | $1,400 | $1.44 | 43d | 1 | 0.99mi |
| 5170 Split Rock Ave Twentynine Palms, CA | 3.0 | 2.0 | 1314 | $1,900 | $1.45 | 43d | 1 | 1.07mi |
| 6597 Mesquite Springs Rd Unit 29 Twentynine Palms, CA | 2.0 | 1.0 | 915 | $2,495 | $2.73 | 16d | 1 | 1.08mi |
| 73432 Friendy Ln Unit 29 Twentynine Palms, CA | 3.0 | 2.0 | 1314 | $1,900 | $1.45 | 43d | 1 | 1.16mi |
| 72548 Sunnyslope Dr Twentynine Palms, CA | 3.0 | 2.0 | 1647 | $2,150 | $1.31 | 4d | 1 | 1.25mi |
| 6547 49 Palms Ave Twentynine Palms, CA | 2.0 | 1.0 | 951 | $1,350 | $1.42 | 5d | 1 | 1.31mi |
Listing history 50 events
-
2026-06-18days on market $979,900 Active 682 DOM
-
2026-06-17days on market $979,900 Active 681 DOM
-
2026-06-16days on market $979,900 Active 680 DOM
-
2026-06-15days on market $979,900 Active 679 DOM
-
2026-06-13days on market $979,900 Active 677 DOM
-
2026-06-13days on market $979,900 Active 676 DOM
-
2026-06-09days on market $979,900 Active 673 DOM
-
2026-06-08days on market $979,900 Active 672 DOM
-
2026-06-07days on market $979,900 Active 671 DOM
-
2026-06-04days on market $979,900 Active 668 DOM
-
2026-06-03days on market $979,900 Active 667 DOM
-
2026-06-02days on market $979,900 Active 666 DOM
-
2026-06-01days on market $979,900 Active 665 DOM
-
2026-05-31days on market $979,900 Active 664 DOM
-
2025-08-19price $979,900 868-char remark
Show marketing remark (868 chars)
* * * MASSIVE PRICE REDUCTION * * * Welcome to a lucrative investment opportunity nestled in the heart of 29 Palms. This multi-unit property, located at 6038 Bagley Avenue, boasts 10 spacious and well-maintained units, offering a blend of comfort and convenience. This property is an ideal addition to any investment portfolio, offering a winning combination of current income and future appreciation. The area is known for its proximity to Joshua Tree National Park, making it a popular spot for nature lovers and those seeking outdoor activities. Don't miss this opportunity to acquire a valuable piece of real estate in a growing community. 10 well maintained units the have a solid rental track record. Mix of a Studio, 1's, 2's & Onsite laundry. Also, each unit is individually metered for electricity! Current Actual Cap rate 7.42%!!! and GRM is 9.8%!!
-
2025-05-09price $1,050,000 868-char remark
Show marketing remark (868 chars)
* * * MASSIVE PRICE REDUCTION * * * Welcome to a lucrative investment opportunity nestled in the heart of 29 Palms. This multi-unit property, located at 6038 Bagley Avenue, boasts 10 spacious and well-maintained units, offering a blend of comfort and convenience. This property is an ideal addition to any investment portfolio, offering a winning combination of current income and future appreciation. The area is known for its proximity to Joshua Tree National Park, making it a popular spot for nature lovers and those seeking outdoor activities. Don't miss this opportunity to acquire a valuable piece of real estate in a growing community. 10 well maintained units the have a solid rental track record. Mix of a Studio, 1's, 2's & Onsite laundry. Also, each unit is individually metered for electricity! Current Actual Cap rate 7.42%!!! and GRM is 9.8%!!
-
2025-01-07price $1,150,000 868-char remark
Show marketing remark (868 chars)
* * * MASSIVE PRICE REDUCTION * * * Welcome to a lucrative investment opportunity nestled in the heart of 29 Palms. This multi-unit property, located at 6038 Bagley Avenue, boasts 10 spacious and well-maintained units, offering a blend of comfort and convenience. This property is an ideal addition to any investment portfolio, offering a winning combination of current income and future appreciation. The area is known for its proximity to Joshua Tree National Park, making it a popular spot for nature lovers and those seeking outdoor activities. Don't miss this opportunity to acquire a valuable piece of real estate in a growing community. 10 well maintained units the have a solid rental track record. Mix of a Studio, 1's, 2's & Onsite laundry. Also, each unit is individually metered for electricity! Current Actual Cap rate 7.42%!!! and GRM is 9.8%!!
-
2024-08-05$1,250,000 Active 868-char remark
Show marketing remark (868 chars)
* * * MASSIVE PRICE REDUCTION * * * Welcome to a lucrative investment opportunity nestled in the heart of 29 Palms. This multi-unit property, located at 6038 Bagley Avenue, boasts 10 spacious and well-maintained units, offering a blend of comfort and convenience. This property is an ideal addition to any investment portfolio, offering a winning combination of current income and future appreciation. The area is known for its proximity to Joshua Tree National Park, making it a popular spot for nature lovers and those seeking outdoor activities. Don't miss this opportunity to acquire a valuable piece of real estate in a growing community. 10 well maintained units the have a solid rental track record. Mix of a Studio, 1's, 2's & Onsite laundry. Also, each unit is individually metered for electricity! Current Actual Cap rate 7.42%!!! and GRM is 9.8%!!
-
2024-03-19historical
-
2024-01-04$1,399,000 Active
-
2019-01-28soldstatus $415,000
-
2019-01-25soldstatus $415,000 Closed Sale
-
2019-01-25soldstatus $415,000
-
2018-12-24historical Active Under Contract
-
2018-12-12$410,000 Active
-
2018-12-12$410,000
-
2018-03-14historical Hold Do Not Show
-
2018-03-14historical
-
2018-03-02status Active
-
2018-01-30historical Hold Do Not Show
-
2018-01-19$389,000 Active
-
2018-01-19$389,000
-
2017-08-11historical
-
2017-08-11historical
-
2017-04-28status Active
-
2017-04-04status Pending Sale
-
2017-02-11$459,000 Active
-
2017-02-11$459,000
-
2016-11-05historical
-
2016-11-05historical
-
2016-09-26price $420,000
-
2016-05-06$459,900 Active
-
2016-05-05$420,000
-
2013-01-17soldstatus $101,500
-
2012-09-18historical
-
2012-06-12status Pending
-
2012-06-06price $219,500
-
2012-06-06status Active
-
2011-11-09historical
-
2011-07-25$225,000 Active
ⓘ Source: listings_history table (triggers on properties + properties_extension) + one-shot
backfill from property_details.listing_events for pre-trigger history.
Tax reassessment forecast CA · Resets to sale price
- Current annual tax
- $5,236 · $436/mo
- Projected year-2 tax
- $7,447 · $621/mo
- Expected delta
- +$2,211/yr (+$184/mo · 42.2%)
ⓘ Screening estimate from a state-policy table — verify with the county assessor before closing.
Climate risk First Street
- Flood 1/10 Low FEMA zone X (unshaded) · 0% chance over 30 yrs
- Wildfire 1/10 Low
- Heat 8/10 Severe 7 d/yr ≥103°F today · 21 d/yr by 30 yrs out
- Wind 1/10 Low
- Air quality 6/10 Major 9 unhealthy d/yr today · 12 by 30 yrs out
Nearby sold comps map
Loading sold comps map…
Walkable amenities ~0.75 mi
Loading nearby amenities…
Taxation est. · year 1
- Rental income
- $54,552
- − Mortgage interest
- −$54,890
- − Property taxes
- −$5,236
- − Insurance
- −$4,900
- − Repairs & maintenance
- −$4,364
- − Management
- −$4,364
- − Depreciation
- −$28,506
- Taxable loss
- −$47,708
- Est. tax savings @ 24.0%
- +$11,450
- After-tax cash flow
- $-17,254/yr
For passive investors: Depreciation is non-cash, so a rental often shows a tax loss while cash-flowing — sheltering income. Rental losses are passive: they offset passive income freely, and up to $25,000/yr can offset ordinary (W-2) income if you actively participate and your MAGI is under $100k (phasing out to $0 by $150k); unused losses carry forward. On sale, claimed depreciation is recaptured at up to 25%, and gains may owe capital-gains tax (a 1031 exchange can defer both). Figures are a year-1 estimate at your 24.0% rate — not tax advice; consult a CPA.
Schools (NCES district)
- District
- Morongo Unified
- NCES district ID
- 0625860
- Math proficiency
- 15% ▼ -12.00%
- Reading proficiency
- 38% ▼ -3.00%
- Median HH income
- $39,399
- Composite
- 22.19/100
- National rank
- #8156
- State rank
- #395 of 517 in CA
Livability — Twentynine Palms
- Score
- 59/100
- State rank
- #622
- US rank
- #19731
Category grades
Schools grade is shown separately in the Schools card above.
Census & demographics
- Census place
- Twentynine Palms, CA
- County
- San Bernardino County · 2,030,291 people
- City population
- 26,277
- Metro
- Riverside-San Bernardino-Ontario, CA
- Population (ZIP)
- 26,277
- Household income
- $60,901
- Rent vs Own
- Severe rent burden
- 1057.0
Population outlook (San Bernardino County) Hauer SSP2
- Today (2025)
- 2,300,329 people
- By 2030
- 2,378,907 · +3.4%
- By 2040
- 2,523,137 · +9.7%
- By 2050
- 2,642,388 · +14.9%
- By 2075
- 2,880,769 · +25.2%
- By 2100
- 2,909,436 · +26.5%
Race, ethnicity, and origin ACS 2023
- Neighborhood character
- Diverse neighborhood (Simpson 0.70)
- Race & ethnicity
- White 49% Two or more races 24% Hispanic / Latino 24% Black 9% Asian 4% Pacific Islander 1% Native American 1%
- Hispanic origin (detail)
- Mexican 20%
- Common ancestry
- Italian 5% Lithuanian 3% Slovak 3%
- Foreign-born
- 9% · Canada, China, South Korea
- Languages at home
- 81% English-only · Spanish 12% Other Asian/Pacific 2% Tagalog/Filipino 1%
Political lean MEDSL · San Bernardino
- 2024 margin
- Toss-up / Even · D 47.5% · R 49.7% · Other 2.8%
- 2008→2024 swing
- -8.5pp toward R · 2008: 6.3pp · 2024: -2.1pp
- All cycles
- 2024: R+2.1 2020: D+10.7 2016: D+9.8 2012: D+5.4 2008: D+6.3
Not yet ingested
- Civics
- —
Market trends
- HPI YoY
- ▼ -12.15%
- Current HPI
- 380.5083
- Rent YoY
- ▲ 4.45%
- Metro
- Riverside-San Bernardino-Ontario, CA
- State GDP YoY
- ▲ 3.21%
- F500 in state
- 116
Industry mix (Fortune 500 HQ in CA)
| Industry | F500 HQs | Revenue |
|---|---|---|
| Technology | 27 | $1,492B |
|
||
| Financial Services | 3 | $174B |
|
||
| Retail | 3 | $44B |
|
||
| Insurance | 3 | $26B |
|
||
| Media / Entertainment | 2 | $115B |
|
||
| Pharmaceuticals / Biotech | 2 | $62B |
|
||
Price history
+366.6% since first listed42 events — show timeline
- 2025-08-19 Price Changed $979,900 CRMLS
- 2025-05-09 Price Changed $1,050,000 CRMLS
- 2025-01-07 Price Changed $1,150,000 CRMLS
- 2024-08-05 Listed $1,250,000 CRMLS
- 2024-03-19 Listing Removed — CRMLS
- 2024-01-04 Listed $1,399,000 CRMLS
- 2019-01-28 Sold (Public Records) $415,000 Public Records
- 2019-01-25 Sold (MLS) $415,000 SDMLS
- 2019-01-25 Sold (MLS) $415,000 CRMLS
- 2018-12-24 Contingent — CRMLS
- 2018-12-12 Listed $410,000 SDMLS
- 2018-12-12 Listed $410,000 CRMLS
- 2018-03-14 Listing Removed — SDMLS
- 2018-03-14 Delisted — CRMLS
- 2018-03-02 Relisted — CRMLS
- 2018-01-30 Delisted — CRMLS
- 2018-01-19 Listed $389,000 SDMLS
- 2018-01-19 Listed $389,000 CRMLS
- 2017-08-11 Listing Removed — SDMLS
- 2017-08-11 Listing Removed — CRMLS
- 2017-04-28 Relisted — CRMLS
- 2017-04-04 Pending — CRMLS
- 2017-02-11 Listed $459,000 CRMLS
- 2017-02-11 Listed $459,000 SDMLS
- 2016-11-05 Listing Removed — SDMLS
- 2016-11-05 Listing Removed — CRMLS
- 2016-09-26 Price Changed $420,000 CRMLS
- 2016-05-06 Listed $459,900 CRMLS
- 2016-05-05 Listed $420,000 SDMLS
- 2013-01-17 Sold (Public Records) $101,500 Public Records
- 2012-09-18 Listing Removed — CRMLS
- 2012-06-12 Pending — CRMLS
- 2012-06-06 Price Changed $219,500 CRMLS
- 2012-06-06 Relisted — CRMLS
- 2011-11-09 Listing Removed — CRMLS
- 2011-07-25 Listed $225,000 CRMLS
- 2006-07-10 Sold (Public Records) $590,000 Public Records
- 2006-04-25 Listing Removed — GPSMLS
- 2006-02-13 Listed $690,000 GPSMLS
- 2005-05-06 Sold (Public Records) $302,000 Public Records
- 2000-02-07 Sold (Public Records) $90,000 Public Records
- 1988-08-19 Sold (Public Records) $210,000 Public Records
Property tax history
-2.1%/yrLatest (2025): $5,236 · +5.1% YoY. Source: county tax records.
Cash-flow waterfall
monthlySold comps — $/sqft
last 12 mo · ≤1 miLoading sold comps…