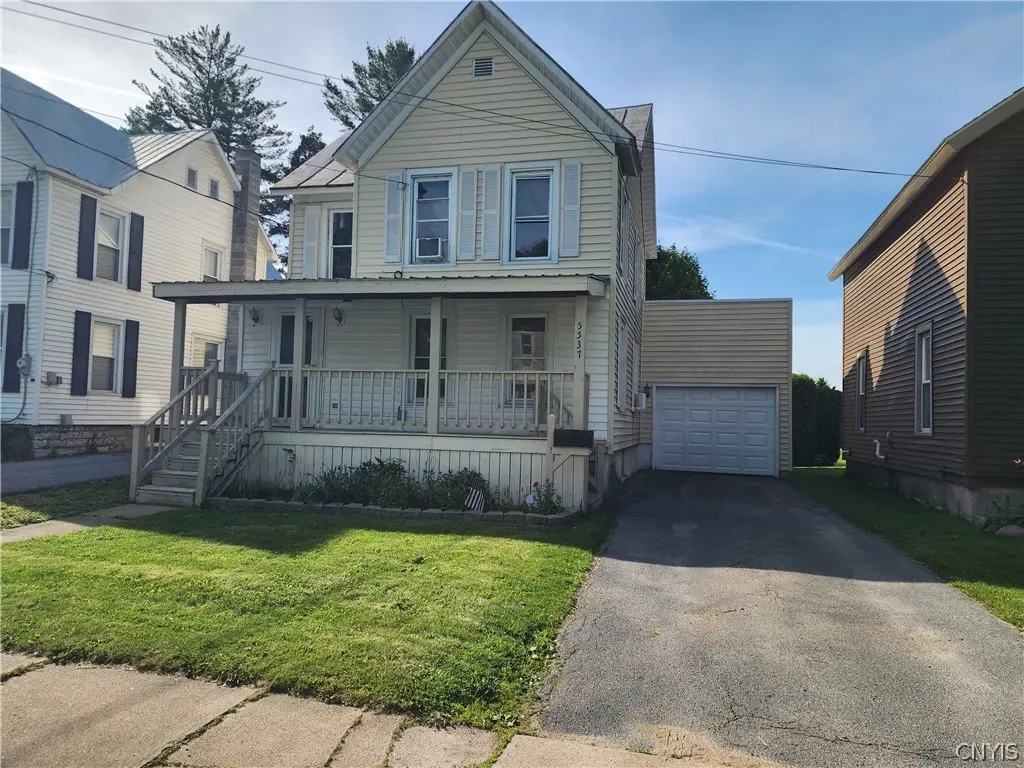
5537 Trinity Ave · Lowville, NY
Flood risk 1/10 · Minimal
- FEMA flood zone
- X
- Chance of flooding over 30 yrs
- 0.0%
- Est. flood insurance / yr
- $473 – $860
Fire risk 1/10 · Minimal
- Est. fire insurance / yr
- $691 – $1,283
Heat risk 1/10 · Minimal
- Hot days now (above 91°F)
- 7 days/yr
- Hot days in 30 yrs
- 16 days/yr
Wind risk 1/10 · Minimal
- Chance of severe wind over 30 yrs
- —
Air-quality risk 2/10 · Minimal
- Unhealthy air days now
- 0 days/yr
- Unhealthy air days in 30 yrs
- 1 days/yr
Risk factors via First Street. Map © Google.
Why this score? — see what drove the D+ grade
The composite is a weighted blend of 9 inputs, each scored 0–100. Each bar is that input's sub-score; the figure is the points it added to the 100-point composite (weight × sub-score).
- ARV discount +10.9/15.0
- Appreciation +10.0/10.0
- Cash flow +8.4/30.0
- Schools +4.5/10.0
- Livability +3.5/5.0
- 1% rule +2.9/10.0
- Rent growth +2.5/5.0
- Condition / age +2.5/5.0
- DSCR +2.3/10.0
$159,500
🖨 Deal sheet (PDF) 📄 Offer letter ✓ Due diligence
Listing remarks MLS
This charming village home is within walking distance to schools and downtown shops. The first floor boasts a living room that opens to the dining room and kitchen creating a great space for entertaining. This home has three bedrooms and one and a half baths and a 2nd floor laundry. Beautiful open front porch and attached garage ideal for outdoor living. Laminant floors, ceiling fans and ample storage add to this home's appeal. Call to see this home today.
Key facts
- Attached garage
- Front porch
- Desirable location
Tags
Property features AI
Exterior
- Parking: Attached garage; 1 garage space
- Utilities: Public water (connected); Sewer connected
- Home design: 2-story house; Existing (resale) property
- Construction: Vinyl siding; Blown-in insulation; Stone foundation
- Exterior features: Blacktop driveway; Irregular residential lot; City street frontage; Lot dimensions approximately 36 x 125
Interior
- Kitchen: Gas oven; Gas range; Microwave; Dishwasher; Refrigerator
- Bedrooms: Total rooms: 8; Laundry room (upper level)
- Flooring: Carpet; Laminate; Vinyl; Varied flooring
- Bathrooms: 1 full bathroom; 1 half bathroom; 1 main-level bathroom
- Heating & cooling: Gas heating; Baseboard heat; Hot water heating
- Interior features: Eat-in kitchen; Full basement
- Laundry & utility: Washer; Dryer; Gas water heater
Neighborhood map
What this means for you Summary
Snapshot
- This is a 3-bed/1.5-bath single-family listed at $160k.
Deal economics
- At list price, monthly cash flow is $-143 ($-2k/yr) — negative.
- To cash-flow at today's rent, offer at most $134k (15.9% below list).
- To meet the 1% rule (rent ≥ 1% of price), the offer needs to be $126k (21.0% below list).
- Recommended offer: $126k (21.0% below list) — sets the bar for 1% rule.
- Cap rate 5.2% vs local median 3.5% in Lowville — top-decile yield for the area; either an underpriced asset or a hidden risk that comps aren't pricing in. Stress-test before assuming the spread holds.
Location & tenants
- Location reads 69/100 on livability (#490 in NY) — a middle-class / working-renter tenant base. Strengths: cost of living A, housing A-, crime B; Watch: health & safety D, amenities F, commute F.
- Lowville Academy & Central School District (town): math 51% / reading 54% proficiency, ranked #345 of 590 in NY (top 58%) — acceptable for families but not a draw, mixed tenant base, ~2y average lease.
- Zoned schools: Lowville Elementary School (math 55% / reading 52%, grade C, #974 of 2,108 statewide, top 46%, 618 students, 50% FRL); Lowville Middle School (math 34% / reading 57%, grade D+, #337 of 729 statewide, top 47%, 297 students, 46% FRL); Lowville High School (math 98% / reading 30%, grade B-, #808 of 1,100 statewide, top 74%, 367 students, 44% FRL).
- Market conditions: 46 active listings in the ZIP; 110 units permitted in Lewis County in 2024 (0 in 5+ unit buildings).
Forward outlook
- In year one you build about $17k of equity ($1k loan paydown + $16k appreciation (10.0% local appreciation)).
- Lewis County population projected at -20% by 2050 — secular population decline; favor cash flow + early exit over multi-decade hold.
- By year 3, paydown + projected appreciation supports a ~$43k cash-out refi (75% LTV) — recoverable capital for the next deal without selling this one.
Negotiation context
- It's been on market 19 days — a 2% lower offer ($157k) is reasonable based on typical stale-listing flexibility.
- 2 sale attempts since 7y ago with the ask held roughly flat each time — persistent listings suggest the price (not the market) is what's stuck; bring a comps-based counter.
- Current owner paid $101k; list at $160k implies a 58% gain — meaningful room to come down on a strong offer.
Risks & watch-outs
- Watch-outs: built in 1905 — expect roof / HVAC / electrical / plumbing capex.
Questions for the listing agent
- What do current leases actually rent for vs. the listed asking? Can we see a recent rent roll and the last 12 months of T-12 income?
- Built in 1905 — when were the roof, HVAC, electrical panel, plumbing, and water heater last replaced?
- Is there a deadline driving the sale (1031 exchange, divorce, estate, relocation)? That informs how much negotiation room exists.
- Schools are A-rated — typically a magnet for longer-tenancy family renters. What's the average tenant stay here, and is there a school-zone premium baked into asking?
- The area grade is low — what's the realistic commute time and amenity access for the typical tenant pool here? Any planned neighborhood developments (good or bad) we should know about?
- What's the average days-on-market for RENTAL listings here right now (not sales)? A rising rental-DOM trend means longer vacancies and softer asking-rent achievability than the comps imply.
- What's the recent tenant-quality profile in this submarket — average credit score on applications, eviction rate, late-payment / NSF rate, and stable-employment percentage? A property-management company in the area should have these aggregated.
- How much new for-sale + rental construction is in the pipeline within 1–3 miles? Heavy new supply typically softens prices + rents 12–24 months out; constrained supply supports both.
Investment metrics
- 1% rule
- 0.79% ✗
- Cap rate
- 5.22%
- Cash-on-cash
- -3.85%
- DSCR
- 0.83
- GRM
- 10.6
CMA / ARV
- ARV (on-the-fly)
- $172,596
- Comps found
- 12
Show comp detail 12 sales within ~0.75 mi
| Address | Dist | Beds/Ba | Sqft | Sold | Price | $/sf | Match |
|---|---|---|---|---|---|---|---|
| 5564 Trinity Ave | 0.10mi | 3/1.5 | 1,452 (-4%) | 3mo | $165,000 | $114 | 86 |
| 7679 Sharp St | 0.13mi | 3/2.0 | 1,604 (+6%) | 3mo | $180,000 | $112 | 79 |
| 7672 Sharp St | 0.17mi | 3/1.5 | 1,462 (-3%) | 12mo | $225,000 | $154 | 76 |
| 5557 Woodlawn Ave | 0.16mi | 3/1.5 | 1,440 (-5%) | 17mo | $289,900 | $201 | 71 |
| 5541 Trinity Ave | 0.02mi | 2/2.0 (-1) | 1,561 (+3%) | 23mo | $133,500 | $86 | 68 |
| 7650 Sharp St | 0.23mi | 3/1.5 | 1,620 (+7%) | 16mo | $159,000 | $98 | 65 |
| 7647 E State St | 0.25mi | 2/1.5 (-1) | 1,671 (+10%) | 3mo | $168,404 | $101 | 63 |
| 7594 E State St | 0.43mi | 3/2.0 | 1,600 (+6%) | 12mo | $225,000 | $141 | 58 |
| 7604 Easton St | 0.66mi | 4/2.5 (+1) | 1,558 (+3%) | 12mo | $210,000 | $135 | 45 |
| 5353 Summit Ave | 0.64mi | 4/1.5 (+1) | 1,459 (-4%) | 19mo | $215,000 | $147 | 43 |
| 5483 River St | 0.55mi | 3/2.0 | 1,664 (+10%) | 18mo | $134,000 | $81 | 41 |
| 5364 Eugene St | 0.55mi | 4/1.5 (+1) | 1,707 (+13%) | 12mo | $186,400 | $109 | 38 |
Match score weights: distance 35% · size 25% · config 20% · recency 20%. Top-matched comps best support the ARV.
Projected returns pro-forma
10.0% appreciation · 3.0% rent growth · sell at horizon
- IRR
- 21.6%
- Equity multiple
- 2.74×
- Total profit
- $77,785
- Equity at exit
- $143,690
- IRR
- 19.5%
- Equity multiple
- 6.29×
- Total profit
- $236,320
- Equity at exit
- $309,873
Cash invested: $44,660 (down + closing). Projections, not guarantees.
Landlord ↔ Tenant lean methodology
- Overall (STATE)
- 15 Strongly Tenant-Friendly
- State New York
- 15 Strongly Tenant-Friendly · D+10
- County
- — inherits STATE
- City
- — inherits STATE
ZIP-level market 13367
- Home prices YoY
- 20.2%
- Active inventory
- 46
- Price-to-rent
- 10.6×
Monthly cashflow live
- Estimated rent
- $1,259 medium interval (Pro) →
- Mortgage (P&I)
- −$836
- Tax from tax record
- −$235 /mo · $2,823/yr
- Insurance
- −$66
- HOA
- −$0
- Vacancy / Maint / Mgmt
- −$264
- Net cashflow
- $-143
Break-even live
Sensitivity live
| Price | -10% $-53 | -5% $-98 | +0% $-143 | +5% $-188 | +10% $-234 |
|---|---|---|---|---|---|
| Rent | -10% $-243 | -5% $-193 | +0% $-143 | +5% $-94 | +10% $-44 |
| Rate | -1.0pp $-63 | -0.5pp $-103 | base $-143 | +0.5pp $-185 | +1.0pp $-227 |
UW: 25.0% down · 7.5% · 30yr · 1.5% tax · 5.0% vac · 8.0% maint · 8.0% mgmt
Financing live
Cash to close
- Down payment
- $39,875
- Closing costs
- $4,785
- Reserves months
- —
- Total cash needed
- —
Loan-product check · same deal, 3 products live
Conventional
25% down · 7.5% · 30yr
- Down + closing
- —
- Monthly P&I
- —
- Monthly cashflow
- —
- DSCR
- —
- Eligible?
- —
Personal DTI + credit; lowest rate.
DSCR
20% down · 8.5% · 30yr
- Down + closing
- —
- Monthly P&I
- —
- Monthly cashflow
- —
- DSCR
- —
- Eligible?
- —
No personal income docs; deal must DSCR.
Hard money
10% down · 12.0% · 12mo
- Down + closing
- —
- Monthly P&I
- —
- Monthly cashflow
- —
- DSCR
- —
- Eligible?
- —
Short-term bridge; refi at stabilization.
Listing history 14 events
-
2026-06-21days on market $159,500 Active 19 DOM
-
2026-06-19days on market $159,500 Active 17 DOM
-
2026-06-18days on market $159,500 Active 16 DOM
-
2026-06-17days on market $159,500 Active 15 DOM
-
2026-06-16days on market $159,500 Active 14 DOM
-
2026-06-15days on market $159,500 Active 13 DOM
-
2026-06-14days on market $159,500 Active 11 DOM
-
2026-06-12days on market $159,500 Active 10 DOM
-
2026-06-09days on market $159,500 Active 7 DOM
-
2026-06-08days on market $159,500 Active 6 DOM
-
2026-06-07days on market $159,500 Active 5 DOM
-
2026-06-05days on market $159,500 Active 2 DOM
-
2026-06-03remarks 699-char remark
-
2026-06-03$159,500 Active 1 DOM
ⓘ Source: listings_history table (triggers on properties + properties_extension) + one-shot
backfill from property_details.listing_events for pre-trigger history.
Tax reassessment forecast NY · Partial reset (capped growth)
- Current annual tax
- $2,823 · $235/mo
- Projected year-2 tax
- $2,823 · $235/mo
- Expected delta
- $0/yr ($0/mo · 0.0%)
ⓘ Screening estimate from a state-policy table — verify with the county assessor before closing.
Climate risk First Street
- Flood 1/10 Low FEMA zone X · 0% chance over 30 yrs
- Wildfire 1/10 Low
- Heat 1/10 Low 7 d/yr ≥91°F today · 16 d/yr by 30 yrs out
- Wind 1/10 Low
- Air quality 2/10 Low 0 unhealthy d/yr today · 1 by 30 yrs out
Nearby sold comps map
Loading sold comps map…
Walkable amenities ~0.75 mi
Loading nearby amenities…
Taxation est. · year 1
- Rental income
- $15,112
- − Mortgage interest
- −$8,934
- − Property taxes
- −$2,823
- − Insurance
- −$798
- − Repairs & maintenance
- −$1,209
- − Management
- −$1,209
- − Depreciation
- −$4,640
- Taxable loss
- −$4,501
- Est. tax savings @ 24.0%
- +$1,080
- After-tax cash flow
- $-639/yr
For passive investors: Depreciation is non-cash, so a rental often shows a tax loss while cash-flowing — sheltering income. Rental losses are passive: they offset passive income freely, and up to $25,000/yr can offset ordinary (W-2) income if you actively participate and your MAGI is under $100k (phasing out to $0 by $150k); unused losses carry forward. On sale, claimed depreciation is recaptured at up to 25%, and gains may owe capital-gains tax (a 1031 exchange can defer both). Figures are a year-1 estimate at your 24.0% rate — not tax advice; consult a CPA.
Schools (NCES district)
- District
- Lowville Academy & Central School District
- NCES district ID
- 3617820
- Math proficiency
- 51% ▼ -9.00%
- Reading proficiency
- 54% ▼ -7.00%
- Median HH income
- $47,554
- Composite
- 44.62/100
- National rank
- #2773
- State rank
- #345 of 590 in NY
Livability — Lowville
- Score
- 69/100
- State rank
- #490
- US rank
- #8619
Category grades
Schools grade is shown separately in the Schools card above.
Census & demographics
- Census place
- Lowville, NY
- Population (ZIP)
- 8,786
Population outlook (Lewis County) Hauer SSP2
- Today (2025)
- 26,126 people
- By 2030
- 25,354 · -3.0%
- By 2040
- 23,359 · -10.6%
- By 2050
- 20,927 · -19.9%
- By 2075
- 15,533 · -40.5%
- By 2100
- 10,215 · -60.9%
Race, ethnicity, and origin ACS 2023
- Neighborhood character
- Predominantly White (91%)
- Race & ethnicity
- White 91% Two or more races 5% Hispanic / Latino 4% Black 1%
- Common ancestry
- Lithuanian 9% Romanian 5% Iranian 2%
- Foreign-born
- 2% · Canada
- Languages at home
- 96% English-only · Spanish 3%
Political lean MEDSL · Lewis
- 2024 margin
- Solid R (+44.4) · D 27.8% · R 72.2%
- 2008→2024 swing
- -35.6pp toward R · 2008: -8.8pp · 2024: -44.4pp
- All cycles
- 2024: R+44.4 2020: R+39.2 2016: R+39.6 2012: R+8.7 2008: R+8.8
Not yet ingested
- Civics
- —
Market trends
- HPI YoY
- ▲ 49.81%
- Current HPI
- 296.4815
- Rent YoY
- —
- Metro
- —
- State GDP YoY
- ▲ 2.60%
- F500 in state
- 92
Industry mix (Fortune 500 HQ in NY)
| Industry | F500 HQs | Revenue |
|---|---|---|
| Financial Services | 10 | $950B |
|
||
| Consumer Goods | 9 | $162B |
|
||
| Insurance | 4 | $225B |
|
||
| Telecommunications | 2 | $144B |
|
||
| Pharmaceuticals | 2 | $112B |
|
||
| Media / Entertainment | 2 | $69B |
|
||
Price history
+254.4% since first listed5 events — show timeline
- 2026-06-02 Listed $159,500 CNYIS
- 2020-07-21 Sold (Public Records) $101,000 Public Records
- 2020-07-20 Sold (MLS) $95,000 CNYIS
- 2019-08-30 Listed $100,000 CNYIS
- 2002-05-06 Sold (Public Records) $45,000 Public Records
Property tax history
+3.1%/yrLatest (2025): $2,823 · +9.0% YoY. Source: county tax records.
Cash-flow waterfall
monthlySold comps — $/sqft
last 12 mo · ≤1 miLoading sold comps…