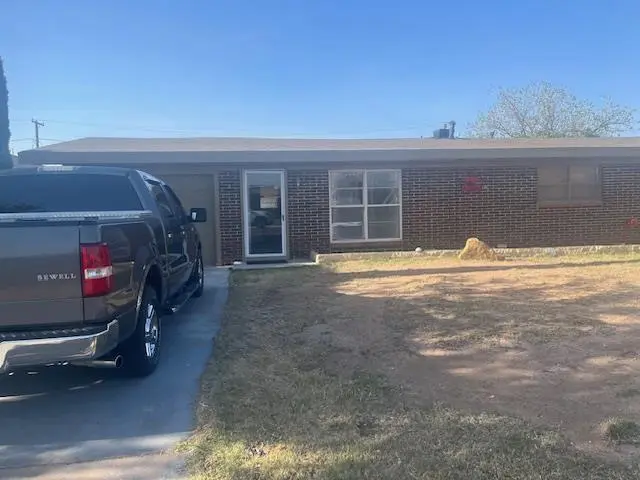
4314 Mercedes Dr · Midland, TX
Flood risk 1/10 · Minimal
- FEMA flood zone
- X
- Chance of flooding over 30 yrs
- 0.0%
- Est. flood insurance / yr
- $507 – $1,088
Fire risk 8/10 · Major
- Est. fire insurance / yr
- $1,222 – $2,270
Heat risk 6/10 · Moderate
- Hot days now (above 102°F)
- 7 days/yr
- Hot days in 30 yrs
- 22 days/yr
Wind risk 2/10 · Minimal
- Chance of severe wind over 30 yrs
- 3.0%
Air-quality risk 1/10 · Minimal
- Unhealthy air days now
- 0 days/yr
- Unhealthy air days in 30 yrs
- 0 days/yr
Risk factors via First Street. Map © Google.
Why this score? — see what drove the D grade
The composite is a weighted blend of 9 inputs, each scored 0–100. Each bar is that input's sub-score; the figure is the points it added to the 100-point composite (weight × sub-score).
- Cash flow +20.2/30.0
- DSCR +6.4/10.0
- 1% rule +4.8/10.0
- Livability +4.0/5.0
- Schools +3.2/10.0
- Condition / age +2.5/5.0
- Rent growth +2.4/5.0
- ARV discount +0.0/15.0
- Appreciation +0.0/10.0
$195,000
🖨 Deal sheet (PDF) 📄 Offer letter ✓ Due diligence
Listing remarks MLS
Great investment house. The outside has been painted and the roof is 1 1/2 years old There is a storage building in back yard. The inside walls have been repaired and just need painting. This is a great starter home with 3bed, and 2 baths. Really a great investment. Call A Realtor for your showing today. Nice sized back yard . Sols AS IS Where Is
Key facts
- Storage building
- Nice sized back yard
- Painted outside
Tags
Neighborhood map
What this means for you Summary
Snapshot
- This is a 3-bed/1.5-bath single-family listed at $195k.
Deal economics
- At list price, monthly cash flow is $246 ($3k/yr) — positive.
- The deal already cash-flows at list — no discount required.
- To meet the 1% rule (rent ≥ 1% of price), the offer needs to be $191k (1.9% below list).
- Recommended offer: $183k (6.0% below list) — sets the bar for market timing.
- Cap rate 7.8% vs local median 4.7% in Midland — top-decile yield for the area; either an underpriced asset or a hidden risk that comps aren't pricing in. Stress-test before assuming the spread holds.
Location & tenants
- Location reads 79/100 on livability (#57 in TX, #2,192 nationally) — a middle-class / working-renter tenant base. Strengths: employment A+, housing A+, health & safety A+; Watch: crime C-, commute D+, amenities D.
- Midland ISD (urban): math 34% / reading 36% proficiency, ranked #477 of 826 in TX (top 58%) — families likely to look elsewhere, expect single-tenant / working-renter base with shorter leases.
- Zoned schools: Long El (math 36% / reading 25%, grade F, #2,464 of 4,322 statewide, top 58%, 667 students, 80% FRL); Alamo J H (math 23% / reading 32%, grade F, #1,156 of 1,662 statewide, top 71%, 865 students, 62% FRL); Legacy H S (math 37% / reading 3%, grade F, #1,397 of 1,632 statewide, top 87%, 2,504 students, 41% FRL).
- Market conditions: Rents soft (-0.3%/yr); 65 active listings in the ZIP; 32 comparable units currently listed for rent nearby; rentals at typical pace (median 23d on market — plan ~3-4 weeks tenant-placement turnaround); solid renter incomes; 1,504 units permitted in Midland County in 2024 (0 in 5+ unit buildings).
Forward outlook
- Local home prices are declining (-3.0%/yr); year-one equity from $1k of loan paydown is wiped out by about $6k of value loss. Plan a longer hold.
- Midland County population projected at +83% by 2050 — long-run rental-demand tailwind backs the buy-and-hold thesis.
Negotiation context
- It's been on market 82 days — a 6% lower offer ($183k) is reasonable based on typical stale-listing flexibility.
Risks & watch-outs
- Watch-outs: built in 1955 — expect roof / HVAC / electrical / plumbing capex.
- Climate carrying-cost: severe wildfire risk; extreme-heat days projected 7→22/yr by 2055 (HVAC capex compounding) — expect insurance premiums to compound above CPI over the hold.
Questions for the listing agent
- It's been on market 82 days. Have you received any prior offers? Is the seller open to a 6% concession, seller financing, or rate buy-down credit?
- Built in 1955 — when were the roof, HVAC, electrical panel, plumbing, and water heater last replaced?
- Why hasn't it sold? Are there any deal-killer items the seller is aware of (foundation, flood, title, zoning, code violations)?
- Is there a deadline driving the sale (1031 exchange, divorce, estate, relocation)? That informs how much negotiation room exists.
- The area grade is low — what's the realistic commute time and amenity access for the typical tenant pool here? Any planned neighborhood developments (good or bad) we should know about?
- What's the average days-on-market for RENTAL listings here right now (not sales)? A rising rental-DOM trend means longer vacancies and softer asking-rent achievability than the comps imply.
- What's the recent tenant-quality profile in this submarket — average credit score on applications, eviction rate, late-payment / NSF rate, and stable-employment percentage? A property-management company in the area should have these aggregated.
- How much new for-sale + rental construction is in the pipeline within 1–3 miles? Heavy new supply typically softens prices + rents 12–24 months out; constrained supply supports both.
Investment metrics
- 1% rule
- 0.98% ✗
- Cap rate
- 7.81%
- Cash-on-cash
- 5.41%
- DSCR
- 1.24
- GRM
- 8.5
CMA / ARV
- ARV (median comp)
- $157,099
- List price
- $195,000
- Delta
- 24.13%
- Verdict
- OVERPRICED
- Comps
- 5 within 1.0 mi
Show comp detail 3 sales within ~0.75 mi
| Address | Dist | Beds/Ba | Sqft | Sold | Price | $/sf | Match |
|---|---|---|---|---|---|---|---|
| 4626 Wilshire Dr | 0.48mi | 3/2.0 | 1,166 (-3%) | 8mo | $160,000 | $137 | 64 |
| 900 Canyon Dr | 0.54mi | 3/2.0 | 1,150 (-4%) | 13mo | $146,469 | $127 | 55 |
| 4210 Pleasant Dr | 0.48mi | 3/1.0 | 1,259 (+5%) | 15mo | $160,000 | $127 | 55 |
Match score weights: distance 35% · size 25% · config 20% · recency 20%. Top-matched comps best support the ARV.
Projected returns pro-forma
-3.0% appreciation · 0.0% rent growth · sell at horizon
- IRR
- -11.2%
- Equity multiple
- 0.61×
- Total profit
- $-21,557
- Equity at exit
- $29,075
- IRR
- -6.7%
- Equity multiple
- 0.63×
- Total profit
- $-20,351
- Equity at exit
- $16,860
Cash invested: $54,600 (down + closing). Projections, not guarantees.
Landlord ↔ Tenant lean methodology
- Overall (STATE)
- 87 Strongly Landlord-Friendly
- State Texas
- 87 Strongly Landlord-Friendly · R+5
- County
- — inherits STATE
- City
- — inherits STATE
ZIP-level market 79703
- Rents YoY
- -0.3%
- Active inventory
- 65
- Price-to-rent
- 8.5×
Monthly cashflow live
- Estimated rent
- $1,913 high interval (Pro) →
- Mortgage (P&I)
- −$1,023
- Tax from tax record
- −$162 /mo · $1,939/yr
- Insurance
- −$81
- HOA
- −$0
- Vacancy / Maint / Mgmt
- −$402
- Net cashflow
- $246
Break-even live
Sensitivity live
| Price | -10% $356 | -5% $301 | +0% $246 | +5% $191 | +10% $136 |
|---|---|---|---|---|---|
| Rent | -10% $95 | -5% $170 | +0% $246 | +5% $322 | +10% $397 |
| Rate | -1.0pp $344 | -0.5pp $296 | base $246 | +0.5pp $195 | +1.0pp $144 |
UW: 25.0% down · 7.5% · 30yr · 1.5% tax · 5.0% vac · 8.0% maint · 8.0% mgmt
Financing live
Cash to close
- Down payment
- $48,750
- Closing costs
- $5,850
- Reserves months
- —
- Total cash needed
- —
Loan-product check · same deal, 3 products live
Conventional
25% down · 7.5% · 30yr
- Down + closing
- —
- Monthly P&I
- —
- Monthly cashflow
- —
- DSCR
- —
- Eligible?
- —
Personal DTI + credit; lowest rate.
DSCR
20% down · 8.5% · 30yr
- Down + closing
- —
- Monthly P&I
- —
- Monthly cashflow
- —
- DSCR
- —
- Eligible?
- —
No personal income docs; deal must DSCR.
Hard money
10% down · 12.0% · 12mo
- Down + closing
- —
- Monthly P&I
- —
- Monthly cashflow
- —
- DSCR
- —
- Eligible?
- —
Short-term bridge; refi at stabilization.
Rent comps 32 comps
| Address | Beds | Baths | Sqft | Rent | $/sqft | DOM | Units | Dist |
|---|---|---|---|---|---|---|---|---|
| 4409 Roosevelt Dr Midland, TX | 3.0 | 2.0 | 1230 | $1,750 | $1.42 | 46d | 1 | 0.24mi |
| 3811 Cedar Spring Dr Midland, TX | 4.0 | 2.0 | 1500 | $2,600 | $1.73 | 45d | 1 | 0.36mi |
| 4000 W Illinois Ave Midland, TX | 1.0–2.0 | 1.0–2.0 | 755 | $1,545 | $2.05 | 23d | 10 | 0.49mi |
| 123 N Glenwood Dr Unit A Midland, TX | 2.0 | 1.0 | 1000 | $1,695 | $1.70 | 45d | 1 | 0.54mi |
| 117 N Glenwood Dr Unit D Midland, TX | 2.0 | 2.0 | 1000 | $1,795 | $1.79 | 23d | 1 | 0.55mi |
| 4707 Shadylane Dr Unit B Midland, TX | 2.0 | 1.0 | 960 | $1,400 | $1.46 | 15d | 1 | 0.57mi |
| 4701 W Illinois Ave Unit D Midland, TX | 2.0 | 1.0 | 942 | $1,050 | $1.11 | 23d | 1 | 0.59mi |
| 509 Delmar St Midland, TX | 1.0–2.0 | 1.0–2.5 | 1116 | $1,796 | $1.61 | 15d | 8 | 0.60mi |
| 4506 Storey Ave Midland, TX | 3.0 | 1.0 | 1400 | $1,650 | $1.18 | 15d | 1 | 0.62mi |
| 4610 Storey Ave Midland, TX | 3.0 | 2.0 | 1184 | $1,899 | $1.60 | 23d | 1 | 0.64mi |
| 4313 Storey Ave Unit A Midland, TX | 3.0 | 2.0 | 1255 | $2,000 | $1.59 | 45d | 1 | 0.65mi |
| 4403 Crockett Ave Unit A Midland, TX | 3.0 | 2.0 | 1065 | $1,800 | $1.69 | 23d | 1 | 0.67mi |
| 4405 Crockett Ave Unit A Midland, TX | 3.0 | 2.0 | 1100 | $1,800 | $1.64 | 45d | 1 | 0.67mi |
| 4503 Crockett Ave Unit B Midland, TX | 2.0 | 2.0 | 1250 | $2,000 | $1.60 | 45d | 1 | 0.69mi |
| 4519 Crockett Ave Midland, TX | 2.0 | 2.0 | 1465 | $1,900 | $1.30 | 23d | 1 | 0.70mi |
| 4525 Crockett Ave Midland, TX | 2.0 | 2.0 | 1400 | $4,250 | $3.04 | 23d | 1 | 0.71mi |
| 3712 Amelia Dr Midland, TX | 3.0 | 1.0 | 1046 | $2,000 | $1.91 | 23d | 1 | 0.74mi |
| 3506 Apache Dr Midland, TX | 2.0 | 1.0 | 1004 | $1,800 | $1.79 | 23d | 1 | 0.81mi |
| 3403 Thomas Ave Midland, TX | 2.0 | 2.0 | 1472 | $2,000 | $1.36 | 15d | 1 | 0.84mi |
| 5109 Graceland Dr Unit A Midland, TX | 3.0 | 2.0 | 1365 | $2,250 | $1.65 | 45d | 1 | 0.91mi |
| 4719 Bowie Dr Midland, TX | 3.0 | 2.0 | 991 | $4,500 | $4.54 | 23d | 1 | 0.94mi |
| 5202 Ric Dr Midland, TX | 3.0 | 2.0 | 1258 | $1,975 | $1.57 | 23d | 1 | 1.13mi |
| 516 North Loop 250 W Midland, TX | 1.0–2.0 | 1.0–2.0 | 757 | $1,724 | $2.28 | 15d | 28 | 1.14mi |
| 3311 Storey Ave Midland, TX | 3.0 | 1.5 | 1100 | $1,700 | $1.55 | 15d | 1 | 1.17mi |
| 4600 Andrews Hwy Midland, TX | 1.0–3.0 | 1.0–2.0 | 1117 | $2,590 | $2.32 | 45d | 5 | 1.25mi |
| 3100 Thomas Ave Midland, TX | 3.0 | 1.0 | 1300 | $2,400 | $1.85 | 45d | 1 | 1.29mi |
| 2812 Mariana Ave Midland, TX | 3.0 | 1.5 | 1443 | $1,750 | $1.21 | 45d | 1 | 1.35mi |
| 3601 Andrews Hwy Midland, TX | 2.0 | 1.0–2.0 | 800 | $1,615 | $2.02 | 15d | 16 | 1.36mi |
| 3007 W Louisiana Ave Midland, TX | 2.0 | 1.0 | 925 | $1,079 | $1.17 | 23d | 1 | 1.46mi |
| 2910 W Michigan Ave Unit 110 Midland, TX | 2.0 | 1.0 | 980 | $1,250 | $1.28 | 45d | 1 | 1.49mi |
| 2910 W Michigan Ave Unit 110 Midland, TX | 2.0 | 1.0 | 980 | $1,250 | $1.28 | 15d | 1 | 1.49mi |
| 2910 W Michigan Ave Unit 101 Midland, TX | 2.0 | 2.0 | 1215 | $1,350 | $1.11 | 45d | 1 | 1.49mi |
Listing history 22 events
-
2026-06-22days on market $195,000 Active 82 DOM
-
2026-06-19days on market $195,000 Active 80 DOM
-
2026-06-18days on market $195,000 Active 79 DOM
-
2026-06-17days on market $195,000 Active 78 DOM
-
2026-06-16days on market $195,000 Active 77 DOM
-
2026-06-15days on market $195,000 Active 76 DOM
-
2026-06-14days on market $195,000 Active 74 DOM
-
2026-06-13days on market $195,000 Active 73 DOM
-
2026-06-10days on market $195,000 Active 71 DOM
-
2026-06-09days on market $195,000 Active 70 DOM
-
2026-06-08days on market $195,000 Active 69 DOM
-
2026-06-07days on market $195,000 Active 68 DOM
-
2026-06-03days on market $195,000 Active 64 DOM
-
2026-06-02days on market $195,000 Active 63 DOM
-
2026-06-01days on market $195,000 Active 62 DOM
-
2026-05-31days on market $195,000 Active 61 DOM
-
2026-05-30days on market $195,000 Active 60 DOM
-
2026-03-31$195,000 Active 349-char remark
Show marketing remark (349 chars)
Great investment house. The outside has been painted and the roof is 1 1/2 years old There is a storage building in back yard. The inside walls have been repaired and just need painting. This is a great starter home with 3bed, and 2 baths. Really a great investment. Call A Realtor for your showing today. Nice sized back yard . Sols AS IS Where Is
-
2026-02-12soldstatus
-
2026-02-12soldstatus
-
2006-03-13soldstatus
-
2003-12-31soldstatus
ⓘ Source: listings_history table (triggers on properties + properties_extension) + one-shot
backfill from property_details.listing_events for pre-trigger history.
Tax reassessment forecast TX · Resets to sale price
- Current annual tax
- $1,939 · $162/mo
- Projected year-2 tax
- $3,568 · $297/mo
- Expected delta
- +$1,630/yr (+$136/mo · 84.0%)
ⓘ Screening estimate from a state-policy table — verify with the county assessor before closing.
Climate risk First Street
- Flood 1/10 Low FEMA zone X · 0% chance over 30 yrs
- Wildfire 8/10 Severe
- Heat 6/10 Major 7 d/yr ≥102°F today · 22 d/yr by 30 yrs out
- Wind 2/10 Low 3% chance of damaging wind over 30 yrs
- Air quality 1/10 Low 0 unhealthy d/yr today · 0 by 30 yrs out
Nearby sold comps map
Loading sold comps map…
Walkable amenities ~0.75 mi
Loading nearby amenities…
Taxation est. · year 1
- Rental income
- $22,959
- − Mortgage interest
- −$10,923
- − Property taxes
- −$1,939
- − Insurance
- −$975
- − Repairs & maintenance
- −$1,837
- − Management
- −$1,837
- − Depreciation
- −$5,673
- Taxable loss
- −$224
- Est. tax savings @ 24.0%
- +$54
- After-tax cash flow
- $3,006/yr
For passive investors: Depreciation is non-cash, so a rental often shows a tax loss while cash-flowing — sheltering income. Rental losses are passive: they offset passive income freely, and up to $25,000/yr can offset ordinary (W-2) income if you actively participate and your MAGI is under $100k (phasing out to $0 by $150k); unused losses carry forward. On sale, claimed depreciation is recaptured at up to 25%, and gains may owe capital-gains tax (a 1031 exchange can defer both). Figures are a year-1 estimate at your 24.0% rate — not tax advice; consult a CPA.
Schools (NCES district)
- District
- Midland ISD
- NCES district ID
- 4830570
- Math proficiency
- 34% ▼ -7.00%
- Reading proficiency
- 36% ▬ 0.00%
- Median HH income
- $63,457
- Composite
- 31.63/100
- National rank
- #5938
- State rank
- #477 of 826 in TX
Livability — Midland
- Score
- 79/100
- State rank
- #57
- US rank
- #2192
Category grades
Schools grade is shown separately in the Schools card above.
Census & demographics
- Census place
- Midland, TX
- County
- Midland County · 168,494 people
- City population
- 168,494
- Metro
- Midland, TX
- Population (ZIP)
- 20,419
- Household income
- $77,285
- Rent vs Own
- Severe rent burden
- 417.0
Population outlook (Midland County) Hauer SSP2
- Today (2025)
- 220,895 people
- By 2030
- 253,667 · +14.8%
- By 2040
- 325,498 · +47.4%
- By 2050
- 404,168 · +83.0%
- By 2075
- 609,802 · +176.1%
- By 2100
- 760,172 · +244.1%
Race, ethnicity, and origin ACS 2023
- Neighborhood character
- Diverse neighborhood (Simpson 0.59)
- Race & ethnicity
- Hispanic / Latino 54% White 34% Two or more races 16% Black 8% Asian 2%
- Hispanic origin (detail)
- Mexican 45% Cuban 4%
- Common ancestry
- Slovak 1% Italian 1% Serbian 1%
- Foreign-born
- 20% · Canada, Jamaica, Vietnam
- Languages at home
- 58% English-only · Spanish 38% Arabic 1% Chinese 1%
Political lean MEDSL · Midland
- 2024 margin
- Solid R (+60.5) · D 19.3% · R 79.8%
- 2008→2024 swing
- -3.3pp toward R · 2008: -57.3pp · 2024: -60.5pp
- All cycles
- 2024: R+60.5 2020: R+56.6 2016: R+55.2 2012: R+61.5 2008: R+57.3
Not yet ingested
- Civics
- —
Market trends
- HPI YoY
- ▼ -250.72%
- Current HPI
- 224.6222
- Rent YoY
- ▼ -0.33%
- Metro
- Midland, TX
- State GDP YoY
- ▲ 3.95%
- F500 in state
- 110
Industry mix (Fortune 500 HQ in TX)
| Industry | F500 HQs | Revenue |
|---|---|---|
| Energy | 16 | $1,198B |
|
||
| Technology | 5 | $198B |
|
||
| Engineering / Construction | 4 | $72B |
|
||
| Energy Services | 3 | $60B |
|
||
| Utilities | 3 | $41B |
|
||
| Healthcare | 2 | $330B |
|
||
Price history
5 events — show timeline
- 2026-03-31 Listed $195,000 ODMLS
- 2026-02-12 Sold (Public Records) — Public Records
- 2026-02-12 Sold (Public Records) — Public Records
- 2006-03-13 Sold (Public Records) — Public Records
- 2003-12-31 Sold (Public Records) — Public Records
Property tax history
+1.0%/yrLatest (2025): $1,939 · -3.4% YoY. Source: county tax records.
Cash-flow waterfall
monthlySold comps — $/sqft
last 12 mo · ≤1 miLoading sold comps…