144 Easy St · Jefferson, NY
Flood risk 1/10 · Minimal
- FEMA flood zone
- X (unshaded)
- Chance of flooding over 30 yrs
- 0.0%
- Est. flood insurance / yr
- $507 – $1,088
Fire risk 1/10 · Minimal
- Est. fire insurance / yr
- $691 – $1,283
Heat risk 1/10 · Minimal
- Hot days now (above 87°F)
- 7 days/yr
- Hot days in 30 yrs
- 16 days/yr
Wind risk 2/10 · Minimal
- Chance of severe wind over 30 yrs
- 2.0%
Air-quality risk 2/10 · Minimal
- Unhealthy air days now
- 0 days/yr
- Unhealthy air days in 30 yrs
- 1 days/yr
Risk factors via First Street. Map © Google.
Why this score? — see what drove the C+ grade
The composite is a weighted blend of 9 inputs, each scored 0–100. Each bar is that input's sub-score; the figure is the points it added to the 100-point composite (weight × sub-score).
- Cash flow +23.5/30.0
- Appreciation +7.6/10.0
- DSCR +7.5/10.0
- ARV discount +7.5/15.0
- 1% rule +6.3/10.0
- Schools +3.4/10.0
- Rent growth +2.5/5.0
- Livability +2.5/5.0
- Condition / age +2.5/5.0
$279,000
🖨 Deal sheet 📄 Offer letter ✓ Due diligence
Listing remarks
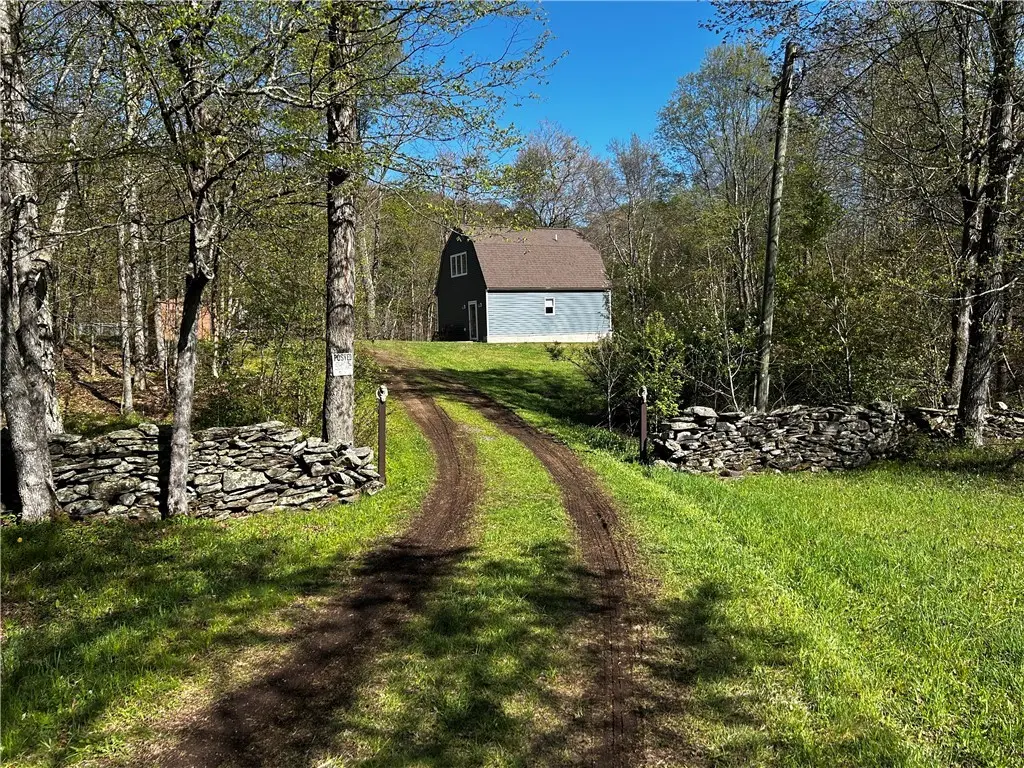
Welcome to your dream Catskills retreat! Tucked away on a quiet, private road, 144 Easy St offers the perfect blend of modern luxury and rustic tranquility. This 1,144 sq ft cabin has been newly and fully renovated from top to bottom, leaving absolutely nothing for you to do but move in and enjoy. The main level features a sleek, efficiently designed galley-type kitchen that flows seamlessly into the bright living space. Upstairs, escape to your expansive, private second-floor owner's suite, complete with a beautifully appointed full bathroom. Outside, your personal 6.33-acre paradise awaits. Explore a gorgeous mix of mature woods and open meadows, or unwind by the edge of your very own pri
Key facts
- Bright living space
- Fully renovated
- Galley-type kitchen
Tags
Property features AI
Exterior
- Parking: No garage
- Utilities: Electricity connected; Well water; Septic tank
- Home design: 2 stories; Existing construction
- Construction: Frame construction; Asphalt shingle roof; Poured foundation
- Exterior features: Dirt driveway; Gravel driveway; Shed(s); Storage; Pond waterfront
Interior
- Kitchen: Dishwasher; Free-standing range; Oven; Refrigerator
- Bedrooms: 1 bedroom on the main level
- Flooring: Luxury vinyl
- Bathrooms: 1 full bathroom
- Heating & cooling: Electric baseboard heating
- Interior features: Galley kitchen; Sliding glass doors; Sliding doors
- Laundry & utility: Electric water heater
Neighborhood map
What this means for you Summary
Snapshot
- This is a 2-bed/1.0-bath single-family listed at $279k.
Deal economics
- At list price, monthly cash flow is $519 ($6k/yr) — positive.
- The deal already cash-flows at list — no discount required.
- Meets the 1% rule at list price ($3k rent vs $279k).
- Recommended offer: $275k (1.5% below list) — sets the bar for market timing.
Location & tenants
- Location reads: area grade C — affects rentability + tenant quality, not the cash-flow math above.
- Stamford Central School District (rural): math 40% / reading 35% proficiency, ranked #675 of 755 in NY (top 89%) — families likely to look elsewhere, expect single-tenant / working-renter base with shorter leases.
- Market conditions: 36 active listings in the ZIP; 35 units permitted in Schoharie County in 2024 (0 in 5+ unit buildings).
Forward outlook
- In year one you build about $16k of equity ($2k loan paydown + $15k appreciation (5.2% local appreciation)).
- Schoharie County population projected at -30% by 2050 — secular population decline; favor cash flow + early exit over multi-decade hold.
- At projected returns (5.2% appreciation + 3.0% rent growth), your $78k cash investment doubles in ~4 years — after that, you're playing with house money.
- By year 3, paydown + projected appreciation supports a ~$41k cash-out refi (75% LTV) — recoverable capital for the next deal without selling this one.
Negotiation context
- It's been on market 28 days — a 2% lower offer ($275k) is reasonable based on typical stale-listing flexibility.
- 2 sale attempts since 3y ago with the ask held roughly flat each time — persistent listings suggest the price (not the market) is what's stuck; bring a comps-based counter.
- Current owner paid $20k; list at $279k implies a 1295% gain — meaningful room to come down on a strong offer.
Questions for the listing agent
- Is there a deadline driving the sale (1031 exchange, divorce, estate, relocation)? That informs how much negotiation room exists.
- What's the average days-on-market for RENTAL listings here right now (not sales)? A rising rental-DOM trend means longer vacancies and softer asking-rent achievability than the comps imply.
- What's the recent tenant-quality profile in this submarket — average credit score on applications, eviction rate, late-payment / NSF rate, and stable-employment percentage? A property-management company in the area should have these aggregated.
- How much new for-sale + rental construction is in the pipeline within 1–3 miles? Heavy new supply typically softens prices + rents 12–24 months out; constrained supply supports both.
Investment metrics
- 1% rule
- 1.13% ✓
- Cap rate
- 8.52%
- Cash-on-cash
- 7.97%
- DSCR
- 1.35
- GRM
- 7.4
CMA / ARV
No comps found within radius.
Projected returns pro-forma
5.21% appreciation · 3.0% rent growth · sell at horizon
- IRR
- 20.2%
- Equity multiple
- 2.29×
- Total profit
- $100,737
- Equity at exit
- $161,626
- IRR
- 19.9%
- Equity multiple
- 4.52×
- Total profit
- $274,638
- Equity at exit
- $281,900
Cash invested: $78,120 (down + closing). Projections, not guarantees.
Landlord ↔ Tenant lean methodology
- Overall (STATE)
- 15 Strongly Tenant-Friendly
- State New York
- 15 Strongly Tenant-Friendly · D+10
- County
- — inherits STATE
- City
- — inherits STATE
ZIP-level market 12167
- Home prices YoY
- 1.4%
- Active inventory
- 36
- Price-to-rent
- 7.4×
Monthly cashflow live
- Estimated rent
- $3,151 medium interval (Pro) →
- Mortgage (P&I)
- −$1,463
- Tax from tax record
- −$391 /mo · $4,689/yr
- Insurance
- −$116
- HOA
- −$0
- Vacancy / Maint / Mgmt
- −$662
- Net cashflow
- $519
Break-even live
UW: 25.0% down · 7.5% · 30yr · 1.5% tax · 5.0% vac · 8.0% maint · 8.0% mgmt
Financing live
Cash to close
- Down payment
- $69,750
- Closing costs
- $8,370
- Reserves months
- —
- Total cash needed
- —
Loan-product check · same deal, 3 products live
Conventional
25% down · 7.5% · 30yr
- Down + closing
- —
- Monthly P&I
- —
- Monthly cashflow
- —
- DSCR
- —
- Eligible?
- —
Personal DTI + credit; lowest rate.
DSCR
20% down · 8.5% · 30yr
- Down + closing
- —
- Monthly P&I
- —
- Monthly cashflow
- —
- DSCR
- —
- Eligible?
- —
No personal income docs; deal must DSCR.
Hard money
10% down · 12.0% · 12mo
- Down + closing
- —
- Monthly P&I
- —
- Monthly cashflow
- —
- DSCR
- —
- Eligible?
- —
Short-term bridge; refi at stabilization.
Listing history 19 events
-
2026-06-18days on market $279,000 Active 28 DOM
-
2026-06-17days on market $279,000 Active 27 DOM
-
2026-06-16days on market $279,000 Active 26 DOM
-
2026-06-15days on market $279,000 Active 25 DOM
-
2026-06-13days on market $279,000 Active 23 DOM
-
2026-06-12days on market $279,000 Active 22 DOM
-
2026-06-09days on market $279,000 Active 19 DOM
-
2026-06-08days on market $279,000 Active 18 DOM
-
2026-06-07days on market $279,000 Active 17 DOM
-
2026-06-07days on market $279,000 Active 16 DOM
-
2026-06-04days on market $279,000 Active 13 DOM
-
2026-06-02days on market $279,000 Active 12 DOM
-
2026-06-01days on market $279,000 Active 11 DOM
-
2026-05-31days on market $279,000 Active 10 DOM
-
2026-05-21$279,000 Active
-
2024-01-16historical
-
2023-08-08historical
-
2023-07-22$189,000 Active
-
1994-10-11soldstatus $20,000
ⓘ Source: listings_history table (triggers on properties + properties_extension) + one-shot
backfill from property_details.listing_events for pre-trigger history.
Tax reassessment forecast NY · Partial reset (capped growth)
- Current annual tax
- $4,689 · $391/mo
- Projected year-2 tax
- $4,702 · $392/mo
- Expected delta
- +$13/yr (+$1/mo · 0.3%)
ⓘ Screening estimate from a state-policy table — verify with the county assessor before closing.
Climate risk First Street
- Flood 1/10 Low FEMA zone X (unshaded) · 0% chance over 30 yrs
- Wildfire 1/10 Low
- Heat 1/10 Low 7 d/yr ≥87°F today · 16 d/yr by 30 yrs out
- Wind 2/10 Low 2% chance of damaging wind over 30 yrs
- Air quality 2/10 Low 0 unhealthy d/yr today · 1 by 30 yrs out
Nearby sold comps map
Loading sold comps map…
Walkable amenities ~0.75 mi
Loading nearby amenities…
Taxation est. · year 1
- Rental income
- $37,808
- − Mortgage interest
- −$15,628
- − Property taxes
- −$4,689
- − Insurance
- −$1,395
- − Repairs & maintenance
- −$3,025
- − Management
- −$3,025
- − Depreciation
- −$8,116
- Taxable income
- $1,930
- Est. tax owed @ 24.0%
- −$463
- After-tax cash flow
- $5,764/yr
For passive investors: Depreciation is non-cash, so a rental often shows a tax loss while cash-flowing — sheltering income. Rental losses are passive: they offset passive income freely, and up to $25,000/yr can offset ordinary (W-2) income if you actively participate and your MAGI is under $100k (phasing out to $0 by $150k); unused losses carry forward. On sale, claimed depreciation is recaptured at up to 25%, and gains may owe capital-gains tax (a 1031 exchange can defer both). Figures are a year-1 estimate at your 24.0% rate — not tax advice; consult a CPA.
Schools (NCES district)
- District
- Stamford Central School District
- NCES district ID
- 3628020
- Math proficiency
- 40% ▼ -10.00%
- Reading proficiency
- 35% ▼ -10.00%
- Median HH income
- $42,968
- Composite
- 34.29/100
- National rank
- #10231
- State rank
- #675 of 755 in NY
Livability — Jefferson
No livability data for this city. (Only ~50 U.S. cities are tracked.)
Census & demographics
- Population (ZIP)
- 2,257
Population outlook (Schoharie County) Hauer SSP2
- Today (2025)
- 29,080 people
- By 2030
- 27,417 · -5.7%
- By 2040
- 23,835 · -18.0%
- By 2050
- 20,482 · -29.6%
- By 2075
- 14,323 · -50.7%
- By 2100
- 9,636 · -66.9%
Race, ethnicity, and origin ACS 2023
- Neighborhood character
- Predominantly White (94%)
- Race & ethnicity
- White 94% Two or more races 4% Hispanic / Latino 2%
- Common ancestry
- Romanian 8% Iranian 3% Lithuanian 2%
- Foreign-born
- 3% · Canada, China
- Languages at home
- 94% English-only · Other Indo-European 3% Spanish 1% Russian/Polish/Slavic 1%
Political lean MEDSL · Schoharie
- 2024 margin
- Solid R (+30.5) · D 34.7% · R 65.3%
- 2008→2024 swing
- -16.2pp toward R · 2008: -14.3pp · 2024: -30.5pp
- All cycles
- 2024: R+30.5 2020: R+29.0 2016: R+34.7 2012: R+16.6 2008: R+14.3
Not yet ingested
- Civics
- —
Market trends
- HPI YoY
- ▲ 5.21%
- Current HPI
- 368.4492
- Rent YoY
- —
- Metro
- —
- State GDP YoY
- ▲ 2.60%
- F500 in state
- 92
Industry mix (Fortune 500 HQ in NY)
| Industry | F500 HQs | Revenue |
|---|---|---|
| Financial Services | 10 | $950B |
|
||
| Consumer Goods | 9 | $162B |
|
||
| Insurance | 4 | $225B |
|
||
| Telecommunications | 2 | $144B |
|
||
| Pharmaceuticals | 2 | $112B |
|
||
| Media / Entertainment | 2 | $69B |
|
||
Price history
+1295.0% since first listed5 events — show timeline
- 2026-05-21 Listed $279,000 UNYREIS
- 2024-01-16 Listing Removed — UNYREIS
- 2023-08-08 Listing Removed — UNYREIS
- 2023-07-22 Listed $189,000 UNYREIS
- 1994-10-11 Sold (Public Records) $20,000 Public Records
Property tax history
+9.9%/yrLatest (2025): $4,689 · +3.0% YoY. Source: county tax records.
Cash-flow waterfall
monthlySold comps — $/sqft
last 12 mo · ≤1 miLoading sold comps…