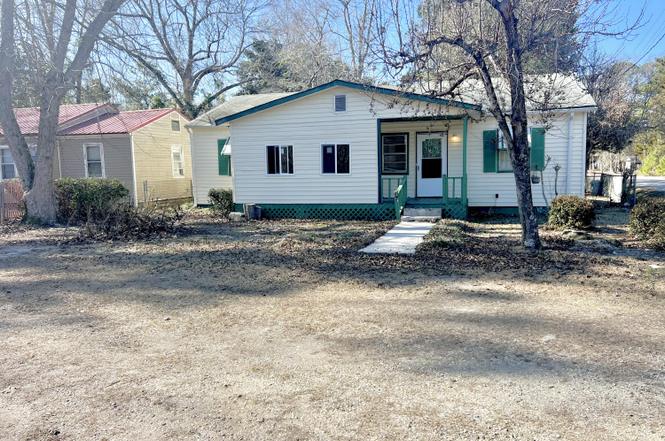
39 Tip Top Dr · Greeleyville, SC
Flood risk 1/10 · Minimal
- FEMA flood zone
- X (unshaded)
- Chance of flooding over 30 yrs
- 0.0%
- Est. flood insurance / yr
- $507 – $1,088
Fire risk 7/10 · Major
- Est. fire insurance / yr
- $783 – $1,453
Heat risk 7/10 · Major
- Hot days now (above 108°F)
- 7 days/yr
- Hot days in 30 yrs
- 16 days/yr
Wind risk 8/10 · Major
- Chance of severe wind over 30 yrs
- 80.0%
Air-quality risk 3/10 · Minor
- Unhealthy air days now
- 3 days/yr
- Unhealthy air days in 30 yrs
- 3 days/yr
Risk factors via First Street. Map © Google.
Why this score? — see what drove the D- grade
The composite is a weighted blend of 9 inputs, each scored 0–100. Each bar is that input's sub-score; the figure is the points it added to the 100-point composite (weight × sub-score).
- Cash flow +9.3/30.0
- Appreciation +7.8/10.0
- ARV discount +7.5/15.0
- Livability +3.2/5.0
- 1% rule +2.8/10.0
- DSCR +2.6/10.0
- Rent growth +2.5/5.0
- Condition / age +2.5/5.0
- Schools +1.5/10.0
$135,000
🖨 Deal sheet 📄 Offer letter ✓ Due diligence
Listing remarks
Charming and well-loved home offered with unique value and opportunity. Owned and cared for by the same owner since 1992, this 3-bedroom, 2-bath residence reflects decades of pride of ownership and warmth. While the home features original finishes, including classic wood paneling, it offers a solid canvas for buyers seeking character, nostalgia, or future updates. Enjoy the inviting sunroom/screened front porch—ideal for morning coffee or relaxing evenings. A stackable washer and dryer are conveniently located inside the home, and all furniture conveys, making this a truly turnkey opportunity. The property includes two separate lots: a generous 0.60-acre lot with a detached carport, p
Key facts
- Screened front porch
- Detached carport
- Two separate lots
Tags
Property features AI
Exterior
- Parking: Detached carport; 2 carport spaces
- Security: Smoke detector(s)
- Utilities: Public water; Public sewer; Electricity available; Natural gas available; Cable available
- Home design: Single-family residence; One level; Residential house
- Construction: Vinyl siding; Built with typical shingle roof
- Exterior features: Chain link fencing; Shed(s); Paved road access; Publicly maintained road; Has a view; Shingle roof
Interior
- Kitchen: Dishwasher; Oven; Range
- Flooring: Carpet; Laminate
- Bathrooms: 2 full bathrooms
- Heating & cooling: Natural gas heating; Other heating; Wall unit cooling
- Interior features: Blinds and window coverings; Smoke detector(s); Enclosed patio/porch; Crawl space basement
- Laundry & utility: Washer hookup; Electric dryer hookup
Neighborhood map
What this means for you Summary
Snapshot
- This is a 3-bed/2.0-bath single-family listed at $135k.
Deal economics
- At list price, monthly cash flow is $-98 ($-1k/yr) — negative.
- To cash-flow at today's rent, offer at most $121k (10.5% below list).
- To meet the 1% rule (rent ≥ 1% of price), the offer needs to be $106k (21.7% below list).
- Recommended offer: $106k (21.7% below list) — sets the bar for 1% rule.
Location & tenants
- Location reads 64/100 on livability (#149 in SC) — a middle-class / working-renter tenant base. Strengths: cost of living A+, health & safety A+, housing B+; Watch: crime F, amenities F, commute F.
- Williamsburg 01 (rural): math 13% / reading 26% proficiency, ranked #74 of 80 in SC (top 92%) — low school quality limits family demand, transient renter base, plan for 1-2y turnover; 88% free/reduced lunch — lower-income household profile, screen leases tightly.
- Zoned schools: Greeleyville Primary (math 8% / reading 22%, grade F, #549 of 597 statewide, top 92%, 140 students, 100% FRL); C. E. Murray Middle (math 2% / reading 22%, grade F, #216 of 229 statewide, top 96%, 131 students, 98% FRL); Kingstree High (720 students, 100% FRL).
- Market conditions: 13 active listings in the ZIP; 35 units permitted in Williamsburg County in 2024 (0 in 5+ unit buildings).
Forward outlook
- In year one you build about $9k of equity ($933 loan paydown + $8k appreciation (5.7% local appreciation)).
- Williamsburg County population projected at -32% by 2050 — secular population decline; favor cash flow + early exit over multi-decade hold.
- By year 5, paydown + projected appreciation supports a ~$37k cash-out refi (75% LTV) — recoverable capital for the next deal without selling this one.
Negotiation context
- It's been on market 145 days — a 12% lower offer ($119k) is reasonable based on typical stale-listing flexibility.
- 2 sale attempts with the ask held roughly flat each time — persistent listings suggest the price (not the market) is what's stuck; bring a comps-based counter.
Risks & watch-outs
- Climate carrying-cost: severe wind risk, 80% chance of damaging wind over 30y; major wildfire risk; extreme-heat days projected 7→16/yr by 2055 (HVAC capex compounding) — expect insurance premiums to compound above CPI over the hold.
Questions for the listing agent
- What do current leases actually rent for vs. the listed asking? Can we see a recent rent roll and the last 12 months of T-12 income?
- It's been on market 145 days. Have you received any prior offers? Is the seller open to a 22% concession, seller financing, or rate buy-down credit?
- Why hasn't it sold? Are there any deal-killer items the seller is aware of (foundation, flood, title, zoning, code violations)?
- Is there a deadline driving the sale (1031 exchange, divorce, estate, relocation)? That informs how much negotiation room exists.
- Crime grade is F in this area — have there been break-ins, vandalism, or insurance claims at this property in the last 3 years? What carrier currently insures it and at what premium?
- The area grade is low — what's the realistic commute time and amenity access for the typical tenant pool here? Any planned neighborhood developments (good or bad) we should know about?
- What's the average days-on-market for RENTAL listings here right now (not sales)? A rising rental-DOM trend means longer vacancies and softer asking-rent achievability than the comps imply.
- What's the recent tenant-quality profile in this submarket — average credit score on applications, eviction rate, late-payment / NSF rate, and stable-employment percentage? A property-management company in the area should have these aggregated.
- How much new for-sale + rental construction is in the pipeline within 1–3 miles? Heavy new supply typically softens prices + rents 12–24 months out; constrained supply supports both.
Investment metrics
- 1% rule
- 0.78% ✗
- Cap rate
- 5.42%
- Cash-on-cash
- -3.12%
- DSCR
- 0.86
- GRM
- 10.6
CMA / ARV
No comps found within radius.
Projected returns pro-forma
5.65% appreciation · 3.0% rent growth · sell at horizon
- IRR
- 11.9%
- Equity multiple
- 1.79×
- Total profit
- $29,921
- Equity at exit
- $81,870
- IRR
- 12.8%
- Equity multiple
- 3.48×
- Total profit
- $93,745
- Equity at exit
- $145,948
Cash invested: $37,800 (down + closing). Projections, not guarantees.
Landlord ↔ Tenant lean methodology
- Overall (STATE)
- 90 Strongly Landlord-Friendly
- State South Carolina
- 90 Strongly Landlord-Friendly · R+6
- County
- — inherits STATE
- City
- — inherits STATE
ZIP-level market 29056
- Home prices YoY
- 3.6%
- Active inventory
- 13
- Price-to-rent
- 10.6×
Monthly cashflow live
- Estimated rent
- $1,057 medium interval (Pro) →
- Mortgage (P&I)
- −$708
- Tax est. 1.5%
- −$169 /mo · $2,025/yr
- Insurance
- −$56
- HOA
- −$0
- Vacancy / Maint / Mgmt
- −$222
- Net cashflow
- $-98
Break-even live
UW: 25.0% down · 7.5% · 30yr · 1.5% tax · 5.0% vac · 8.0% maint · 8.0% mgmt
Financing live
Cash to close
- Down payment
- $33,750
- Closing costs
- $4,050
- Reserves months
- —
- Total cash needed
- —
Loan-product check · same deal, 3 products live
Conventional
25% down · 7.5% · 30yr
- Down + closing
- —
- Monthly P&I
- —
- Monthly cashflow
- —
- DSCR
- —
- Eligible?
- —
Personal DTI + credit; lowest rate.
DSCR
20% down · 8.5% · 30yr
- Down + closing
- —
- Monthly P&I
- —
- Monthly cashflow
- —
- DSCR
- —
- Eligible?
- —
No personal income docs; deal must DSCR.
Hard money
10% down · 12.0% · 12mo
- Down + closing
- —
- Monthly P&I
- —
- Monthly cashflow
- —
- DSCR
- —
- Eligible?
- —
Short-term bridge; refi at stabilization.
Listing history 18 events
-
2026-06-18days on market $135,000 Active 145 DOM
-
2026-06-17days on market $135,000 Active 144 DOM
-
2026-06-16days on market $135,000 Active 143 DOM
-
2026-06-15days on market $135,000 Active 142 DOM
-
2026-06-13days on market $135,000 Active 140 DOM
-
2026-06-12days on market $135,000 Active 139 DOM
-
2026-06-09days on market $135,000 Active 136 DOM
-
2026-06-08days on market $135,000 Active 135 DOM
-
2026-06-08days on market $135,000 Active 134 DOM
-
2026-06-07days on market $135,000 Active 133 DOM
-
2026-06-04days on market $135,000 Active 130 DOM
-
2026-06-02days on market $135,000 Active 129 DOM
-
2026-06-01days on market $135,000 Active 128 DOM
-
2026-05-31days on market $135,000 Active 127 DOM
-
2026-05-03status Active
-
2026-05-03price $135,000
-
2026-05-01historical
-
2026-01-20$140,000 Active
ⓘ Source: listings_history table (triggers on properties + properties_extension) + one-shot
backfill from property_details.listing_events for pre-trigger history.
Climate risk First Street
- Flood 1/10 Low FEMA zone X (unshaded) · 0% chance over 30 yrs
- Wildfire 7/10 Severe
- Heat 7/10 Severe 7 d/yr ≥108°F today · 16 d/yr by 30 yrs out
- Wind 8/10 Severe 80% chance of damaging wind over 30 yrs
- Air quality 3/10 Moderate 3 unhealthy d/yr today · 3 by 30 yrs out
Nearby sold comps map
Loading sold comps map…
Walkable amenities ~0.75 mi
Loading nearby amenities…
Taxation est. · year 1
- Rental income
- $12,679
- − Mortgage interest
- −$7,562
- − Property taxes
- −$2,025
- − Insurance
- −$675
- − Repairs & maintenance
- −$1,014
- − Management
- −$1,014
- − Depreciation
- −$3,927
- Taxable loss
- −$3,539
- Est. tax savings @ 24.0%
- +$849
- After-tax cash flow
- $-329/yr
For passive investors: Depreciation is non-cash, so a rental often shows a tax loss while cash-flowing — sheltering income. Rental losses are passive: they offset passive income freely, and up to $25,000/yr can offset ordinary (W-2) income if you actively participate and your MAGI is under $100k (phasing out to $0 by $150k); unused losses carry forward. On sale, claimed depreciation is recaptured at up to 25%, and gains may owe capital-gains tax (a 1031 exchange can defer both). Figures are a year-1 estimate at your 24.0% rate — not tax advice; consult a CPA.
Schools (NCES district)
- District
- Williamsburg 01
- NCES district ID
- 4503780
- Math proficiency
- 13% ▼ -11.00%
- Reading proficiency
- 26% ▼ -4.00%
- Median HH income
- $27,663
- Composite
- 15.32/100
- National rank
- #9328
- State rank
- #74 of 80 in SC
Livability — Greeleyville
- Score
- 64/100
- State rank
- #149
- US rank
- #14086
Category grades
Schools grade is shown separately in the Schools card above.
Census & demographics
- Population (ZIP)
- 2,288
Population outlook (Williamsburg County) Hauer SSP2
- Today (2025)
- 29,171 people
- By 2030
- 27,247 · -6.6%
- By 2040
- 23,314 · -20.1%
- By 2050
- 19,798 · -32.1%
- By 2075
- 13,336 · -54.3%
- By 2100
- 8,502 · -70.9%
Race, ethnicity, and origin ACS 2023
- Neighborhood character
- Predominantly Black (78%)
- Race & ethnicity
- Black 78% White 18% Two or more races 2% Hispanic / Latino 1%
- Common ancestry
- Serbian 1% Italian 1%
- Foreign-born
- 1% · Canada
- Languages at home
- 98% English-only · Spanish 2%
Political lean MEDSL · Williamsburg
- 2024 margin
- Strong D (+21.7) · D 60.2% · R 38.5% · Other 1.2%
- 2008→2024 swing
- -16.5pp toward R · 2008: 38.2pp · 2024: 21.7pp
- All cycles
- 2024: D+21.7 2020: D+29.8 2016: D+33.8 2012: D+39.9 2008: D+38.2
Not yet ingested
- Civics
- —
Market trends
- HPI YoY
- ▲ 5.65%
- Current HPI
- 161.2991
- Rent YoY
- —
- Metro
- —
- State GDP YoY
- ▲ 4.51%
- F500 in state
- 2
Industry mix (Fortune 500 HQ in SC)
| Industry | F500 HQs | Revenue |
|---|---|---|
| Packaging | 1 | $7B |
|
||
Price history
-3.6% since first listed4 events — show timeline
- 2026-05-03 Relisted — SBOR
- 2026-05-03 Price Changed $135,000 SBOR
- 2026-05-01 Delisted — SBOR
- 2026-01-20 Listed $140,000 SBOR
Property tax history
+0.0%/yrLatest (2025): $125 · +0.0% YoY. Source: county tax records.
Cash-flow waterfall
monthlySold comps — $/sqft
last 12 mo · ≤1 miLoading sold comps…