18711 Weeping Willow Ln · Pearland, TX
Flood risk No data
- FEMA flood zone
- —
- Chance of flooding over 30 yrs
- —
- Est. flood insurance / yr
- —
Fire risk No data
- Est. fire insurance / yr
- —
Heat risk No data
- Hot days now (above threshold)
- —
- Hot days in 30 yrs
- —
Wind risk No data
- Chance of severe wind over 30 yrs
- —
Air-quality risk No data
- Unhealthy air days now
- —
- Unhealthy air days in 30 yrs
- —
Risk factors via First Street. Map © Google.
Why this score? — see what drove the B grade
The composite is a weighted blend of 9 inputs, each scored 0–100. Each bar is that input's sub-score; the figure is the points it added to the 100-point composite (weight × sub-score).
- Cash flow +30.0/30.0
- 1% rule +10.0/10.0
- DSCR +10.0/10.0
- ARV discount +7.5/15.0
- Livability +4.0/5.0
- Schools +3.9/10.0
- Rent growth +2.9/5.0
- Condition / age +2.2/5.0
- Appreciation +0.0/10.0
$55,000
🖨 Deal sheet 📄 Offer letter ✓ Due diligence
Listing remarks
Beautiful mobile home for sale! Price not negotiable. Home is still being financed and that is what is owed to fully pay loan . I & acirc; & euro; & trade; m relocating, need to get off my hands. Once paid new owner can stay at the mobile lot or move it.
Key facts
- Built 2019
- Listed 17 days
Neighborhood map
What this means for you Summary
Snapshot
- This is a 3-bed/2.0-bath manufactured listed at $55k. Condition is rated fair.
Deal economics
- At list price, monthly cash flow is $1k ($14k/yr) — positive.
- The deal already cash-flows at list — no discount required.
- Meets the 1% rule at list price ($2k rent vs $55k).
- Recommended offer: $54k (1.5% below list) — sets the bar for market timing.
- Cap rate 31.6% vs local median 3.0% in Pearland — top-decile yield for the area; either an underpriced asset or a hidden risk that comps aren't pricing in. Stress-test before assuming the spread holds.
Location & tenants
- Location reads 81/100 on livability (#32 in TX, #1,539 nationally) — a professional / high-income tenant draw. Strengths: schools A+, employment A+, housing A+; Watch: amenities D-, commute F.
- Alvin ISD (suburban): math 39% / reading 48% proficiency, ranked #255 of 826 in TX (top 31%) — families likely to look elsewhere, expect single-tenant / working-renter base with shorter leases.
- Market conditions: Rents rising (+1.5%/yr); 497 active listings in the ZIP; high-income renter base; 3,960 units permitted in Brazoria County in 2024 (593 in 5+ unit buildings).
Forward outlook
- Local home prices are declining (-3.0%/yr); year-one equity from $380 of loan paydown is wiped out by about $2k of value loss. Plan a longer hold.
- Brazoria County population projected at +44% by 2050 — long-run rental-demand tailwind backs the buy-and-hold thesis.
- At projected returns (-3.0% appreciation + 1.5% rent growth), your $15k cash investment doubles in ~2 years — after that, you're playing with house money.
Negotiation context
- It's been on market 17 days — a 2% lower offer ($54k) is reasonable based on typical stale-listing flexibility.
Risks & watch-outs
- Watch-outs: property tax is 2.6% of price.
Questions for the listing agent
- Have any recent inspections been done? Can we get a copy of the seller's disclosures and any deferred-maintenance estimates?
- Property tax is high relative to price — has the assessment been appealed recently, and will the sale trigger a re-assessment?
- Is there a deadline driving the sale (1031 exchange, divorce, estate, relocation)? That informs how much negotiation room exists.
- Schools are A-rated — typically a magnet for longer-tenancy family renters. What's the average tenant stay here, and is there a school-zone premium baked into asking?
- What's the average days-on-market for RENTAL listings here right now (not sales)? A rising rental-DOM trend means longer vacancies and softer asking-rent achievability than the comps imply.
- What's the recent tenant-quality profile in this submarket — average credit score on applications, eviction rate, late-payment / NSF rate, and stable-employment percentage? A property-management company in the area should have these aggregated.
- How much new for-sale + rental construction is in the pipeline within 1–3 miles? Heavy new supply typically softens prices + rents 12–24 months out; constrained supply supports both.
Investment metrics
- 1% rule
- 3.66% ✓
- Cap rate
- 31.59%
- Cash-on-cash
- 90.36%
- DSCR
- 5.02
- GRM
- 2.3
CMA / ARV
No comps found within radius.
Projected returns pro-forma
-3.0% appreciation · 1.47% rent growth · sell at horizon
- IRR
- 89.3%
- Equity multiple
- 5.02×
- Total profit
- $61,956
- Equity at exit
- $8,201
- IRR
- 91.9%
- Equity multiple
- 9.91×
- Total profit
- $137,160
- Equity at exit
- $4,755
Cash invested: $15,400 (down + closing). Projections, not guarantees.
Landlord ↔ Tenant lean methodology
- Overall (STATE)
- 87 Strongly Landlord-Friendly
- State Texas
- 87 Strongly Landlord-Friendly · R+5
- County
- — inherits STATE
- City
- — inherits STATE
ZIP-level market 77584
- Home prices YoY
- -18.7%
- Rents YoY
- 1.5%
- Active inventory
- 497
- Price-to-rent
- 2.3×
Monthly cashflow live
- Estimated rent
- $2,013 medium interval (Pro) →
- Mortgage (P&I)
- −$288
- Tax from tax record
- −$119 /mo · $1,430/yr
- Insurance
- −$23
- HOA
- −$0
- Vacancy / Maint / Mgmt
- −$423
- Net cashflow
- $1,160
Break-even live
UW: 25.0% down · 7.5% · 30yr · 1.5% tax · 5.0% vac · 8.0% maint · 8.0% mgmt
Financing live
Cash to close
- Down payment
- $13,750
- Closing costs
- $1,650
- Reserves months
- —
- Total cash needed
- —
Loan-product check · same deal, 3 products live
Conventional
25% down · 7.5% · 30yr
- Down + closing
- —
- Monthly P&I
- —
- Monthly cashflow
- —
- DSCR
- —
- Eligible?
- —
Personal DTI + credit; lowest rate.
DSCR
20% down · 8.5% · 30yr
- Down + closing
- —
- Monthly P&I
- —
- Monthly cashflow
- —
- DSCR
- —
- Eligible?
- —
No personal income docs; deal must DSCR.
Hard money
10% down · 12.0% · 12mo
- Down + closing
- —
- Monthly P&I
- —
- Monthly cashflow
- —
- DSCR
- —
- Eligible?
- —
Short-term bridge; refi at stabilization.
Listing history 14 events
-
2026-06-17status $55,000 Under Contract 17 DOM
-
2026-06-16days on market $55,000 Active 17 DOM
-
2026-06-15days on market $55,000 Active 16 DOM
-
2026-06-13days on market $55,000 Active 14 DOM
-
2026-06-13days on market $55,000 Active 13 DOM
-
2026-06-09days on market $55,000 Active 10 DOM
-
2026-06-08days on market $55,000 Active 9 DOM
-
2026-06-07days on market $55,000 Active 8 DOM
-
2026-06-04days on market $55,000 Active 5 DOM
-
2026-06-03days on market $55,000 Active 4 DOM
-
2026-06-02days on market $55,000 Active 3 DOM
-
2026-06-01days on market $55,000 Active 2 DOM
-
2026-05-31remarks 254-char remark
-
2026-05-31$55,000 Active 1 DOM
ⓘ Source: listings_history table (triggers on properties + properties_extension) + one-shot
backfill from property_details.listing_events for pre-trigger history.
Tax reassessment forecast TX · Resets to sale price
- Current annual tax
- $1,430 · $119/mo
- Projected year-2 tax
- $1,430 · $119/mo
- Expected delta
- $0/yr ($0/mo · 0.0%)
ⓘ Screening estimate from a state-policy table — verify with the county assessor before closing.
Nearby sold comps map
Loading sold comps map…
Walkable amenities ~0.75 mi
Loading nearby amenities…
Taxation est. · year 1
- Rental income
- $24,155
- − Mortgage interest
- −$3,081
- − Property taxes
- −$1,430
- − Insurance
- −$275
- − Repairs & maintenance
- −$1,932
- − Management
- −$1,932
- − Depreciation
- −$1,600
- Taxable income
- $13,904
- Est. tax owed @ 24.0%
- −$3,337
- After-tax cash flow
- $10,579/yr
For passive investors: Depreciation is non-cash, so a rental often shows a tax loss while cash-flowing — sheltering income. Rental losses are passive: they offset passive income freely, and up to $25,000/yr can offset ordinary (W-2) income if you actively participate and your MAGI is under $100k (phasing out to $0 by $150k); unused losses carry forward. On sale, claimed depreciation is recaptured at up to 25%, and gains may owe capital-gains tax (a 1031 exchange can defer both). Figures are a year-1 estimate at your 24.0% rate — not tax advice; consult a CPA.
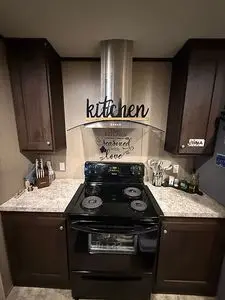
Condition & rehab AI · 1 photo
The home requires cosmetic updates to the kitchen, interior walls, and landscaping to improve its resale and rental value.
Repairs flagged
- Minor cabinetry — Cabinetry appears slightly worn but not damaged.
- Minor appliances — Appliances appear slightly dated but functional.
- Minor paint — Interior walls may benefit from fresh paint to improve appearance.
- Unknown HVAC — No photo of HVAC system provided.
- Unknown roof — No photo of roof provided.
- Unknown exterior — No photo of exterior provided.
- Unknown windows — No photo of windows provided.
- Unknown foundation/structure — No photo of foundation/structure provided.
- Unknown landscaping — No photo of landscaping provided.
Value-add opportunities
- Both Paint interior walls — Fresh paint can improve the home's appearance and value.
- Both Replace cabinetry and appliances — Updating the kitchen can significantly enhance the home's appeal and value.
- Both Landscaping and curb appeal — A well-maintained exterior can attract more buyers and renters.
- Both HVAC system inspection and maintenance — A functional HVAC system is essential for comfort and can improve the home's value.
- Both Roof inspection — A healthy roof is crucial for the home's longevity and value.
- Both Exterior siding inspection — Aesthetic improvements to the exterior can enhance the home's curb appeal and value.
- Both Windows inspection and replacement — New windows can improve energy efficiency and the home's curb appeal.
- Both Foundation inspection — A stable foundation is essential for the home's structural integrity and value.
- Both Landscaping and curb appeal — A well-maintained exterior can attract more buyers and renters.
Renovation cost estimate screening
| Repair item | Severity | Est. cost |
|---|---|---|
| cabinetry · Cabinetry appears slightly worn but not damaged. | Minor | $500–3,000 |
| appliances · Appliances appear slightly dated but functional. | Minor | $500–3,000 |
| paint · Interior walls may benefit from fresh paint to improve appearance. | Minor | $500–3,000 |
| HVAC · No photo of HVAC system provided. | Unknown | $500–3,000 |
| roof · No photo of roof provided. | Unknown | $500–3,000 |
| exterior · No photo of exterior provided. | Unknown | $500–3,000 |
| windows · No photo of windows provided. | Unknown | $500–3,000 |
| foundation/structure · No photo of foundation/structure provided. | Unknown | $500–3,000 |
| landscaping · No photo of landscaping provided. | Unknown | $500–3,000 |
| Total estimated repair cost · 9 items | $4,500–27,000 |
Value-add ROI direction
- Both Paint interior walls — Fresh paint can improve the home's appearance and value. ↑
- Both Replace cabinetry and appliances — Updating the kitchen can significantly enhance the home's appeal and value. ↑
- Both Landscaping and curb appeal — A well-maintained exterior can attract more buyers and renters. ↑
- Both HVAC system inspection and maintenance — A functional HVAC system is essential for comfort and can improve the home's value. ↑
- Both Roof inspection — A healthy roof is crucial for the home's longevity and value. ↑
- Both Exterior siding inspection — Aesthetic improvements to the exterior can enhance the home's curb appeal and value. ↑
- Both Windows inspection and replacement — New windows can improve energy efficiency and the home's curb appeal. ↑
- Both Foundation inspection — A stable foundation is essential for the home's structural integrity and value. ↑
- Both Landscaping and curb appeal — A well-maintained exterior can attract more buyers and renters. ↑
ⓘ Cost ranges are severity-bucket heuristics (US national rule-of-thumb). Get contractor quotes + a written scope before underwriting a rehab budget.
Schools (NCES district)
- District
- Alvin ISD
- NCES district ID
- 4808090
- Math proficiency
- 39% ▼ -11.00%
- Reading proficiency
- 48% ▬ 0.00%
- Median HH income
- $66,740
- Composite
- 38.96/100
- National rank
- #4080
- State rank
- #255 of 826 in TX
Livability — Pearland
- Score
- 81/100
- State rank
- #32
- US rank
- #1539
Category grades
Schools grade is shown separately in the Schools card above.
Census & demographics
- County
- Brazoria County · 374,982 people
- City population
- 142,397
- Metro
- Houston-The Woodlands-Sugar Land, TX
- Population (ZIP)
- 91,065
- Household income
- $121,872
- Rent vs Own
- Severe rent burden
- 1539.0
Population outlook (Brazoria County) Hauer SSP2
- Today (2025)
- 420,414 people
- By 2030
- 457,585 · +8.8%
- By 2040
- 532,232 · +26.6%
- By 2050
- 605,399 · +44.0%
- By 2075
- 779,358 · +85.4%
- By 2100
- 883,759 · +110.2%
Race, ethnicity, and origin ACS 2023
- Neighborhood character
- Highly diverse neighborhood (Simpson 0.76)
- Race & ethnicity
- White 32% Hispanic / Latino 22% Asian 21% Black 21% Two or more races 14%
- Hispanic origin (detail)
- Mexican 16% Puerto Rican 2%
- Common ancestry
- Lithuanian 2% Romanian 1% Slovak 1%
- Foreign-born
- 25% · Canada, China, Vietnam
- Languages at home
- 64% English-only · Spanish 14% Chinese 4% Other Indo-European 4%
Political lean MEDSL · Brazoria
- 2024 margin
- R (+19.7) · D 39.5% · R 59.2% · Other 1.3%
- 2008→2024 swing
- +9.9pp toward D · 2008: -29.6pp · 2024: -19.7pp
- All cycles
- 2024: R+19.7 2020: R+18.2 2016: R+24.6 2012: R+34.2 2008: R+29.6
Not yet ingested
- Civics
- —
Market trends
- HPI YoY
- ▼ -49.09%
- Current HPI
- 213.4011
- Rent YoY
- ▲ 1.47%
- Metro
- Houston-The Woodlands-Sugar Land, TX
- State GDP YoY
- ▲ 3.95%
- F500 in state
- 110
Industry mix (Fortune 500 HQ in TX)
| Industry | F500 HQs | Revenue |
|---|---|---|
| Energy | 16 | $1,198B |
|
||
| Technology | 5 | $198B |
|
||
| Engineering / Construction | 4 | $72B |
|
||
| Energy Services | 3 | $60B |
|
||
| Utilities | 3 | $41B |
|
||
| Healthcare | 2 | $330B |
|
||
Price history
1 event — show timeline
- 2026-05-31 Listed $55,000 FSBO.com
Property tax history
+7.2%/yrLatest (2025): $1,430 · -2.0% YoY. Source: county tax records.
Cash-flow waterfall
monthlySold comps — $/sqft
last 12 mo · ≤1 miLoading sold comps…