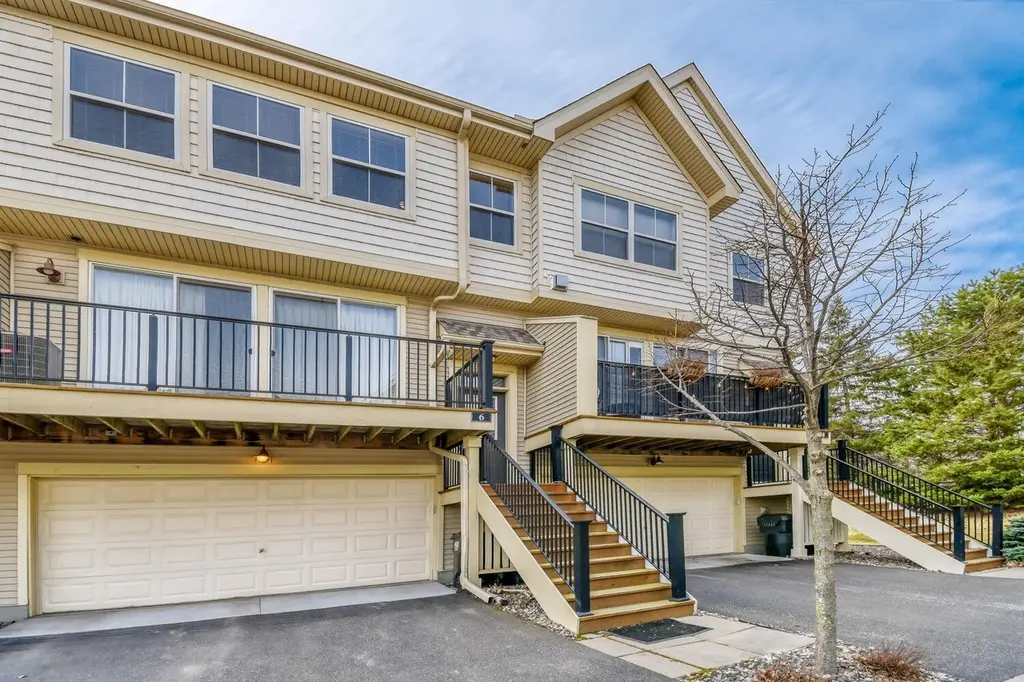
4615 Victor Path #6 · Hugo, MN
Flood risk No data
- FEMA flood zone
- —
- Chance of flooding over 30 yrs
- —
- Est. flood insurance / yr
- —
Fire risk No data
- Est. fire insurance / yr
- —
Heat risk No data
- Hot days now (above threshold)
- —
- Hot days in 30 yrs
- —
Wind risk No data
- Chance of severe wind over 30 yrs
- —
Air-quality risk No data
- Unhealthy air days now
- —
- Unhealthy air days in 30 yrs
- —
Risk factors via First Street. Map © Google.
Why this score? — see what drove the D grade
The composite is a weighted blend of 9 inputs, each scored 0–100. Each bar is that input's sub-score; the figure is the points it added to the 100-point composite (weight × sub-score).
- ARV discount +15.0/15.0
- Cash flow +7.9/30.0
- Schools +4.6/10.0
- 1% rule +4.4/10.0
- Livability +3.6/5.0
- Rent growth +2.5/5.0
- Condition / age +2.5/5.0
- DSCR +2.0/10.0
- Appreciation +0.0/10.0
$239,900
🖨 Deal sheet (PDF) 📄 Offer letter ✓ Due diligence
Listing remarks MLS
This is a nice ready move in condo with 2 bed, 3bath, an office and a loft with 2 car garage tuck under and nice deck.
Key facts
- $450 HOA
- 2 garage spots
- Pool
Neighborhood map
What this means for you Summary
Snapshot
- This is a 2-bed/2.5-bath condo listed at $240k.
Deal economics
- At list price, monthly cash flow is $-258 ($-3k/yr) — negative.
- To cash-flow at today's rent, offer at most $194k (19.0% below list).
- To meet the 1% rule (rent ≥ 1% of price), the offer needs to be $226k (5.9% below list).
- Recommended offer: $194k (19.0% below list) — sets the bar for cash-flow.
- Cap rate 5.0% vs local median 3.1% in Hugo — top-decile yield for the area; either an underpriced asset or a hidden risk that comps aren't pricing in. Stress-test before assuming the spread holds.
Location & tenants
- Location reads 71/100 on livability (#314 in MN) — a middle-class / working-renter tenant base. Strengths: employment A+, housing A+, crime A-; Watch: amenities F, commute F, health & safety F.
- White Bear Lake School District (suburban): math 45% / reading 57% proficiency, ranked #83 of 301 in MN (top 28%) — acceptable for families but not a draw, mixed tenant base, ~2y average lease.
- Zoned schools: Matoska International (math 45% / reading 54%, grade D, #423 of 857 statewide, top 55%, 554 students, 24% FRL); Central Middle (math 41% / reading 55%, grade C-, #90 of 258 statewide, top 35%, 1,020 students, 24% FRL); White Bear South Campus Senior (math 37%, 1,111 students, 26% FRL) — zoned schools at 25% FRL track the district average.
- Market conditions: 278 active listings in the ZIP; 1 comparable units currently listed for rent nearby; high-income renter base; 1,405 units permitted in Washington County in 2024 (121 in 5+ unit buildings).
Forward outlook
- Local home prices are declining (-3.0%/yr); year-one equity from $2k of loan paydown is wiped out by about $7k of value loss. Plan a longer hold.
- Washington County population projected at +16% by 2050 — long-run rental-demand tailwind backs the buy-and-hold thesis.
Negotiation context
- It's been on market 72 days — a 6% lower offer ($226k) is reasonable based on typical stale-listing flexibility.
- 5 sale attempts since 16y ago; this cycle's ask has dropped $30k (11%) from the opening price — seller is motivated, your offer sets the floor, not the list.
- Current owner paid $149k; list at $240k implies a 61% gain — meaningful room to come down on a strong offer.
Questions for the listing agent
- What do current leases actually rent for vs. the listed asking? Can we see a recent rent roll and the last 12 months of T-12 income?
- It's been on market 72 days. Have you received any prior offers? Is the seller open to a 19% concession, seller financing, or rate buy-down credit?
- What does the HOA fee cover, when was the last increase, and are there any pending special assessments or reserve-fund shortfalls?
- Any open or pending special assessments — roof, HVAC, plumbing, elevator, façade? What's the per-unit balance and payoff schedule, and is the seller paying it off at close or rolling it to the buyer?
- Why hasn't it sold? Are there any deal-killer items the seller is aware of (foundation, flood, title, zoning, code violations)?
- Is there a deadline driving the sale (1031 exchange, divorce, estate, relocation)? That informs how much negotiation room exists.
- Schools are A-rated — typically a magnet for longer-tenancy family renters. What's the average tenant stay here, and is there a school-zone premium baked into asking?
- The area grade is low — what's the realistic commute time and amenity access for the typical tenant pool here? Any planned neighborhood developments (good or bad) we should know about?
- What's the average days-on-market for RENTAL listings here right now (not sales)? A rising rental-DOM trend means longer vacancies and softer asking-rent achievability than the comps imply.
- What's the recent tenant-quality profile in this submarket — average credit score on applications, eviction rate, late-payment / NSF rate, and stable-employment percentage? A property-management company in the area should have these aggregated.
- How much new apartment / multifamily construction is in the pipeline within 1–3 miles? Heavy new supply (>2% of stock underway) typically softens rents 12–24 months out; light construction supports rent growth.
Investment metrics
- 1% rule
- 0.94% ✗
- Cap rate
- 5.00%
- Cash-on-cash
- -4.60%
- DSCR
- 0.80
- GRM
- 8.9
CMA / ARV
- ARV (median comp)
- $364,300
- List price
- $239,900
- Delta
- -34.15%
- Verdict
- UNDERPRICED
- Comps
- 2 within 1.0 mi
Projected returns pro-forma
-3.0% appreciation · 3.0% rent growth · sell at horizon
- IRR
- -23.9%
- Equity multiple
- 0.18×
- Total profit
- $-55,017
- Equity at exit
- $35,770
- IRR
- -18.7%
- Equity multiple
- -0.01×
- Total profit
- $-67,946
- Equity at exit
- $20,742
Cash invested: $67,172 (down + closing). Projections, not guarantees.
Landlord ↔ Tenant lean methodology
- Overall (STATE)
- 46 Balanced
- State Minnesota
- 46 Balanced · D+2
- County
- — inherits STATE
- City
- — inherits STATE
ZIP-level market 55038
- Home prices YoY
- -31.6%
- Active inventory
- 278
- Price-to-rent
- 8.9×
Monthly cashflow live
- Estimated rent
- $2,258 medium interval (Pro) →
- Mortgage (P&I)
- −$1,258
- Tax from tax record
- −$234 /mo · $2,806/yr
- Insurance
- −$100
- HOA
- −$450
- Vacancy / Maint / Mgmt
- −$474
- Net cashflow
- $-258
Break-even live
Sensitivity live
| Price | -10% $-122 | -5% $-190 | +0% $-258 | +5% $-326 | +10% $-394 |
|---|---|---|---|---|---|
| Rent | -10% $-436 | -5% $-347 | +0% $-258 | +5% $-168 | +10% $-79 |
| Rate | -1.0pp $-137 | -0.5pp $-197 | base $-258 | +0.5pp $-320 | +1.0pp $-383 |
UW: 25.0% down · 7.5% · 30yr · 1.5% tax · 5.0% vac · 8.0% maint · 8.0% mgmt
Financing live
Cash to close
- Down payment
- $59,975
- Closing costs
- $7,197
- Reserves months
- —
- Total cash needed
- —
Loan-product check · same deal, 3 products live
Conventional
25% down · 7.5% · 30yr
- Down + closing
- —
- Monthly P&I
- —
- Monthly cashflow
- —
- DSCR
- —
- Eligible?
- —
Personal DTI + credit; lowest rate.
DSCR
20% down · 8.5% · 30yr
- Down + closing
- —
- Monthly P&I
- —
- Monthly cashflow
- —
- DSCR
- —
- Eligible?
- —
No personal income docs; deal must DSCR.
Hard money
10% down · 12.0% · 12mo
- Down + closing
- —
- Monthly P&I
- —
- Monthly cashflow
- —
- DSCR
- —
- Eligible?
- —
Short-term bridge; refi at stabilization.
Rent comps 1 comps
| Address | Beds | Baths | Sqft | Rent | $/sqft | DOM | Units | Dist |
|---|---|---|---|---|---|---|---|---|
| 4631 Rosemary Way Hugo, MN | 3.0 | 1.0–2.0 | 963 | $2,330 | $2.42 | 0d | 1 | 0.25mi |
HOA detail condo
- Monthly dues
- $450 · $5,400/yr
- Assessments
- None detected in remarks — confirm with the listing agent.
Listing history 31 events
-
2026-06-21days on market $239,900 Active 72 DOM
-
2026-06-18days on market $239,900 Active 69 DOM
-
2026-06-17days on market $239,900 Active 68 DOM
-
2026-06-16days on market $239,900 Active 67 DOM
-
2026-06-15days on market $239,900 Active 66 DOM
-
2026-06-13days on market $239,900 Active 64 DOM
-
2026-06-13days on market $239,900 Active 63 DOM
-
2026-06-09days on market $239,900 Active 60 DOM
-
2026-06-08days on market $239,900 Active 59 DOM
-
2026-06-07days on market $239,900 Active 58 DOM
-
2026-06-04pricedays on market $239,900 Active 55 DOM
-
2026-06-03days on market $259,900 Active 54 DOM
-
2026-06-02days on market $259,900 Active 53 DOM
-
2026-06-01days on market $259,900 Active 52 DOM
-
2026-05-31days on market $259,900 Active 51 DOM
-
2026-05-14price $259,900 119-char remark
Show marketing remark (119 chars)
This is a nice ready move in condo with 2 bed, 3bath, an office and a loft with 2 car garage tuck under and nice deck.
-
2026-04-09$269,900 Active 119-char remark
Show marketing remark (119 chars)
This is a nice ready move in condo with 2 bed, 3bath, an office and a loft with 2 car garage tuck under and nice deck.
-
2024-05-14historical
-
2024-02-29price $274,900
-
2024-02-29$269,900 Active
-
2016-11-01historical
-
2016-10-02price $169,900
-
2016-09-15$174,900 Active
-
2015-09-04soldstatus $149,000 Sold
-
2015-09-04soldstatus $149,000
-
2015-07-07status Pending
-
2015-06-12price $149,900
-
2015-06-04$157,900 Active
-
2010-08-03soldstatus $139,900
-
2010-06-12historical
-
2010-04-14$139,900
ⓘ Source: listings_history table (triggers on properties + properties_extension) + one-shot
backfill from property_details.listing_events for pre-trigger history.
Tax reassessment forecast MN · Partial reset (capped growth)
- Current annual tax
- $2,806 · $234/mo
- Projected year-2 tax
- $2,806 · $234/mo
- Expected delta
- $0/yr ($0/mo · 0.0%)
ⓘ Screening estimate from a state-policy table — verify with the county assessor before closing.
Nearby sold comps map
Loading sold comps map…
Walkable amenities ~0.75 mi
Loading nearby amenities…
Taxation est. · year 1
- Rental income
- $27,101
- − Mortgage interest
- −$13,438
- − Property taxes
- −$2,806
- − Insurance
- −$1,200
- − Repairs & maintenance
- −$2,168
- − Management
- −$2,168
- − HOA
- −$5,400
- − Depreciation
- −$6,979
- Taxable loss
- −$7,058
- Est. tax savings @ 24.0%
- +$1,694
- After-tax cash flow
- $-1,399/yr
For passive investors: Depreciation is non-cash, so a rental often shows a tax loss while cash-flowing — sheltering income. Rental losses are passive: they offset passive income freely, and up to $25,000/yr can offset ordinary (W-2) income if you actively participate and your MAGI is under $100k (phasing out to $0 by $150k); unused losses carry forward. On sale, claimed depreciation is recaptured at up to 25%, and gains may owe capital-gains tax (a 1031 exchange can defer both). Figures are a year-1 estimate at your 24.0% rate — not tax advice; consult a CPA.
Schools (NCES district)
- District
- White Bear Lake School District
- NCES district ID
- 2742360
- Math proficiency
- 45% ▼ -18.00%
- Reading proficiency
- 57% ▼ -8.00%
- Median HH income
- $73,051
- Composite
- 45.78/100
- National rank
- #2564
- State rank
- #83 of 301 in MN
Livability — Hugo
- Score
- 71/100
- State rank
- #314
- US rank
- #7032
Category grades
Schools grade is shown separately in the Schools card above.
Census & demographics
- Census place
- Hugo, MN
- County
- Washington County · 235,613 people
- City population
- 25,061
- Metro
- Minneapolis-St. Paul-Bloomington, MN-WI
- Population (ZIP)
- 25,061
- Household income
- $130,931
- Rent vs Own
- Severe rent burden
- 222.0
Population outlook (Washington County) Hauer SSP2
- Today (2025)
- 278,554 people
- By 2030
- 290,465 · +4.3%
- By 2040
- 310,014 · +11.3%
- By 2050
- 324,118 · +16.4%
- By 2075
- 362,697 · +30.2%
- By 2100
- 381,491 · +37.0%
Race, ethnicity, and origin ACS 2023
- Neighborhood character
- Predominantly White (87%)
- Race & ethnicity
- White 87% Asian 4% Two or more races 4% Hispanic / Latino 3% Black 3%
- Common ancestry
- Portuguese 14% Lithuanian 7% Romanian 4%
- Foreign-born
- 3% · Canada
- Languages at home
- 95% English-only · Other Asian/Pacific 2% Spanish 1%
Political lean MEDSL · Washington
- 2024 margin
- Lean D (+8.9) · D 53.5% · R 44.6% · Other 1.9%
- 2008→2024 swing
- +4.6pp toward D · 2008: 4.3pp · 2024: 8.9pp
- All cycles
- 2024: D+8.9 2020: D+9.2 2016: D+1.9 2012: D+0.8 2008: D+4.3
Not yet ingested
- Civics
- —
Market trends
- HPI YoY
- ▼ -103.33%
- Current HPI
- 223.6524
- Rent YoY
- —
- Metro
- Minneapolis-St. Paul-Bloomington, MN-WI
- State GDP YoY
- ▲ 2.41%
- F500 in state
- 34
Industry mix (Fortune 500 HQ in MN)
| Industry | F500 HQs | Revenue |
|---|---|---|
| Healthcare | 2 | $407B |
|
||
| Retail | 2 | $150B |
|
||
| Consumer Goods | 2 | $32B |
|
||
| Industrial Machinery | 2 | $6B |
|
||
| Agriculture | 1 | $40B |
|
||
| Healthcare / Medical Devices | 1 | $32B |
|
||
Price history
+85.8% since first listed16 events — show timeline
- 2026-05-14 Price Changed $259,900 NORTHSTARMLS as Distributed by MLS Grid
- 2026-04-09 Listed $269,900 NORTHSTARMLS as Distributed by MLS Grid
- 2024-05-14 Listing Removed — NORTHSTARMLS as Distributed by MLS Grid
- 2024-02-29 Price Changed $274,900 NORTHSTARMLS as Distributed by MLS Grid
- 2024-02-29 Listed $269,900 NORTHSTARMLS as Distributed by MLS Grid
- 2016-11-01 Listing Removed — NORTHSTARMLS as Distributed by MLS Grid
- 2016-10-02 Price Changed $169,900 NORTHSTARMLS as Distributed by MLS Grid
- 2016-09-15 Listed $174,900 NORTHSTARMLS as Distributed by MLS Grid
- 2015-09-04 Sold (Public Records) $149,000 Public Records
- 2015-09-04 Sold (MLS) $149,000 NORTHSTARMLS as Distributed by MLS Grid
- 2015-07-07 Pending — NORTHSTARMLS as Distributed by MLS Grid
- 2015-06-12 Price Changed $149,900 NORTHSTARMLS as Distributed by MLS Grid
- 2015-06-04 Listed $157,900 NORTHSTARMLS as Distributed by MLS Grid
- 2010-08-03 Sold (MLS) $139,900 NORTHSTARMLS as Distributed by MLS Grid
- 2010-06-12 Listing Removed — NORTHSTARMLS as Distributed by MLS Grid
- 2010-04-14 Listed $139,900 NORTHSTARMLS as Distributed by MLS Grid
Property tax history
+5.1%/yrLatest (2025): $2,806 · -7.9% YoY. Source: county tax records.
Cash-flow waterfall
monthlySold comps — $/sqft
last 12 mo · ≤1 miLoading sold comps…