 🌊 Lakefront
29197 Surf Ave · Lincoln, MO
Flood risk 9/10 · Severe
- FEMA flood zone
- X (unshaded)
- Chance of flooding over 30 yrs
- 0.99%
- Est. flood insurance / yr
- $473 – $860
Fire risk 2/10 · Minimal
- Est. fire insurance / yr
- $1,054 – $1,958
Heat risk 4/10 · Minor
- Hot days now (above 107°F)
- 7 days/yr
- Hot days in 30 yrs
- 18 days/yr
Wind risk 2/10 · Minimal
- Chance of severe wind over 30 yrs
- 1.0%
Air-quality risk 1/10 · Minimal
- Unhealthy air days now
- 0 days/yr
- Unhealthy air days in 30 yrs
- 0 days/yr
Risk factors via First Street. Map © Google.
Why this score? — see what drove the D grade
The composite is a weighted blend of 9 inputs, each scored 0–100. Each bar is that input's sub-score; the figure is the points it added to the 100-point composite (weight × sub-score).
- ARV discount +15.0/15.0
- Appreciation +8.3/10.0
- Cash flow +5.6/30.0
- Schools +4.1/10.0
- Livability +3.4/5.0
- Rent growth +2.5/5.0
- Condition / age +2.5/5.0
- 1% rule +0.0/10.0
- DSCR +0.0/10.0
$235,000
🖨 Deal sheet 📄 Offer letter ✓ Due diligence
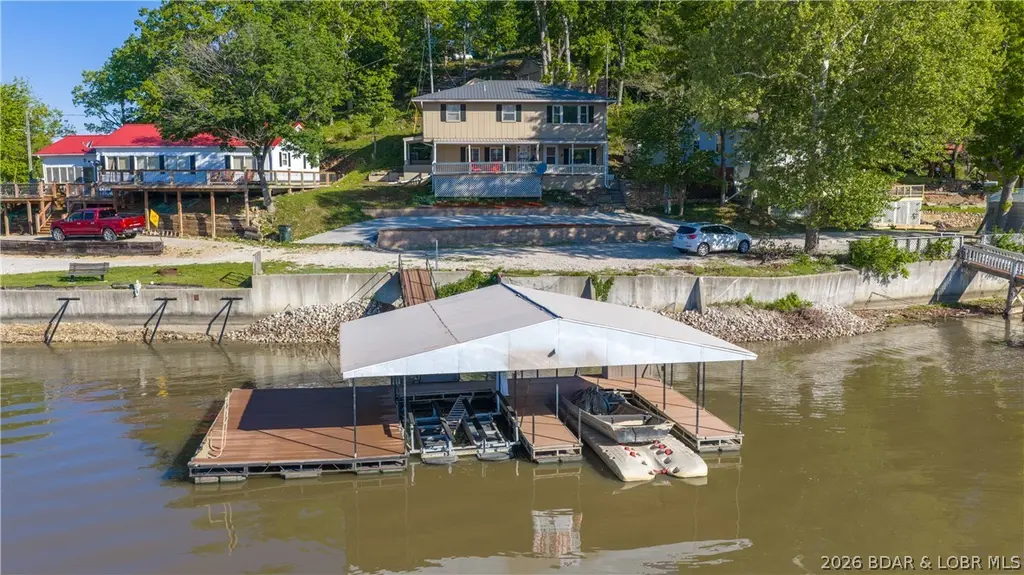
Listing remarks
This Lake of the Ozarks lakefront home at the 72MM, property offers the best of both worlds big water views without the heavy boat traffic. Has an ideal setting for those who want to enjoy the energy of the lake while still appreciating peace, privacy, and a more relaxed pace. Perfect for lake lovers, fishing enthusiasts, and anyone drawn to outdoor living, this property invites you to spend your days exploring, boating to nearby waterfront destinations, or simply enjoying the endless opportunities for adventure right from your dock. The two-slip dock is designed for convenience and fun, with a swim-friendly setup that makes cooling off easy. Set on two lots in a more rural, private setting
Key facts
- Move-in ready
- Two-slip dock
- Swim-friendly setup
Tags
Property features AI
Exterior
- Parking: Detached garage with workshop (2 garage spaces); Open parking and parking pad; Gravel driveway/parking
- Utilities: Private well water; Septic tank sewer
- Home design: Single-family detached home; Two-story; Fixer condition; Waterfront property with lake and beach access; lakefront; Sloped lot; Subdivision: Sagrada Beach
- Construction: Metal roof; Block foundation; Built with conventional construction (detached single-family)
- Exterior features: Deck; Porch; Patio; Storage; Workshop; Shed(s); Seawall
Interior
- Kitchen: Cooktop; Oven; Microwave; Dishwasher; Garbage disposal; Refrigerator
- Bathrooms: 2 full bathrooms; Accessible full bath
- Heating & cooling: Central air; Ceiling fans for cooling; Forced air heating; Electric heating; Propane heating; Wood-burning fireplace (1)
- Interior features: Ceiling fans; Window coverings and treatments; Storm windows; Built-in storage
- Laundry & utility: Washer; Dryer
Neighborhood map
What this means for you Summary
Snapshot
- This is a 3-bed/2.0-bath other listed at $235k.
Deal economics
- At list price, monthly cash flow is $-551 ($-7k/yr) — negative.
- To cash-flow at today's rent, offer at most $138k (41.4% below list).
- To meet the 1% rule (rent ≥ 1% of price), the offer needs to be $116k (50.5% below list).
- Recommended offer: $116k (50.5% below list) — sets the bar for 1% rule.
Location & tenants
- Location reads 68/100 on livability (#168 in MO) — a middle-class / working-renter tenant base. Strengths: cost of living A+, housing A+, health & safety A+; Watch: schools D, amenities F, commute F.
- Cole Camp R-I (rural): math 49% / reading 49% proficiency, ranked #61 of 324 in MO (top 19%) — families likely to look elsewhere, expect single-tenant / working-renter base with shorter leases.
- Market conditions: 61 active listings in the ZIP; 9 units permitted in Benton County in 2024 (0 in 5+ unit buildings).
Forward outlook
- In year one you build about $17k of equity ($2k loan paydown + $15k appreciation (6.5% local appreciation)).
- Benton County population projected at -21% by 2050 — secular population decline; favor cash flow + early exit over multi-decade hold.
- By year 3, paydown + projected appreciation supports a ~$42k cash-out refi (75% LTV) — recoverable capital for the next deal without selling this one.
Negotiation context
- It's been on market 17 days — a 2% lower offer ($231k) is reasonable based on typical stale-listing flexibility.
Risks & watch-outs
- Watch-outs: flood insurance adds $56/mo; built in 1958 — expect roof / HVAC / electrical / plumbing capex.
- Climate carrying-cost: severe flood risk — expect insurance premiums to compound above CPI over the hold.
Questions for the listing agent
- What do current leases actually rent for vs. the listed asking? Can we see a recent rent roll and the last 12 months of T-12 income?
- Built in 1958 — when were the roof, HVAC, electrical panel, plumbing, and water heater last replaced?
- What's the actual annual flood-insurance premium (NFIP or private), and is the property in a SFHA with mandatory coverage?
- Is there a deadline driving the sale (1031 exchange, divorce, estate, relocation)? That informs how much negotiation room exists.
- Schools are D-rated, which usually means shorter tenancies and higher turnover. Who's the typical renter profile here, and what's been the actual vacancy rate?
- The area grade is low — what's the realistic commute time and amenity access for the typical tenant pool here? Any planned neighborhood developments (good or bad) we should know about?
- This sits on a lake — are riparian / water-frontage rights deeded with the parcel? Any dock permits, shoreline easements, or HOA water-use restrictions?
- What's the documented flood / surge / shoreline-erosion history here (FEMA AND non-FEMA — e.g., storm surge, creek backup, septic-field saturation)?
- Any water-quality or seasonal algae-bloom issues that affect tenant satisfaction or short-term-rental demand?
- What's the average days-on-market for RENTAL listings here right now (not sales)? A rising rental-DOM trend means longer vacancies and softer asking-rent achievability than the comps imply.
- What's the recent tenant-quality profile in this submarket — average credit score on applications, eviction rate, late-payment / NSF rate, and stable-employment percentage? A property-management company in the area should have these aggregated.
- How much new for-sale + rental construction is in the pipeline within 1–3 miles? Heavy new supply typically softens prices + rents 12–24 months out; constrained supply supports both.
Investment metrics
- 1% rule
- 0.49% ✗
- Cap rate
- 3.76%
- Cash-on-cash
- -9.03%
- DSCR
- 0.60
- GRM
- 16.8
CMA / ARV
- ARV (median comp)
- $386,127
- List price
- $235,000
- Delta
- -39.14%
- Verdict
- UNDERPRICED
- Comps
- 2 within 2.0 mi
Projected returns pro-forma
6.5% appreciation · 3.0% rent growth · sell at horizon
- IRR
- 8.6%
- Equity multiple
- 1.60×
- Total profit
- $39,738
- Equity at exit
- $155,225
- IRR
- 10.1%
- Equity multiple
- 3.17×
- Total profit
- $142,551
- Equity at exit
- $288,201
Cash invested: $65,800 (down + closing). Projections, not guarantees.
Landlord ↔ Tenant lean methodology
- Overall (STATE)
- 81 Strongly Landlord-Friendly
- State Missouri
- 81 Strongly Landlord-Friendly · R+10
- County
- — inherits STATE
- City
- — inherits STATE
ZIP-level market 65338
- Home prices YoY
- 2.8%
- Active inventory
- 61
- Price-to-rent
- 16.8×
Monthly cashflow live
- Estimated rent
- $1,162 medium interval (Pro) →
- Mortgage (P&I)
- −$1,232
- Tax from tax record
- −$83 /mo · $1,000/yr
- Insurance
- −$98
- Flood insurance flood zone
- −$56 /mo · $666/yr
- HOA
- −$0
- Vacancy / Maint / Mgmt
- −$244
- Net cashflow
- $-551
Break-even live
UW: 25.0% down · 7.5% · 30yr · 1.5% tax · 5.0% vac · 8.0% maint · 8.0% mgmt
Financing live
Cash to close
- Down payment
- $58,750
- Closing costs
- $7,050
- Reserves months
- —
- Total cash needed
- —
Loan-product check · same deal, 3 products live
Conventional
25% down · 7.5% · 30yr
- Down + closing
- —
- Monthly P&I
- —
- Monthly cashflow
- —
- DSCR
- —
- Eligible?
- —
Personal DTI + credit; lowest rate.
DSCR
20% down · 8.5% · 30yr
- Down + closing
- —
- Monthly P&I
- —
- Monthly cashflow
- —
- DSCR
- —
- Eligible?
- —
No personal income docs; deal must DSCR.
Hard money
10% down · 12.0% · 12mo
- Down + closing
- —
- Monthly P&I
- —
- Monthly cashflow
- —
- DSCR
- —
- Eligible?
- —
Short-term bridge; refi at stabilization.
Listing history 3 events
-
2026-05-11historical Active Under Contract 1203-char remark
-
2026-05-01$235,000 Active 1203-char remark
-
1991-09-01soldstatus
ⓘ Source: listings_history table (triggers on properties + properties_extension) + one-shot
backfill from property_details.listing_events for pre-trigger history.
Tax reassessment forecast MO · Resets to sale price
- Current annual tax
- $1,000 · $83/mo
- Projected year-2 tax
- $2,280 · $190/mo
- Expected delta
- +$1,280/yr (+$107/mo · 128.0%)
ⓘ Screening estimate from a state-policy table — verify with the county assessor before closing.
Climate risk First Street
- Flood 9/10 Extreme FEMA zone X (unshaded) · 99% chance over 30 yrs
- Wildfire 2/10 Low
- Heat 4/10 Moderate 7 d/yr ≥107°F today · 18 d/yr by 30 yrs out
- Wind 2/10 Low 100% chance of damaging wind over 30 yrs
- Air quality 1/10 Low 0 unhealthy d/yr today · 0 by 30 yrs out
Nearby sold comps map
Loading sold comps map…
Walkable amenities ~0.75 mi
Loading nearby amenities…
Taxation est. · year 1
- Rental income
- $13,950
- − Mortgage interest
- −$13,164
- − Property taxes
- −$1,000
- − Insurance
- −$1,842
- − Repairs & maintenance
- −$1,116
- − Management
- −$1,116
- − Depreciation
- −$6,836
- Taxable loss
- −$11,123
- Est. tax savings @ 24.0%
- +$2,670
- After-tax cash flow
- $-3,940/yr
For passive investors: Depreciation is non-cash, so a rental often shows a tax loss while cash-flowing — sheltering income. Rental losses are passive: they offset passive income freely, and up to $25,000/yr can offset ordinary (W-2) income if you actively participate and your MAGI is under $100k (phasing out to $0 by $150k); unused losses carry forward. On sale, claimed depreciation is recaptured at up to 25%, and gains may owe capital-gains tax (a 1031 exchange can defer both). Figures are a year-1 estimate at your 24.0% rate — not tax advice; consult a CPA.
Schools (NCES district)
- District
- Cole Camp R-I
- NCES district ID
- 2909900
- Math proficiency
- 49% ▼ -10.00%
- Reading proficiency
- 49% ▼ -5.00%
- Median HH income
- $37,598
- Composite
- 40.78/100
- National rank
- #3641
- State rank
- #61 of 324 in MO
Livability — Lincoln
- Score
- 68/100
- State rank
- #168
- US rank
- #9077
Category grades
Schools grade is shown separately in the Schools card above.
Census & demographics
- Population (ZIP)
- 3,403
Population outlook (Benton County) Hauer SSP2
- Today (2025)
- 17,355 people
- By 2030
- 16,513 · -4.9%
- By 2040
- 14,898 · -14.2%
- By 2050
- 13,662 · -21.3%
- By 2075
- 11,308 · -34.8%
- By 2100
- 8,755 · -49.6%
Race, ethnicity, and origin ACS 2023
- Neighborhood character
- Predominantly White (90%)
- Race & ethnicity
- White 90% Two or more races 3% Black 3% Hispanic / Latino 2%
- Common ancestry
- Serbian 3% Lithuanian 1% Italian 1%
- Foreign-born
- 1% · Canada, Jamaica
- Languages at home
- 96% English-only · German/W. Germanic 2% Spanish 1%
Political lean MEDSL · Benton
- 2024 margin
- Solid R (+59.1) · D 20.1% · R 79.2%
- 2008→2024 swing
- -36.8pp toward R · 2008: -22.3pp · 2024: -59.1pp
- All cycles
- 2024: R+59.1 2020: R+56.6 2016: R+54.1 2012: R+34.3 2008: R+22.3
Not yet ingested
- Civics
- —
Market trends
- HPI YoY
- ▲ 6.50%
- Current HPI
- 236.0122
- Rent YoY
- —
- Metro
- —
- State GDP YoY
- ▲ 1.84%
- F500 in state
- 20
Industry mix (Fortune 500 HQ in MO)
| Industry | F500 HQs | Revenue |
|---|---|---|
| Healthcare | 1 | $163B |
|
||
| Insurance | 1 | $21B |
|
||
| Industrial Technology | 1 | $17B |
|
||
| Retail | 1 | $16B |
|
||
| Industrial Distribution | 1 | $10B |
|
||
| Utilities | 1 | $9B |
|
||
Price history
4 events — show timeline
- 2026-05-21 Pending — LOBR
- 2026-05-11 Contingent — LOBR
- 2026-05-01 Listed $235,000 LOBR
- 1991-09-01 Sold (Public Records) — Public Records
Property tax history
+3.6%/yrLatest (2025): $1,000 · +15.7% YoY. Source: county tax records.
Cash-flow waterfall
monthlySold comps — $/sqft
last 12 mo · ≤1 miLoading sold comps…