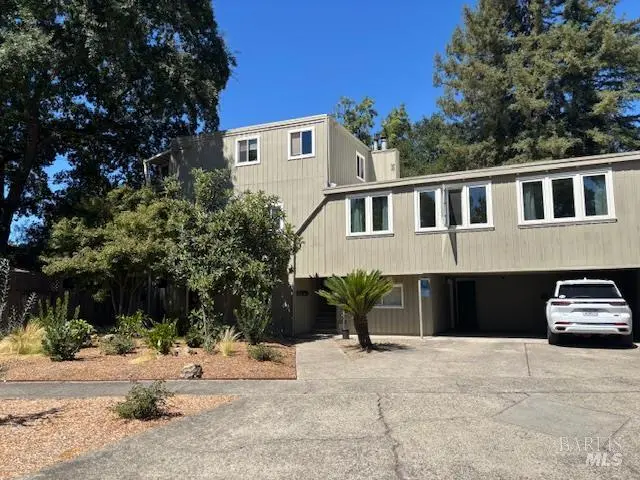
1411 4th St · Calistoga, CA
Flood risk 6/10 · Moderate
- FEMA flood zone
- X (unshaded)
- Chance of flooding over 30 yrs
- 0.69%
- Est. flood insurance / yr
- $507 – $1,088
Fire risk 7/10 · Major
- Est. fire insurance / yr
- $659 – $1,223
Heat risk 5/10 · Moderate
- Hot days now (above 100°F)
- 7 days/yr
- Hot days in 30 yrs
- 16 days/yr
Wind risk 1/10 · Minimal
- Chance of severe wind over 30 yrs
- —
Air-quality risk 10/10 · Severe
- Unhealthy air days now
- 29 days/yr
- Unhealthy air days in 30 yrs
- 30 days/yr
Risk factors via First Street. Map © Google.
Why this score? — see what drove the D- grade
The composite is a weighted blend of 9 inputs, each scored 0–100. Each bar is that input's sub-score; the figure is the points it added to the 100-point composite (weight × sub-score).
- ARV discount +14.0/15.0
- Cash flow +7.5/30.0
- Schools +3.9/10.0
- Livability +3.2/5.0
- Rent growth +2.5/5.0
- Condition / age +2.5/5.0
- DSCR +1.6/10.0
- 1% rule +1.0/10.0
- Appreciation +0.0/10.0
$985,000
🖨 Deal sheet (PDF) 📄 Offer letter ✓ Due diligence
Listing remarks MLS
Great investment opportunity in Calistoga or live in one unit and enjoy income from the other unit. The first level is mainly a carport and storage rooms. The second level is a 1692+/- sq. ft. 4 bedroom, 2 bath unit and the third level is a 594+/- sq. ft. 1 bedroom 1 bath penthouse with a deck off the living room. New roof in August 2025. 2nd level unit was painted, kitchen updated and new flooring in October 2024.
Key facts
- Large deck
- Carport
- Storage rooms
Tags
Neighborhood map
What this means for you Summary
Snapshot
- This is a 4-bed/3.0-bath single-family listed at $985k.
Deal economics
- At list price, monthly cash flow is $-1k ($-15k/yr) — negative.
- To cash-flow at today's rent, offer at most $765k (22.3% below list).
- To meet the 1% rule (rent ≥ 1% of price), the offer needs to be $593k (39.8% below list).
- Recommended offer: $593k (39.8% below list) — sets the bar for 1% rule.
- Cap rate 4.8% vs local median 2.4% in Calistoga — top-decile yield for the area; either an underpriced asset or a hidden risk that comps aren't pricing in. Stress-test before assuming the spread holds.
Location & tenants
- Location reads 63/100 on livability (#448 in CA) — a middle-class / working-renter tenant base. Strengths: health & safety A+, employment A-; Watch: schools D+, amenities F, commute F.
- Calistoga Joint Unified (town): math 33% / reading 51% proficiency, ranked #624 of 1,400 in CA (top 45%) — families likely to look elsewhere, expect single-tenant / working-renter base with shorter leases.
- Market conditions: 106 active listings in the ZIP; 2 comparable units currently listed for rent nearby; 427 units permitted in Napa County in 2024 (189 in 5+ unit buildings).
Forward outlook
- Local home prices are declining (-3.0%/yr); year-one equity from $7k of loan paydown is wiped out by about $30k of value loss. Plan a longer hold.
- Napa County population projected at +14% by 2050 — modest demand growth; plan on rents tracking national, not racing it.
Negotiation context
- It's been on market 302 days — a 12% lower offer ($867k) is reasonable based on typical stale-listing flexibility.
- 2 sale attempts since 2y ago; this cycle's ask has dropped $110k (10%) from the opening price — seller is motivated, your offer sets the floor, not the list.
- Current owner paid $200k; list at $985k implies a 392% gain — meaningful room to come down on a strong offer.
Risks & watch-outs
- Watch-outs: built in 1959 — expect roof / HVAC / electrical / plumbing capex.
- Climate carrying-cost: major flood risk; major wildfire risk; extreme-heat days projected 7→16/yr by 2055 (HVAC capex compounding) — expect insurance premiums to compound above CPI over the hold.
Questions for the listing agent
- What do current leases actually rent for vs. the listed asking? Can we see a recent rent roll and the last 12 months of T-12 income?
- It's been on market 302 days. Have you received any prior offers? Is the seller open to a 40% concession, seller financing, or rate buy-down credit?
- Built in 1959 — when were the roof, HVAC, electrical panel, plumbing, and water heater last replaced?
- Why hasn't it sold? Are there any deal-killer items the seller is aware of (foundation, flood, title, zoning, code violations)?
- Is there a deadline driving the sale (1031 exchange, divorce, estate, relocation)? That informs how much negotiation room exists.
- Schools are D-rated, which usually means shorter tenancies and higher turnover. Who's the typical renter profile here, and what's been the actual vacancy rate?
- The area grade is low — what's the realistic commute time and amenity access for the typical tenant pool here? Any planned neighborhood developments (good or bad) we should know about?
- What's the average days-on-market for RENTAL listings here right now (not sales)? A rising rental-DOM trend means longer vacancies and softer asking-rent achievability than the comps imply.
- What's the recent tenant-quality profile in this submarket — average credit score on applications, eviction rate, late-payment / NSF rate, and stable-employment percentage? A property-management company in the area should have these aggregated.
- How much new for-sale + rental construction is in the pipeline within 1–3 miles? Heavy new supply typically softens prices + rents 12–24 months out; constrained supply supports both.
Investment metrics
- 1% rule
- 0.60% ✗
- Cap rate
- 4.78%
- Cash-on-cash
- -5.42%
- DSCR
- 0.76
- GRM
- 13.8
CMA / ARV
- ARV (median comp)
- $1,150,923
- List price
- $985,000
- Delta
- -14.42%
- Verdict
- UNDERPRICED
- Comps
- 3 within 1.0 mi
Show comp detail 7 sales within ~0.75 mi
| Address | Dist | Beds/Ba | Sqft | Sold | Price | $/sf | Match |
|---|---|---|---|---|---|---|---|
| 1705 Michael Way | 0.46mi | 3/3.0 (-1) | 2,310 (+1%) | 4mo | $1,390,000 | $602 | 69 |
| 1819 Cedar St | 0.32mi | 3/2.5 (-1) | 2,234 (-2%) | 9mo | $1,250,000 | $560 | 67 |
| 1759 Emerald Dr | 0.51mi | 3/2.5 (-1) | 2,245 (-2%) | 0mo | $955,000 | $425 | 66 |
| 1705 Adele St | 0.45mi | 3/2.5 (-1) | 2,183 (-4%) | 5mo | $1,140,000 | $522 | 60 |
| 1703 Michael Way | 0.44mi | 3/1.5 (-1) | 2,380 (+4%) | 16mo | $1,150,000 | $483 | 49 |
| 1574 Centennial Cir | 0.62mi | 4/2.0 | 2,210 (-3%) | 23mo | $1,150,000 | $520 | 42 |
| 1714 Emerald Dr | 0.43mi | 3/2.5 (-1) | 2,090 (-9%) | 22mo | $1,425,000 | $682 | 40 |
Match score weights: distance 35% · size 25% · config 20% · recency 20%. Top-matched comps best support the ARV.
Projected returns pro-forma
-3.0% appreciation · 3.0% rent growth · sell at horizon
- IRR
- -25.6%
- Equity multiple
- 0.13×
- Total profit
- $-239,389
- Equity at exit
- $146,867
- IRR
- -22.3%
- Equity multiple
- -0.13×
- Total profit
- $-312,427
- Equity at exit
- $85,165
Cash invested: $275,800 (down + closing). Projections, not guarantees.
Landlord ↔ Tenant lean methodology
- Overall (STATE)
- 18 Strongly Tenant-Friendly
- State California
- 18 Strongly Tenant-Friendly · D+13
- County
- — inherits STATE
- City
- — inherits STATE
ZIP-level market 94515
- Active inventory
- 106
- Price-to-rent
- 13.8×
Monthly cashflow live
- Estimated rent
- $5,931 medium interval (Pro) →
- Mortgage (P&I)
- −$5,165
- Tax from tax record
- −$355 /mo · $4,262/yr
- Insurance
- −$410
- HOA
- −$0
- Vacancy / Maint / Mgmt
- −$1,246
- Net cashflow
- $-1,246
Break-even live
Sensitivity live
| Price | -10% $-688 | -5% $-967 | +0% $-1,246 | +5% $-1,524 | +10% $-1,803 |
|---|---|---|---|---|---|
| Rent | -10% $-1,714 | -5% $-1,480 | +0% $-1,246 | +5% $-1,011 | +10% $-777 |
| Rate | -1.0pp $-749 | -0.5pp $-995 | base $-1,246 | +0.5pp $-1,501 | +1.0pp $-1,760 |
UW: 25.0% down · 7.5% · 30yr · 1.5% tax · 5.0% vac · 8.0% maint · 8.0% mgmt
Financing live
Cash to close
- Down payment
- $246,250
- Closing costs
- $29,550
- Reserves months
- —
- Total cash needed
- —
Loan-product check · same deal, 3 products live
Conventional
25% down · 7.5% · 30yr
- Down + closing
- —
- Monthly P&I
- —
- Monthly cashflow
- —
- DSCR
- —
- Eligible?
- —
Personal DTI + credit; lowest rate.
DSCR
20% down · 8.5% · 30yr
- Down + closing
- —
- Monthly P&I
- —
- Monthly cashflow
- —
- DSCR
- —
- Eligible?
- —
No personal income docs; deal must DSCR.
Hard money
10% down · 12.0% · 12mo
- Down + closing
- —
- Monthly P&I
- —
- Monthly cashflow
- —
- DSCR
- —
- Eligible?
- —
Short-term bridge; refi at stabilization.
Rent comps 2 comps
| Address | Beds | Baths | Sqft | Rent | $/sqft | DOM | Units | Dist |
|---|---|---|---|---|---|---|---|---|
| 1612 Grant St Calistoga, CA | 3.0 | 2.0 | 1625 | $3,795 | $2.34 | 44d | 1 | 0.29mi |
| 1823 Foothill Blvd Calistoga, CA | 4.0 | 3.5 | 2889 | $9,900 | $3.43 | 3d | 1 | 0.60mi |
Listing history 24 events
-
2026-06-18days on market $985,000 Active 302 DOM
-
2026-06-17days on market $985,000 Active 301 DOM
-
2026-06-16days on market $985,000 Active 300 DOM
-
2026-06-15days on market $985,000 Active 299 DOM
-
2026-06-14days on market $985,000 Active 297 DOM
-
2026-06-13days on market $985,000 Active 296 DOM
-
2026-06-10days on market $985,000 Active 294 DOM
-
2026-06-09days on market $985,000 Active 293 DOM
-
2026-06-08days on market $985,000 Active 292 DOM
-
2026-06-07remarks 506-char remark
-
2026-06-07pricedays on market $985,000 Active 291 DOM
-
2026-06-05days on market $1,095,000 Active 288 DOM
-
2026-06-03days on market $1,095,000 Active 287 DOM
-
2026-06-02days on market $1,095,000 Active 286 DOM
-
2026-06-01days on market $1,095,000 Active 285 DOM
-
2026-05-31days on market $1,095,000 Active 284 DOM
-
2026-05-30days on market $1,095,000 Active 283 DOM
-
2025-08-20$1,095,000 Active 418-char remark
Show marketing remark (418 chars)
Great investment opportunity in Calistoga or live in one unit and enjoy income from the other unit. The first level is mainly a carport and storage rooms. The second level is a 1692+/- sq. ft. 4 bedroom, 2 bath unit and the third level is a 594+/- sq. ft. 1 bedroom 1 bath penthouse with a deck off the living room. New roof in August 2025. 2nd level unit was painted, kitchen updated and new flooring in October 2024.
-
2025-01-17historical $2,750
-
2024-11-15price $2,750
-
2024-10-08$2,995
-
2022-02-03price $1,700
-
1987-08-20soldstatus $200,000
-
1984-11-07soldstatus $131,000
ⓘ Source: listings_history table (triggers on properties + properties_extension) + one-shot
backfill from property_details.listing_events for pre-trigger history.
Tax reassessment forecast CA · Resets to sale price
- Current annual tax
- $4,262 · $355/mo
- Projected year-2 tax
- $7,486 · $624/mo
- Expected delta
- +$3,224/yr (+$269/mo · 75.7%)
ⓘ Screening estimate from a state-policy table — verify with the county assessor before closing.
Climate risk First Street
- Flood 6/10 Major FEMA zone X (unshaded) · 69% chance over 30 yrs
- Wildfire 7/10 Severe
- Heat 5/10 Major 7 d/yr ≥100°F today · 16 d/yr by 30 yrs out
- Wind 1/10 Low
- Air quality 10/10 Extreme 29 unhealthy d/yr today · 30 by 30 yrs out
Nearby sold comps map
Loading sold comps map…
Walkable amenities ~0.75 mi
Loading nearby amenities…
Taxation est. · year 1
- Rental income
- $71,172
- − Mortgage interest
- −$55,175
- − Property taxes
- −$4,262
- − Insurance
- −$4,925
- − Repairs & maintenance
- −$5,694
- − Management
- −$5,694
- − Depreciation
- −$28,655
- Taxable loss
- −$33,232
- Est. tax savings @ 24.0%
- +$7,976
- After-tax cash flow
- $-6,971/yr
For passive investors: Depreciation is non-cash, so a rental often shows a tax loss while cash-flowing — sheltering income. Rental losses are passive: they offset passive income freely, and up to $25,000/yr can offset ordinary (W-2) income if you actively participate and your MAGI is under $100k (phasing out to $0 by $150k); unused losses carry forward. On sale, claimed depreciation is recaptured at up to 25%, and gains may owe capital-gains tax (a 1031 exchange can defer both). Figures are a year-1 estimate at your 24.0% rate — not tax advice; consult a CPA.
Schools (NCES district)
- District
- Calistoga Joint Unified
- NCES district ID
- 0607020
- Math proficiency
- 33% ▲ 2.00%
- Reading proficiency
- 51% ▲ 5.00%
- Median HH income
- $60,716
- Composite
- 39.48/100
- National rank
- #8101
- State rank
- #624 of 1400 in CA
Livability — Calistoga
- Score
- 63/100
- State rank
- #448
- US rank
- #15176
Category grades
Schools grade is shown separately in the Schools card above.
Census & demographics
- Census place
- Calistoga, CA
- Population (ZIP)
- 6,921
Population outlook (Napa County) Hauer SSP2
- Today (2025)
- 153,987 people
- By 2030
- 159,490 · +3.6%
- By 2040
- 168,796 · +9.6%
- By 2050
- 176,213 · +14.4%
- By 2075
- 190,113 · +23.5%
- By 2100
- 190,528 · +23.7%
Race, ethnicity, and origin ACS 2023
- Neighborhood character
- Majority White (55%)
- Race & ethnicity
- White 55% Hispanic / Latino 41% Two or more races 18% Asian 2% Black 1%
- Hispanic origin (detail)
- Mexican 38%
- Common ancestry
- Italian 3% Lithuanian 2% Portuguese 2%
- Foreign-born
- 25% · Canada
- Languages at home
- 64% English-only · Spanish 34% Russian/Polish/Slavic 1% French/Haitian/Cajun 1%
Political lean MEDSL · Napa
- 2024 margin
- Solid D (+34.9) · D 65.9% · R 31.1% · Other 3.0%
- 2008→2024 swing
- +2.4pp toward D · 2008: 32.5pp · 2024: 34.9pp
- All cycles
- 2024: D+34.9 2020: D+40.4 2016: D+35.2 2012: D+25.7 2008: D+32.5
Not yet ingested
- Civics
- —
Market trends
- HPI YoY
- ▼ -476.46%
- Current HPI
- 244.6548
- Rent YoY
- —
- Metro
- —
- State GDP YoY
- ▲ 3.21%
- F500 in state
- 116
Industry mix (Fortune 500 HQ in CA)
| Industry | F500 HQs | Revenue |
|---|---|---|
| Technology | 27 | $1,492B |
|
||
| Financial Services | 3 | $174B |
|
||
| Retail | 3 | $44B |
|
||
| Insurance | 3 | $26B |
|
||
| Media / Entertainment | 2 | $115B |
|
||
| Pharmaceuticals / Biotech | 2 | $62B |
|
||
Price history
+735.9% since first listed7 events — show timeline
- 2025-08-20 Listed $1,095,000 BAREIS
- 2025-01-17 Rental Removed $2,750 APPFOLIO
- 2024-11-15 Price Changed $2,750 APPFOLIO
- 2024-10-08 Listed for Rent $2,995 APPFOLIO
- 2022-02-03 Price Changed $1,700 RENT.
- 1987-08-20 Sold (Public Records) $200,000 Public Records
- 1984-11-07 Sold (Public Records) $131,000 Public Records
Property tax history
+1.9%/yrLatest (2025): $4,262 · +1.7% YoY. Source: county tax records.
Cash-flow waterfall
monthlySold comps — $/sqft
last 12 mo · ≤1 miLoading sold comps…