 Duplex
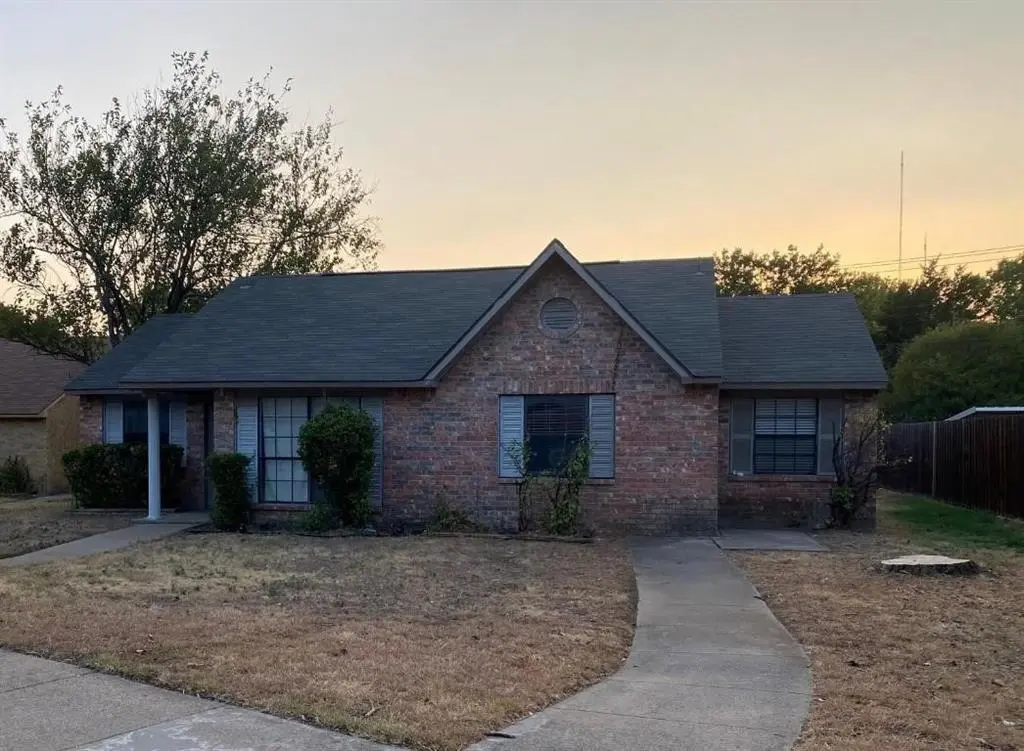
508-510 Matterhorn St · Cedar Hill, TX
Flood risk 1/10 · Minimal
- FEMA flood zone
- X (unshaded)
- Chance of flooding over 30 yrs
- 0.0%
- Est. flood insurance / yr
- $507 – $1,088
Fire risk 4/10 · Minor
- Est. fire insurance / yr
- $1,222 – $2,270
Heat risk 7/10 · Major
- Hot days now (above 110°F)
- 7 days/yr
- Hot days in 30 yrs
- 24 days/yr
Wind risk 6/10 · Moderate
- Chance of severe wind over 30 yrs
- 27.0%
Air-quality risk 3/10 · Minor
- Unhealthy air days now
- 2 days/yr
- Unhealthy air days in 30 yrs
- 3 days/yr
Risk factors via First Street. Map © Google.
Why this score? — see what drove the D grade
The composite is a weighted blend of 9 inputs, each scored 0–100. Each bar is that input's sub-score; the figure is the points it added to the 100-point composite (weight × sub-score).
- Cash flow +20.2/30.0
- DSCR +6.4/10.0
- 1% rule +4.8/10.0
- Livability +3.7/5.0
- Schools +2.5/10.0
- Condition / age +2.5/5.0
- Rent growth +2.3/5.0
- ARV discount +0.0/15.0
- Appreciation +0.0/10.0
$425,000
🖨 Deal sheet (PDF) 📄 Offer letter ✓ Due diligence
Multi-family units
County records classify this as Multi-Family (2-4 Unit). Listing-text estimate: 2 units. confirmed
Listing remarks MLS
INVESTOR SPECIAL!!! DUPLEX 6-bedroom, 2-bath home in Cedar Hill. This well-maintained property features a spacious living area, updated appliances, new flooring, 4 parking spaces and a cozy backyard perfect for entertaining. Conveniently located near amenities and in a family friendly neighborhood. Both units are currently rented. Do Not Disturb Tenants!!! Recent rental comps around $2100
Key facts
- Updated appliances
- Spacious living area
- New flooring
Tags
Neighborhood map
What this means for you Summary
Snapshot
- This is a 2 × 3-bed/1.0-bath units multifamily listed at $425k.
Deal economics
- At list price, monthly cash flow is $536 ($6k/yr) — positive. Per door: $268/mo.
- The deal already cash-flows at list — no discount required.
- To meet the 1% rule (rent ≥ 1% of price), the offer needs to be $418k (1.6% below list).
- Recommended offer: $374k (12.0% below list) — sets the bar for market timing.
- Cap rate 7.8% vs local median 3.4% in Cedar Hill — top-decile yield for the area; either an underpriced asset or a hidden risk that comps aren't pricing in. Stress-test before assuming the spread holds.
Location & tenants
- Location reads 74/100 on livability (#178 in TX, #4,673 nationally) — a middle-class / working-renter tenant base. Strengths: cost of living A+, housing A+, employment B+; Watch: amenities F, commute F.
- Cedar Hill ISD (suburban): math 19% / reading 35% proficiency, ranked #643 of 826 in TX (top 78%) — low school quality limits family demand, transient renter base, plan for 1-2y turnover.
- Zoned schools: Cedar Hill Collegiate Prep (math 42% / reading 52%, grade D-, #1,006 of 4,322 statewide, top 25%, 495 students, 49% FRL); W S Permenter Middle (math 14% / reading 28%, grade F, #1,387 of 1,662 statewide, top 85%, 626 students, 83% FRL); Cedar Hill H S (math 13% / reading 39%, grade F, #1,234 of 1,632 statewide, top 76%, 2,197 students, 68% FRL).
- Market conditions: Rents soft (-0.9%/yr); 419 active listings in the ZIP; 30 comparable units currently listed for rent nearby; rentals at typical pace (median 24d on market — plan ~3-4 weeks tenant-placement turnaround); 40% of comp listings sitting > 30 days — soft ceiling on asking rent; solid renter incomes; 12,577 units permitted in Dallas County in 2024 (6,829 in 5+ unit buildings).
- At $4,182/mo this rent would consume 49% of the median local household income ($103k/yr) (locally 1570% of renters already pay >50% of income on rent) — very limited rent-growth headroom before tenants either downsize or default.
Forward outlook
- Local home prices are declining (-3.0%/yr); year-one equity from $3k of loan paydown is wiped out by about $13k of value loss. Plan a longer hold.
- Dallas County population projected at +35% by 2050 — long-run rental-demand tailwind backs the buy-and-hold thesis.
Negotiation context
- It's been on market 168 days — a 12% lower offer ($374k) is reasonable based on typical stale-listing flexibility.
- 3 sale attempts since 2y ago; this cycle's ask has dropped $30k (7%) from the opening price — seller is motivated, your offer sets the floor, not the list.
Risks & watch-outs
- Climate carrying-cost: major wind risk, 27% chance of damaging wind over 30y; extreme-heat days projected 7→24/yr by 2055 (HVAC capex compounding) — expect insurance premiums to compound above CPI over the hold.
Questions for the listing agent
- It's been on market 168 days. Have you received any prior offers? Is the seller open to a 12% concession, seller financing, or rate buy-down credit?
- Can we see the unit-by-unit rent roll, current vacancy, and any below-market leases? What's the average tenancy length?
- What capital expenditures (roof, boiler, parking lot, exteriors) have been made in the last 5 years, and what's planned in the next 2?
- Why hasn't it sold? Are there any deal-killer items the seller is aware of (foundation, flood, title, zoning, code violations)?
- Is there a deadline driving the sale (1031 exchange, divorce, estate, relocation)? That informs how much negotiation room exists.
- The area grade is low — what's the realistic commute time and amenity access for the typical tenant pool here? Any planned neighborhood developments (good or bad) we should know about?
- What's the average days-on-market for RENTAL listings here right now (not sales)? A rising rental-DOM trend means longer vacancies and softer asking-rent achievability than the comps imply.
- What's the recent tenant-quality profile in this submarket — average credit score on applications, eviction rate, late-payment / NSF rate, and stable-employment percentage? A property-management company in the area should have these aggregated.
- How much new apartment / multifamily construction is in the pipeline within 1–3 miles? Heavy new supply (>2% of stock underway) typically softens rents 12–24 months out; light construction supports rent growth.
Investment metrics
- 1% rule
- 0.98% ✗
- Cap rate
- 7.81%
- Cash-on-cash
- 5.41%
- DSCR
- 1.24
- GRM
- 8.5
CMA / ARV
- ARV (median comp)
- $329,662
- List price
- $425,000
- Delta
- 28.92%
- Verdict
- OVERPRICED
- Comps
- 5 within 1.0 mi
Projected returns pro-forma
-3.0% appreciation · 0.0% rent growth · sell at horizon
- IRR
- -11.2%
- Equity multiple
- 0.60×
- Total profit
- $-47,006
- Equity at exit
- $63,369
- IRR
- -6.7%
- Equity multiple
- 0.63×
- Total profit
- $-44,477
- Equity at exit
- $36,746
Cash invested: $119,000 (down + closing). Projections, not guarantees.
Landlord ↔ Tenant lean methodology
- Overall (STATE)
- 87 Strongly Landlord-Friendly
- State Texas
- 87 Strongly Landlord-Friendly · R+5
- County
- — inherits STATE
- City
- — inherits STATE
ZIP-level market 75104
- Home prices YoY
- -5.5%
- Rents YoY
- -0.9%
- Active inventory
- 419
- Price-to-rent
- 16.9×
Monthly cashflow live
- Estimated rent
- $4,182 high interval (Pro) →
- Mortgage (P&I)
- −$2,229
- Tax from tax record
- −$362 /mo · $4,339/yr
- Insurance
- −$177
- HOA
- −$0
- Vacancy / Maint / Mgmt
- −$878
- Net cashflow
- $536
Break-even live
Sensitivity live
| Price | -10% $777 | -5% $657 | +0% $536 | +5% $416 | +10% $296 |
|---|---|---|---|---|---|
| Rent | -10% $206 | -5% $371 | +0% $536 | +5% $702 | +10% $867 |
| Rate | -1.0pp $750 | -0.5pp $644 | base $536 | +0.5pp $426 | +1.0pp $314 |
2-unit breakdown (identical units grouped — click to expand)
| Units | Beds | Baths | Est. rent |
|---|---|---|---|
| 2× units | 3 | 1 | $4,182 |
| #1 | 3 | 1 | $2,091 |
| #2 | 3 | 1 | $2,091 |
| Total (2 units) | $4,182 | ||
UW: 25.0% down · 7.5% · 30yr · 1.5% tax · 5.0% vac · 8.0% maint · 8.0% mgmt
Financing live
Cash to close
- Down payment
- $106,250
- Closing costs
- $12,750
- Reserves months
- —
- Total cash needed
- —
Loan-product check · same deal, 3 products live
Conventional
25% down · 7.5% · 30yr
- Down + closing
- —
- Monthly P&I
- —
- Monthly cashflow
- —
- DSCR
- —
- Eligible?
- —
Personal DTI + credit; lowest rate.
DSCR
20% down · 8.5% · 30yr
- Down + closing
- —
- Monthly P&I
- —
- Monthly cashflow
- —
- DSCR
- —
- Eligible?
- —
No personal income docs; deal must DSCR.
Hard money
10% down · 12.0% · 12mo
- Down + closing
- —
- Monthly P&I
- —
- Monthly cashflow
- —
- DSCR
- —
- Eligible?
- —
Short-term bridge; refi at stabilization.
Rent comps 30 comps
| Address | Beds | Baths | Sqft | Rent | $/sqft | DOM | Units | Dist |
|---|---|---|---|---|---|---|---|---|
| 508 Matterhorn St Cedar Hill, TX | 3.0 | 1.0 | 1160 | $2,100 | $1.81 | 45d | 1 | 0.05mi |
| 420 Dollins St Cedar Hill, TX | 2.0 | 1.0 | 1004 | $1,695 | $1.69 | 6d | 1 | 0.11mi |
| 429 Dollins St Cedar Hill, TX | 2.0 | 2.0 | 1100 | $1,700 | $1.55 | 26d | 1 | 0.13mi |
| 434 Pogue St Cedar Hill, TX | 2.0 | 2.0 | 1210 | $1,500 | $1.24 | 19d | 1 | 0.14mi |
| 439 Jones St Cedar Hill, TX | 3.0 | 1.0 | 1089 | $1,650 | $1.52 | 45d | 1 | 0.20mi |
| 415 Justice St Cedar Hill, TX | 3.0 | 2.0 | 1206 | $1,776 | $1.47 | 7d | 1 | 0.23mi |
| 415 Justice St Cedar Hill, TX | 3.0 | 2.0 | 1206 | $1,765 | $1.46 | 14d | 1 | 0.23mi |
| 528 Olympus St Cedar Hill, TX | 3.0 | 2.0 | 1346 | $2,330 | $1.73 | 7d | 1 | 0.29mi |
| 423 Vincent St Cedar Hill, TX | 4.0 | 2.0 | 1253 | $1,950 | $1.56 | 45d | 1 | 0.30mi |
| 441 S Highland Dr Cedar Hill, TX | 3.0 | 2.0 | 1243 | $1,549 | $1.25 | 45d | 1 | 0.35mi |
| 447 Vincent St Cedar Hill, TX | 2.0 | 2.0 | 993 | $1,595 | $1.61 | 21d | 1 | 0.35mi |
| 447 Vincent St Cedar Hill, TX | 2.0 | 2.0 | 993 | $1,595 | $1.61 | 14d | 1 | 0.35mi |
| 505 Pico St Cedar Hill, TX | 3.0 | 2.0 | 1446 | $1,900 | $1.31 | 45d | 1 | 0.38mi |
| 119 Halifax Dr Cedar Hill, TX | 3.0 | 2.0 | 1246 | $2,300 | $1.85 | 45d | 1 | 0.39mi |
| 201 S Clark Rd Cedar Hill, TX | 1.0–3.0 | 1.0–2.0 | 890 | $1,945 | $2.19 | 1d | 85 | 0.50mi |
| 151 E Little Creek Rd Cedar Hill, TX | 1.0–2.0 | 1.0–1.5 | 786 | $1,628 | $2.07 | 45d | 3 | 0.74mi |
| 1105 Saturn Dr Cedar Hill, TX | 3.0 | 1.5 | 1222 | $1,595 | $1.31 | 9d | 1 | 0.87mi |
| 1150 Suburban St Cedar Hill, TX | 2.0 | 1.0 | 937 | $1,450 | $1.55 | 1d | 1 | 0.93mi |
| 478 Towne Square Blvd Cedar Hill, TX | 2.0 | 2.0 | 1134 | $1,975 | $1.74 | 45d | 1 | 0.99mi |
| 801 Bluestem Way Cedar Hill, TX | 1.0–3.0 | 1.0–2.5 | 1080 | $2,857 | $2.65 | 0d | 9 | 1.12mi |
| 845 Applewood Dr Cedar Hill, TX | 3.0 | 2.0 | 1373 | $1,900 | $1.38 | 26d | 1 | 1.14mi |
| 845 Applewood Dr Cedar Hill, TX | 3.0 | 2.0 | 1373 | $1,900 | $1.38 | 45d | 1 | 1.14mi |
| 365 Uptown Blvd Cedar Hill, TX | 1.0–3.0 | 1.0–2.0 | 1099 | $2,987 | $2.72 | 0d | 29 | 1.16mi |
| 301 N Joe Wilson Rd Cedar Hill, TX | 1.0–2.0 | 1.0–2.0 | 812 | $1,683 | $2.07 | 1d | 17 | 1.21mi |
| 307 N Joe Wilson Rd Cedar Hill, TX | 2.0 | 2.0 | 984 | $1,700 | $1.73 | 45d | 1 | 1.34mi |
| 607 Springtime Dr Cedar Hill, TX | 3.0 | 2.0 | 1377 | $1,950 | $1.42 | 45d | 1 | 1.34mi |
| 1223 Reeves Ln Cedar Hill, TX | 3.0 | 2.0 | 1418 | $2,145 | $1.51 | 24d | 1 | 1.35mi |
| 700 Long Ct Cedar Hill, TX | 2.0 | 2.0 | 900 | $1,645 | $1.83 | 45d | 1 | 1.41mi |
| 715 Long Ct Cedar Hill, TX | 2.0 | 2.0 | 934 | $1,700 | $1.82 | 6d | 1 | 1.47mi |
| 715 Long Ct Cedar Hill, TX | 2.0 | 2.0 | 934 | $1,700 | $1.82 | 1d | 1 | 1.47mi |
Listing history 27 events
-
2026-06-21days on market $425,000 Active 168 DOM
-
2026-06-18days on market $425,000 Active 165 DOM
-
2026-06-17days on market $425,000 Active 164 DOM
-
2026-06-16days on market $425,000 Active 163 DOM
-
2026-06-15days on market $425,000 Active 162 DOM
-
2026-06-13days on market $425,000 Active 160 DOM
-
2026-06-09days on market $425,000 Active 156 DOM
-
2026-06-08days on market $425,000 Active 155 DOM
-
2026-06-07days on market $425,000 Active 154 DOM
-
2026-06-04days on market $425,000 Active 151 DOM
-
2026-06-03days on market $425,000 Active 150 DOM
-
2026-06-02days on market $425,000 Active 149 DOM
-
2026-06-01days on market $425,000 Active 148 DOM
-
2026-05-31days on market $425,000 Active 147 DOM
-
2026-03-13price $425,000 391-char remark
Show marketing remark (391 chars)
INVESTOR SPECIAL!!! DUPLEX 6-bedroom, 2-bath home in Cedar Hill. This well-maintained property features a spacious living area, updated appliances, new flooring, 4 parking spaces and a cozy backyard perfect for entertaining. Conveniently located near amenities and in a family friendly neighborhood. Both units are currently rented. Do Not Disturb Tenants!!! Recent rental comps around $2100
-
2026-01-04$455,000 Active 391-char remark
Show marketing remark (391 chars)
INVESTOR SPECIAL!!! DUPLEX 6-bedroom, 2-bath home in Cedar Hill. This well-maintained property features a spacious living area, updated appliances, new flooring, 4 parking spaces and a cozy backyard perfect for entertaining. Conveniently located near amenities and in a family friendly neighborhood. Both units are currently rented. Do Not Disturb Tenants!!! Recent rental comps around $2100
-
2025-08-31historical
-
2025-06-17price $419,000
-
2025-06-02status Active
-
2025-04-06price $428,000
-
2025-02-06price $432,700
-
2024-12-01price $433,000
-
2024-11-15price $439,000
-
2024-08-14price $445,000
-
2024-07-12price $446,400
-
2024-06-11price $447,400
-
2024-05-08$449,900 Active
ⓘ Source: listings_history table (triggers on properties + properties_extension) + one-shot
backfill from property_details.listing_events for pre-trigger history.
Tax reassessment forecast TX · Resets to sale price
- Current annual tax
- $4,339 · $362/mo
- Projected year-2 tax
- $7,778 · $648/mo
- Expected delta
- +$3,438/yr (+$287/mo · 79.2%)
ⓘ Screening estimate from a state-policy table — verify with the county assessor before closing.
Climate risk First Street
- Flood 1/10 Low FEMA zone X (unshaded) · 0% chance over 30 yrs
- Wildfire 4/10 Moderate
- Heat 7/10 Severe 7 d/yr ≥110°F today · 24 d/yr by 30 yrs out
- Wind 6/10 Major 27% chance of damaging wind over 30 yrs
- Air quality 3/10 Moderate 2 unhealthy d/yr today · 3 by 30 yrs out
Nearby sold comps map
Loading sold comps map…
Walkable amenities ~0.75 mi
Loading nearby amenities…
Taxation est. · year 1
- Rental income
- $50,184
- − Mortgage interest
- −$23,807
- − Property taxes
- −$4,339
- − Insurance
- −$2,125
- − Repairs & maintenance
- −$4,015
- − Management
- −$4,015
- − Depreciation
- −$12,364
- Taxable loss
- −$480
- Est. tax savings @ 24.0%
- +$115
- After-tax cash flow
- $6,551/yr
For passive investors: Depreciation is non-cash, so a rental often shows a tax loss while cash-flowing — sheltering income. Rental losses are passive: they offset passive income freely, and up to $25,000/yr can offset ordinary (W-2) income if you actively participate and your MAGI is under $100k (phasing out to $0 by $150k); unused losses carry forward. On sale, claimed depreciation is recaptured at up to 25%, and gains may owe capital-gains tax (a 1031 exchange can defer both). Figures are a year-1 estimate at your 24.0% rate — not tax advice; consult a CPA.
Schools (NCES district)
- District
- Cedar Hill ISD
- NCES district ID
- 4813230
- Math proficiency
- 19% ▼ -22.00%
- Reading proficiency
- 35% ▼ -5.00%
- Median HH income
- $64,438
- Composite
- 25.04/100
- National rank
- #7548
- State rank
- #643 of 826 in TX
Livability — Cedar Hill
- Score
- 74/100
- State rank
- #178
- US rank
- #4673
Category grades
Schools grade is shown separately in the Schools card above.
Census & demographics
- Census place
- Cedar Hill, TX
- County
- Dallas County · 2,612,404 people
- City population
- 49,228
- Metro
- Dallas-Fort Worth-Arlington, TX
- Population (ZIP)
- 49,228
- Household income
- $102,875
- Rent vs Own
- Severe rent burden
- 1570.0
Population outlook (Dallas County) Hauer SSP2
- Today (2025)
- 2,979,839 people
- By 2030
- 3,191,823 · +7.1%
- By 2040
- 3,619,611 · +21.5%
- By 2050
- 4,026,915 · +35.1%
- By 2075
- 4,957,073 · +66.4%
- By 2100
- 5,508,725 · +84.9%
Race, ethnicity, and origin ACS 2023
- Neighborhood character
- Diverse neighborhood (Simpson 0.65)
- Race & ethnicity
- Black 50% Hispanic / Latino 28% White 16% Two or more races 11% Asian 2%
- Hispanic origin (detail)
- Mexican 24%
- Common ancestry
- Lithuanian 1% Italian 1%
- Foreign-born
- 12% · Canada, Vietnam
- Languages at home
- 77% English-only · Spanish 19% Other Indo-European 1%
Political lean MEDSL · Dallas
- 2024 margin
- Strong D (+22.2) · D 60.2% · R 38.0% · Other 1.8%
- 2008→2024 swing
- +6.9pp toward D · 2008: 15.3pp · 2024: 22.2pp
- All cycles
- 2024: D+22.2 2020: D+31.6 2016: D+26.2 2012: D+15.4 2008: D+15.3
Not yet ingested
- Civics
- —
Market trends
- HPI YoY
- ▼ -16.63%
- Current HPI
- 287.5359
- Rent YoY
- ▼ -0.88%
- Metro
- Dallas-Fort Worth-Arlington, TX
- State GDP YoY
- ▲ 3.95%
- F500 in state
- 110
Industry mix (Fortune 500 HQ in TX)
| Industry | F500 HQs | Revenue |
|---|---|---|
| Energy | 16 | $1,198B |
|
||
| Technology | 5 | $198B |
|
||
| Engineering / Construction | 4 | $72B |
|
||
| Energy Services | 3 | $60B |
|
||
| Utilities | 3 | $41B |
|
||
| Healthcare | 2 | $330B |
|
||
Price history
-5.5% since first listed13 events — show timeline
- 2026-03-13 Price Changed $425,000 NTREIS
- 2026-01-04 Listed $455,000 NTREIS
- 2025-08-31 Listing Removed — NTREIS
- 2025-06-17 Price Changed $419,000 NTREIS
- 2025-06-02 Relisted — NTREIS
- 2025-04-06 Price Changed $428,000 NTREIS
- 2025-02-06 Price Changed $432,700 NTREIS
- 2024-12-01 Price Changed $433,000 NTREIS
- 2024-11-15 Price Changed $439,000 NTREIS
- 2024-08-14 Price Changed $445,000 NTREIS
- 2024-07-12 Price Changed $446,400 NTREIS
- 2024-06-11 Price Changed $447,400 NTREIS
- 2024-05-08 Listed $449,900 NTREIS
Property tax history
+6.2%/yrLatest (2025): $4,339 · +0.0% YoY. Source: county tax records.
Cash-flow waterfall
monthlySold comps — $/sqft
last 12 mo · ≤1 miLoading sold comps…