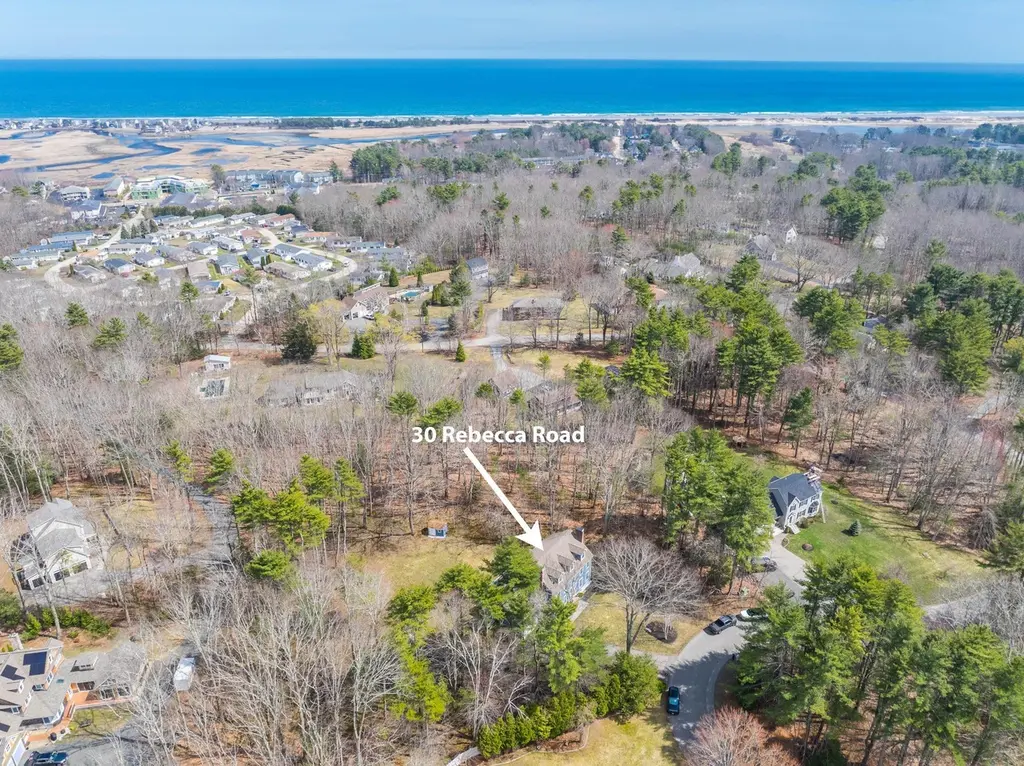
30 Rebecca Rd · Ogunquit, ME
Flood risk 1/10 · Minimal
- FEMA flood zone
- X
- Chance of flooding over 30 yrs
- 0.0%
- Est. flood insurance / yr
- $473 – $860
Fire risk 1/10 · Minimal
- Est. fire insurance / yr
- $669 – $1,243
Heat risk 4/10 · Minor
- Hot days now (above 88°F)
- 7 days/yr
- Hot days in 30 yrs
- 17 days/yr
Wind risk 6/10 · Moderate
- Chance of severe wind over 30 yrs
- 58.0%
Air-quality risk 2/10 · Minimal
- Unhealthy air days now
- 1 days/yr
- Unhealthy air days in 30 yrs
- 2 days/yr
Risk factors via First Street. Map © Google.
Why this score? — see what drove the D- grade
The composite is a weighted blend of 9 inputs, each scored 0–100. Each bar is that input's sub-score; the figure is the points it added to the 100-point composite (weight × sub-score).
- ARV discount +12.8/15.0
- Appreciation +7.8/10.0
- Schools +7.6/10.0
- Cash flow +2.7/30.0
- Rent growth +2.5/5.0
- Livability +2.5/5.0
- Condition / age +2.5/5.0
- 1% rule +0.0/10.0
- DSCR +0.0/10.0
$1,290,000
🖨 Deal sheet 📄 Offer letter ✓ Due diligence
Listing remarks MLS
Tucked away on a quiet cul-de-sac just outside the center of Ogunquit, this expansive 3,700+ sq ft home, in a thriving neighborhood, offers something increasingly rare in this market: true space, privacy, and flexibility--without sacrificing proximity to the coast. While many Ogunquit properties prioritize walkability and seasonal use, 30 Rebecca Road is designed for how people want to live, whether year-round or as a second home. Set on over 1.7 acres, the property provides a sense of separation and calm that's hard to find in town, while still being just minutes from Ogunquit's beaches, restaurants, and village center. Inside, the scale of the home allows for multiple living zones, ideal for multi-generational living, extended guest stays, entertaining, or simply spreading out. The layout supports both everyday comfort and larger gatherings, offering a level of versatility that smaller cottages and condos simply can't match. For buyers who have explored Ogunquit's more densely built neighborhoods and found themselves wanting more space, more privacy, and a home that functions beyond the summer season, this property represents a compelling alternative.
Key facts
- 1.73 acre lot
- 2 garage spots
- Built 1998
Neighborhood map
What this means for you Summary
Snapshot
- This is a 3-bed/2.5-bath single-family listed at $1.29M.
Deal economics
- At list price, monthly cash flow is $-4k ($-53k/yr) — negative.
- To cash-flow at today's rent, offer at most $515k (60.0% below list).
- To meet the 1% rule (rent ≥ 1% of price), the offer needs to be $430k (66.7% below list).
- Recommended offer: $430k (66.7% below list) — sets the bar for 1% rule.
Location & tenants
- Location reads: area grade D — affects rentability + tenant quality, not the cash-flow math above.
- Wells-Ogunquit CSD (rural): math 87% / reading 90% proficiency, ranked #32 of 112 in ME (top 29%) — strong family-tenant draw, lease renewals of 3-5y typical; only 17% free/reduced lunch — higher-income household profile.
- Market conditions: 42 active listings in the ZIP; 1,386 units permitted in York County in 2024 (338 in 5+ unit buildings).
Forward outlook
- In year one you build about $82k of equity ($9k loan paydown + $73k appreciation (5.6% local appreciation)).
- By year 2, paydown + projected appreciation supports a ~$131k cash-out refi (75% LTV) — recoverable capital for the next deal without selling this one.
Negotiation context
- It's been on market 59 days — a 3% lower offer ($1.25M) is reasonable based on typical stale-listing flexibility.
- 3 sale attempts since 10y ago with the ask held roughly flat each time — persistent listings suggest the price (not the market) is what's stuck; bring a comps-based counter.
- Current owner paid $565k; list at $1.29M implies a 128% gain — meaningful room to come down on a strong offer.
Risks & watch-outs
- Climate carrying-cost: major wind risk, 58% chance of damaging wind over 30y — expect insurance premiums to compound above CPI over the hold.
Questions for the listing agent
- What do current leases actually rent for vs. the listed asking? Can we see a recent rent roll and the last 12 months of T-12 income?
- It's been on market 59 days. Have you received any prior offers? Is the seller open to a 67% concession, seller financing, or rate buy-down credit?
- Is there a deadline driving the sale (1031 exchange, divorce, estate, relocation)? That informs how much negotiation room exists.
- The area grade is low — what's the realistic commute time and amenity access for the typical tenant pool here? Any planned neighborhood developments (good or bad) we should know about?
- What's the average days-on-market for RENTAL listings here right now (not sales)? A rising rental-DOM trend means longer vacancies and softer asking-rent achievability than the comps imply.
- What's the recent tenant-quality profile in this submarket — average credit score on applications, eviction rate, late-payment / NSF rate, and stable-employment percentage? A property-management company in the area should have these aggregated.
- How much new for-sale + rental construction is in the pipeline within 1–3 miles? Heavy new supply typically softens prices + rents 12–24 months out; constrained supply supports both.
Investment metrics
- 1% rule
- 0.33% ✗
- Cap rate
- 2.21%
- Cash-on-cash
- -14.57%
- DSCR
- 0.35
- GRM
- 25.0
CMA / ARV
- ARV (median comp)
- $1,461,294
- List price
- $1,290,000
- Delta
- -11.72%
- Verdict
- UNDERPRICED
- Comps
- 11 within 1.0 mi
Projected returns pro-forma
5.63% appreciation · 3.0% rent growth · sell at horizon
- IRR
- 2.7%
- Equity multiple
- 1.18×
- Total profit
- $64,636
- Equity at exit
- $781,257
- IRR
- 5.7%
- Equity multiple
- 2.15×
- Total profit
- $415,533
- Equity at exit
- $1,391,829
Cash invested: $361,200 (down + closing). Projections, not guarantees.
Landlord ↔ Tenant lean methodology
- Overall (STATE)
- 41 Moderately Tenant-Leaning
- State Maine
- 41 Moderately Tenant-Leaning · D+2
- County
- — inherits STATE
- City
- — inherits STATE
ZIP-level market 03907
- Home prices YoY
- 1.2%
- Active inventory
- 42
- Price-to-rent
- 25.0×
Monthly cashflow live
- Estimated rent
- $4,298 medium interval (Pro) →
- Mortgage (P&I)
- −$6,765
- Tax from tax record
- −$478 /mo · $5,735/yr
- Insurance
- −$538
- HOA
- −$0
- Vacancy / Maint / Mgmt
- −$903
- Net cashflow
- $-4,385
Break-even live
UW: 25.0% down · 7.5% · 30yr · 1.5% tax · 5.0% vac · 8.0% maint · 8.0% mgmt
Financing live
Cash to close
- Down payment
- $322,500
- Closing costs
- $38,700
- Reserves months
- —
- Total cash needed
- —
Loan-product check · same deal, 3 products live
Conventional
25% down · 7.5% · 30yr
- Down + closing
- —
- Monthly P&I
- —
- Monthly cashflow
- —
- DSCR
- —
- Eligible?
- —
Personal DTI + credit; lowest rate.
DSCR
20% down · 8.5% · 30yr
- Down + closing
- —
- Monthly P&I
- —
- Monthly cashflow
- —
- DSCR
- —
- Eligible?
- —
No personal income docs; deal must DSCR.
Hard money
10% down · 12.0% · 12mo
- Down + closing
- —
- Monthly P&I
- —
- Monthly cashflow
- —
- DSCR
- —
- Eligible?
- —
Short-term bridge; refi at stabilization.
Listing history 24 events
-
2026-06-18days on market $1,290,000 Active 59 DOM
-
2026-06-17days on market $1,290,000 Active 58 DOM
-
2026-06-16days on market $1,290,000 Active 57 DOM
-
2026-06-15days on market $1,290,000 Active 56 DOM
-
2026-06-14days on market $1,290,000 Active 54 DOM
-
2026-06-13days on market $1,290,000 Active 53 DOM
-
2026-06-10days on market $1,290,000 Active 51 DOM
-
2026-06-09days on market $1,290,000 Active 50 DOM
-
2026-06-08days on market $1,290,000 Active 49 DOM
-
2026-06-07days on market $1,290,000 Active 48 DOM
-
2026-06-05days on market $1,290,000 Active 45 DOM
-
2026-06-03days on market $1,290,000 Active 44 DOM
-
2026-06-02days on market $1,290,000 Active 43 DOM
-
2026-06-01days on market $1,290,000 Active 42 DOM
-
2026-05-31days on market $1,290,000 Active 41 DOM
-
2026-05-30days on market $1,290,000 Active 40 DOM
-
2026-04-20$1,290,000 Active 1171-char remark
Show marketing remark (1171 chars)
Tucked away on a quiet cul-de-sac just outside the center of Ogunquit, this expansive 3,700+ sq ft home, in a thriving neighborhood, offers something increasingly rare in this market: true space, privacy, and flexibility--without sacrificing proximity to the coast. While many Ogunquit properties prioritize walkability and seasonal use, 30 Rebecca Road is designed for how people want to live, whether year-round or as a second home. Set on over 1.7 acres, the property provides a sense of separation and calm that's hard to find in town, while still being just minutes from Ogunquit's beaches, restaurants, and village center. Inside, the scale of the home allows for multiple living zones, ideal for multi-generational living, extended guest stays, entertaining, or simply spreading out. The layout supports both everyday comfort and larger gatherings, offering a level of versatility that smaller cottages and condos simply can't match. For buyers who have explored Ogunquit's more densely built neighborhoods and found themselves wanting more space, more privacy, and a home that functions beyond the summer season, this property represents a compelling alternative.
-
2023-05-23historical
-
2023-03-15$1,250,000 Active
-
2017-01-23soldstatus $565,000 Sold
-
2016-12-21status Pending
-
2016-10-18price $599,000
-
2016-09-27$619,000 Active
-
2014-04-28soldstatus $565,000
ⓘ Source: listings_history table (triggers on properties + properties_extension) + one-shot
backfill from property_details.listing_events for pre-trigger history.
Tax reassessment forecast ME · Partial reset (capped growth)
- Current annual tax
- $5,735 · $478/mo
- Projected year-2 tax
- $11,640 · $970/mo
- Expected delta
- +$5,904/yr (+$492/mo · 103.0%)
ⓘ Screening estimate from a state-policy table — verify with the county assessor before closing.
Climate risk First Street
- Flood 1/10 Low FEMA zone X · 0% chance over 30 yrs
- Wildfire 1/10 Low
- Heat 4/10 Moderate 7 d/yr ≥88°F today · 17 d/yr by 30 yrs out
- Wind 6/10 Major 58% chance of damaging wind over 30 yrs
- Air quality 2/10 Low 1 unhealthy d/yr today · 2 by 30 yrs out
Nearby sold comps map
Loading sold comps map…
Walkable amenities ~0.75 mi
Loading nearby amenities…
Taxation est. · year 1
- Rental income
- $51,576
- − Mortgage interest
- −$72,260
- − Property taxes
- −$5,735
- − Insurance
- −$6,450
- − Repairs & maintenance
- −$4,126
- − Management
- −$4,126
- − Depreciation
- −$37,527
- Taxable loss
- −$78,648
- Est. tax savings @ 24.0%
- +$18,876
- After-tax cash flow
- $-33,743/yr
For passive investors: Depreciation is non-cash, so a rental often shows a tax loss while cash-flowing — sheltering income. Rental losses are passive: they offset passive income freely, and up to $25,000/yr can offset ordinary (W-2) income if you actively participate and your MAGI is under $100k (phasing out to $0 by $150k); unused losses carry forward. On sale, claimed depreciation is recaptured at up to 25%, and gains may owe capital-gains tax (a 1031 exchange can defer both). Figures are a year-1 estimate at your 24.0% rate — not tax advice; consult a CPA.
Schools (NCES district)
- District
- Wells-Ogunquit CSD
- NCES district ID
- 2313490
- Math proficiency
- 87% ▲ 42.00%
- Reading proficiency
- 90% ▲ 26.00%
- Median HH income
- $61,341
- Composite
- 75.79/100
- National rank
- #125
- State rank
- #32 of 112 in ME
Livability — Ogunquit
No livability data for this city. (Only ~50 U.S. cities are tracked.)
Census & demographics
- Population (ZIP)
- 1,264
Population outlook (York County) Hauer SSP2
- Today (2025)
- 209,961 people
- By 2030
- 212,816 · +1.4%
- By 2040
- 214,360 · +2.1%
- By 2050
- 210,350 · +0.2%
- By 2075
- 201,686 · -3.9%
- By 2100
- 183,392 · -12.7%
Race, ethnicity, and origin ACS 2023
- Neighborhood character
- Predominantly White (96%)
- Race & ethnicity
- White 96% Two or more races 3% Hispanic / Latino 1%
- Common ancestry
- Lithuanian 13% German 5% Slovak 4%
- Foreign-born
- 3% · Canada
- Languages at home
- 94% English-only · Other Indo-European 2% Other Asian/Pacific 2%
Political lean MEDSL · York
- 2024 margin
- D (+10.5) · D 54.3% · R 43.8% · Other 1.9%
- 2008→2024 swing
- -10.1pp toward R · 2008: 20.5pp · 2024: 10.5pp
- All cycles
- 2024: D+10.5 2020: D+12.6 2016: D+4.8 2012: D+16.4 2008: D+20.5
Not yet ingested
- Civics
- —
Market trends
- HPI YoY
- ▲ 5.63%
- Current HPI
- 471.7521
- Rent YoY
- —
- Metro
- —
- State GDP YoY
- —
- F500 in state
- 0
Price history
+128.3% since first listed8 events — show timeline
- 2026-04-20 Listed $1,290,000 MREIS
- 2023-05-23 Delisted — MREIS
- 2023-03-15 Listed $1,250,000 MREIS
- 2017-01-23 Sold (MLS) $565,000 MREIS
- 2016-12-21 Pending — MREIS
- 2016-10-18 Price Changed $599,000 MREIS
- 2016-09-27 Listed $619,000 MREIS
- 2014-04-28 Sold (MLS) $565,000 MREIS
Property tax history
+0.7%/yrLatest (2025): $5,735 · +4.2% YoY. Source: county tax records.
Cash-flow waterfall
monthlySold comps — $/sqft
last 12 mo · ≤1 miLoading sold comps…