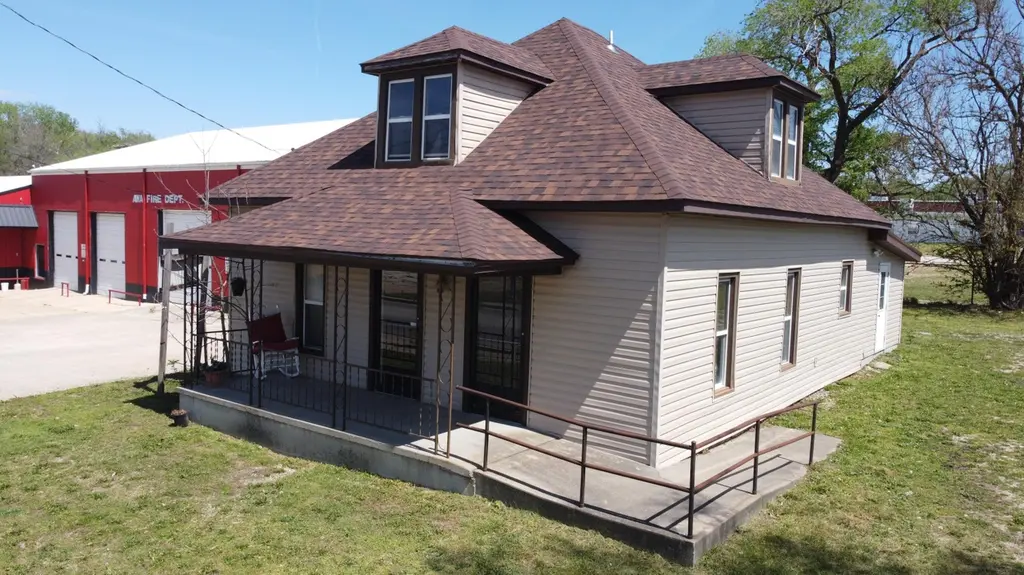
902 N Jefferson St · Ava, MO
Flood risk 1/10 · Minimal
- FEMA flood zone
- X
- Chance of flooding over 30 yrs
- 0.0%
- Est. flood insurance / yr
- $507 – $1,088
Fire risk 4/10 · Minor
- Est. fire insurance / yr
- $1,054 – $1,958
Heat risk 5/10 · Moderate
- Hot days now (above 106°F)
- 7 days/yr
- Hot days in 30 yrs
- 19 days/yr
Wind risk 2/10 · Minimal
- Chance of severe wind over 30 yrs
- 0.0%
Air-quality risk 2/10 · Minimal
- Unhealthy air days now
- 1 days/yr
- Unhealthy air days in 30 yrs
- 1 days/yr
Risk factors via First Street. Map © Google.
Why this score? — see what drove the D+ grade
The composite is a weighted blend of 9 inputs, each scored 0–100. Each bar is that input's sub-score; the figure is the points it added to the 100-point composite (weight × sub-score).
- Cash flow +12.8/30.0
- Appreciation +9.5/10.0
- ARV discount +9.0/15.0
- Livability +4.1/5.0
- DSCR +3.8/10.0
- Schools +3.2/10.0
- Rent growth +2.5/5.0
- Condition / age +2.5/5.0
- 1% rule +2.3/10.0
$156,000
🖨 Deal sheet (PDF) 📄 Offer letter ✓ Due diligence
Listing remarks MLS
This Home was previously a business & could be again-Could also be a B & B or many other possibilities! Located close to Restaurants, Shopping & School-also close to the Missouri Foxtrotter's Association, Glade Top Trail, Rock Bridge Trout Farm, Laura Ingalls Wilder Home & Bull Shoals Lake. The Home has had many updates as well as the addition of a Bedroom & Utility/Mud Room. The Original Hardwood floors run throughout the Home. The property also has an upstairs that could be updated to include 2 bedrooms & additional bathroom(toilet already in place). Check this one out-Great Possibilities!
Key facts
- Close to school
- Close to restaurants
- Close to shopping
Tags
Neighborhood map
What this means for you Summary
Snapshot
- This is a 2-bed/1.0-bath other listed at $156k.
Deal economics
- At list price, monthly cash flow is $-13 ($-157/yr) — negative.
- To cash-flow at today's rent, offer at most $154k (1.5% below list).
- To meet the 1% rule (rent ≥ 1% of price), the offer needs to be $115k (26.6% below list).
- Recommended offer: $115k (26.6% below list) — sets the bar for 1% rule.
- Cap rate 6.2% vs local median 3.6% in Ava — top-decile yield for the area; either an underpriced asset or a hidden risk that comps aren't pricing in. Stress-test before assuming the spread holds.
Location & tenants
- Location reads 82/100 on livability (#12 in MO, #1,299 nationally) — a professional / high-income tenant draw. Strengths: crime A+, cost of living A+, housing A+; Watch: schools C-, commute F, employment F.
- Ava R-I (town): math 36% / reading 43% proficiency, ranked #177 of 324 in MO (top 55%) — families likely to look elsewhere, expect single-tenant / working-renter base with shorter leases.
- Market conditions: 139 active listings in the ZIP; 3 comparable units currently listed for rent nearby; rentals lingering (median 44d on market — plan ~5-8 weeks vacancy on turnover, expect pricing pressure); 100% of comp listings sitting > 30 days — soft ceiling on asking rent; 21 units permitted in Douglas County in 2024 (10 in 5+ unit buildings).
Forward outlook
- In year one you build about $15k of equity ($1k loan paydown + $14k appreciation (9.1% local appreciation)).
- Douglas County population projected at -29% by 2050 — secular population decline; favor cash flow + early exit over multi-decade hold.
- At projected returns (9.1% appreciation + 3.0% rent growth), your $44k cash investment doubles in ~3 years — after that, you're playing with house money.
- By year 3, paydown + projected appreciation supports a ~$38k cash-out refi (75% LTV) — recoverable capital for the next deal without selling this one.
Negotiation context
- It's been on market 62 days — a 6% lower offer ($147k) is reasonable based on typical stale-listing flexibility.
- 2 sale attempts since 2y ago with the ask held roughly flat each time — persistent listings suggest the price (not the market) is what's stuck; bring a comps-based counter.
Risks & watch-outs
- Watch-outs: built in 1900 — expect roof / HVAC / electrical / plumbing capex.
- Climate carrying-cost: extreme-heat days projected 7→19/yr by 2055 (HVAC capex compounding) — expect insurance premiums to compound above CPI over the hold.
Questions for the listing agent
- What do current leases actually rent for vs. the listed asking? Can we see a recent rent roll and the last 12 months of T-12 income?
- It's been on market 62 days. Have you received any prior offers? Is the seller open to a 27% concession, seller financing, or rate buy-down credit?
- Built in 1900 — when were the roof, HVAC, electrical panel, plumbing, and water heater last replaced?
- Why hasn't it sold? Are there any deal-killer items the seller is aware of (foundation, flood, title, zoning, code violations)?
- Is there a deadline driving the sale (1031 exchange, divorce, estate, relocation)? That informs how much negotiation room exists.
- The area grade is low — what's the realistic commute time and amenity access for the typical tenant pool here? Any planned neighborhood developments (good or bad) we should know about?
- What's the average days-on-market for RENTAL listings here right now (not sales)? A rising rental-DOM trend means longer vacancies and softer asking-rent achievability than the comps imply.
- What's the recent tenant-quality profile in this submarket — average credit score on applications, eviction rate, late-payment / NSF rate, and stable-employment percentage? A property-management company in the area should have these aggregated.
- How much new for-sale + rental construction is in the pipeline within 1–3 miles? Heavy new supply typically softens prices + rents 12–24 months out; constrained supply supports both.
Investment metrics
- 1% rule
- 0.73% ✗
- Cap rate
- 6.19%
- Cash-on-cash
- -0.36%
- DSCR
- 0.98
- GRM
- 11.3
CMA / ARV
- ARV (median comp)
- $161,461
- List price
- $156,000
- Delta
- -3.38%
- Verdict
- FAIR
- Comps
- 20 within 1.0 mi
Projected returns pro-forma
9.05% appreciation · 3.0% rent growth · sell at horizon
- IRR
- 22.0%
- Equity multiple
- 2.69×
- Total profit
- $74,010
- Equity at exit
- $129,859
- IRR
- 19.9%
- Equity multiple
- 5.95×
- Total profit
- $216,356
- Equity at exit
- $269,409
Cash invested: $43,680 (down + closing). Projections, not guarantees.
Landlord ↔ Tenant lean methodology
- Overall (STATE)
- 81 Strongly Landlord-Friendly
- State Missouri
- 81 Strongly Landlord-Friendly · R+10
- County
- — inherits STATE
- City
- — inherits STATE
ZIP-level market 65608
- Home prices YoY
- 3.8%
- Active inventory
- 139
- Price-to-rent
- 11.3×
Monthly cashflow live
- Estimated rent
- $1,146 medium interval (Pro) →
- Mortgage (P&I)
- −$818
- Tax from tax record
- −$35 /mo · $422/yr
- Insurance
- −$65
- HOA
- −$0
- Vacancy / Maint / Mgmt
- −$241
- Net cashflow
- $-13
Break-even live
Sensitivity live
| Price | -10% $75 | -5% $31 | +0% $-13 | +5% $-57 | +10% $-101 |
|---|---|---|---|---|---|
| Rent | -10% $-104 | -5% $-58 | +0% $-13 | +5% $32 | +10% $77 |
| Rate | -1.0pp $65 | -0.5pp $27 | base $-13 | +0.5pp $-54 | +1.0pp $-95 |
UW: 25.0% down · 7.5% · 30yr · 1.5% tax · 5.0% vac · 8.0% maint · 8.0% mgmt
Financing live
Cash to close
- Down payment
- $39,000
- Closing costs
- $4,680
- Reserves months
- —
- Total cash needed
- —
Loan-product check · same deal, 3 products live
Conventional
25% down · 7.5% · 30yr
- Down + closing
- —
- Monthly P&I
- —
- Monthly cashflow
- —
- DSCR
- —
- Eligible?
- —
Personal DTI + credit; lowest rate.
DSCR
20% down · 8.5% · 30yr
- Down + closing
- —
- Monthly P&I
- —
- Monthly cashflow
- —
- DSCR
- —
- Eligible?
- —
No personal income docs; deal must DSCR.
Hard money
10% down · 12.0% · 12mo
- Down + closing
- —
- Monthly P&I
- —
- Monthly cashflow
- —
- DSCR
- —
- Eligible?
- —
Short-term bridge; refi at stabilization.
Rent comps 3 comps
| Address | Beds | Baths | Sqft | Rent | $/sqft | DOM | Units | Dist |
|---|---|---|---|---|---|---|---|---|
| 205D Knaack CT Unit 1 Ava, MO | 2.0 | 2.0 | 900 | $1,000 | $1.11 | 44d | 1 | 0.43mi |
| 1322 Springfield Rd Unit 7 Ava, MO | 2.0 | 2.0 | 1125 | $1,250 | $1.11 | 44d | 1 | 0.71mi |
| 1315 Airport Rd Unit 9 Ava, MO | 2.0 | 2.0 | 1250 | $1,250 | $1.00 | 44d | 1 | 0.90mi |
Listing history 17 events
-
2026-06-18days on market $156,000 Active 62 DOM
-
2026-06-17days on market $156,000 Active 61 DOM
-
2026-06-16days on market $156,000 Active 60 DOM
-
2026-06-15days on market $156,000 Active 59 DOM
-
2026-06-13days on market $156,000 Active 57 DOM
-
2026-06-12days on market $156,000 Active 56 DOM
-
2026-06-09days on market $156,000 Active 53 DOM
-
2026-06-08days on market $156,000 Active 52 DOM
-
2026-06-07days on market $156,000 Active 51 DOM
-
2026-06-07pricedays on market $156,000 Active 50 DOM
-
2026-06-04days on market $160,000 Active 47 DOM
-
2026-06-02days on market $160,000 Active 46 DOM
-
2026-06-01days on market $160,000 Active 45 DOM
-
2026-05-31days on market $160,000 Active 44 DOM
-
2026-04-17$160,000 Active 634-char remark
Show marketing remark (634 chars)
This Home was previously a business & could be again-Could also be a B & B or many other possibilities! Located close to Restaurants, Shopping & School-also close to the Missouri Foxtrotter's Association, Glade Top Trail, Rock Bridge Trout Farm, Laura Ingalls Wilder Home & Bull Shoals Lake. The Home has had many updates as well as the addition of a Bedroom & Utility/Mud Room. The Original Hardwood floors run throughout the Home. The property also has an upstairs that could be updated to include 2 bedrooms & additional bathroom(toilet already in place). Check this one out-Great Possibilities!
-
2024-08-20price $149,000
-
2024-07-12$159,000 Active
ⓘ Source: listings_history table (triggers on properties + properties_extension) + one-shot
backfill from property_details.listing_events for pre-trigger history.
Tax reassessment forecast MO · Resets to sale price
- Current annual tax
- $422 · $35/mo
- Projected year-2 tax
- $1,513 · $126/mo
- Expected delta
- +$1,091/yr (+$91/mo · 258.5%)
ⓘ Screening estimate from a state-policy table — verify with the county assessor before closing.
Climate risk First Street
- Flood 1/10 Low FEMA zone X · 0% chance over 30 yrs
- Wildfire 4/10 Moderate
- Heat 5/10 Major 7 d/yr ≥106°F today · 19 d/yr by 30 yrs out
- Wind 2/10 Low 0% chance of damaging wind over 30 yrs
- Air quality 2/10 Low 1 unhealthy d/yr today · 1 by 30 yrs out
Nearby sold comps map
Loading sold comps map…
Walkable amenities ~0.75 mi
Loading nearby amenities…
Taxation est. · year 1
- Rental income
- $13,749
- − Mortgage interest
- −$8,738
- − Property taxes
- −$422
- − Insurance
- −$780
- − Repairs & maintenance
- −$1,100
- − Management
- −$1,100
- − Depreciation
- −$4,538
- Taxable loss
- −$2,929
- Est. tax savings @ 24.0%
- +$703
- After-tax cash flow
- $546/yr
For passive investors: Depreciation is non-cash, so a rental often shows a tax loss while cash-flowing — sheltering income. Rental losses are passive: they offset passive income freely, and up to $25,000/yr can offset ordinary (W-2) income if you actively participate and your MAGI is under $100k (phasing out to $0 by $150k); unused losses carry forward. On sale, claimed depreciation is recaptured at up to 25%, and gains may owe capital-gains tax (a 1031 exchange can defer both). Figures are a year-1 estimate at your 24.0% rate — not tax advice; consult a CPA.
Schools (NCES district)
- District
- Ava R-I
- NCES district ID
- 2904050
- Math proficiency
- 36% ▼ -1.00%
- Reading proficiency
- 43% ▼ -2.00%
- Median HH income
- $31,148
- Composite
- 32.25/100
- National rank
- #5766
- State rank
- #177 of 324 in MO
Livability — Ava
- Score
- 82/100
- State rank
- #12
- US rank
- #1299
Category grades
Schools grade is shown separately in the Schools card above.
Census & demographics
- Census place
- Ava, MO
- Population (ZIP)
- 8,478
Population outlook (Douglas County) Hauer SSP2
- Today (2025)
- 12,395 people
- By 2030
- 11,690 · -5.7%
- By 2040
- 10,185 · -17.8%
- By 2050
- 8,805 · -29.0%
- By 2075
- 6,716 · -45.8%
- By 2100
- 5,493 · -55.7%
Race, ethnicity, and origin ACS 2023
- Neighborhood character
- Predominantly White (93%)
- Race & ethnicity
- White 93% Two or more races 4% Native American 1% Hispanic / Latino 1% Black 1%
- Common ancestry
- Lithuanian 4% Slovak 2% Iranian 2%
- Foreign-born
- 1% · Canada
Political lean MEDSL · Douglas
- 2024 margin
- Solid R (+72.0) · D 13.7% · R 85.6%
- 2008→2024 swing
- -38.2pp toward R · 2008: -33.8pp · 2024: -72.0pp
- All cycles
- 2024: R+72.0 2020: R+69.8 2016: R+67.5 2012: R+44.8 2008: R+33.8
Not yet ingested
- Civics
- —
Market trends
- HPI YoY
- ▲ 9.05%
- Current HPI
- 249.1557
- Rent YoY
- —
- Metro
- —
- State GDP YoY
- ▲ 1.84%
- F500 in state
- 20
Industry mix (Fortune 500 HQ in MO)
| Industry | F500 HQs | Revenue |
|---|---|---|
| Healthcare | 1 | $163B |
|
||
| Insurance | 1 | $21B |
|
||
| Industrial Technology | 1 | $17B |
|
||
| Retail | 1 | $16B |
|
||
| Industrial Distribution | 1 | $10B |
|
||
| Utilities | 1 | $9B |
|
||
Price history
+0.6% since first listed3 events — show timeline
- 2026-04-17 Listed $160,000 SOMO
- 2024-08-20 Price Changed $149,000 SOMO
- 2024-07-12 Listed $159,000 SOMO
Property tax history
-1.1%/yrLatest (2025): $422 · -46.5% YoY. Source: county tax records.
Cash-flow waterfall
monthlySold comps — $/sqft
last 12 mo · ≤1 miLoading sold comps…