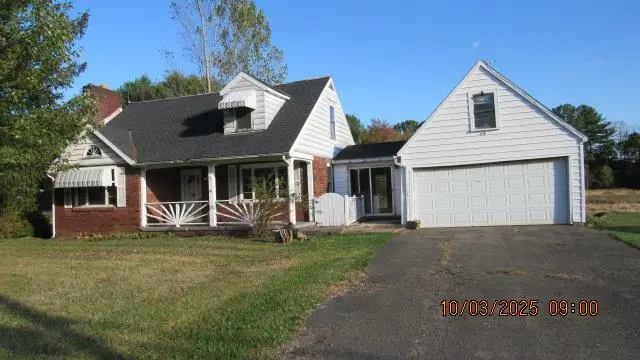
687 Route 157 · Cranberry, PA
Flood risk 1/10 · Minimal
- FEMA flood zone
- X (unshaded)
- Chance of flooding over 30 yrs
- 0.0%
- Est. flood insurance / yr
- $473 – $860
Fire risk 3/10 · Minor
- Est. fire insurance / yr
- $511 – $949
Heat risk 2/10 · Minimal
- Hot days now (above 92°F)
- 7 days/yr
- Hot days in 30 yrs
- 18 days/yr
Wind risk 1/10 · Minimal
- Chance of severe wind over 30 yrs
- —
Air-quality risk 2/10 · Minimal
- Unhealthy air days now
- 1 days/yr
- Unhealthy air days in 30 yrs
- 2 days/yr
Risk factors via First Street. Map © Google.
Why this score? — see what drove the B+ grade
The composite is a weighted blend of 9 inputs, each scored 0–100. Each bar is that input's sub-score; the figure is the points it added to the 100-point composite (weight × sub-score).
- Cash flow +27.1/30.0
- ARV discount +15.0/15.0
- DSCR +9.4/10.0
- 1% rule +7.4/10.0
- Appreciation +6.1/10.0
- Schools +3.6/10.0
- Rent growth +2.5/5.0
- Livability +2.5/5.0
- Condition / age +2.5/5.0
$109,900
🖨 Deal sheet 📄 Offer letter ✓ Due diligence
Listing remarks MLS
Cape Cod Home on 2.3 Acres in Cranberry Township , Venango County. Home has 3 Bedrooms and 1.5 Baths with attached 2 Car garage. Property is being SOLD AS IS AND NO WARRANTY! All Offers must be submitted via PropOffers.com web-site by the Realtor.
Key facts
- 2.3 acre lot
- 2 garage spots
- Built 1954
Neighborhood map
What this means for you Summary
Snapshot
- This is a 3-bed/1.0-bath single-family listed at $110k.
Deal economics
- At list price, monthly cash flow is $310 ($4k/yr) — positive.
- The deal already cash-flows at list — no discount required.
- Meets the 1% rule at list price ($1k rent vs $110k).
- Recommended offer: $97k (12.0% below list) — sets the bar for market timing.
Location & tenants
- Location reads: area grade B — affects rentability + tenant quality, not the cash-flow math above.
- Cranberry Area SD (rural): math 32% / reading 52% proficiency, ranked #327 of 539 in PA (top 61%) — families likely to look elsewhere, expect single-tenant / working-renter base with shorter leases.
- Market conditions: 53 active listings in the ZIP; 42 units permitted in Venango County in 2024 (0 in 5+ unit buildings).
Forward outlook
- In year one you build about $3k of equity ($760 loan paydown + $2k appreciation (2.2% local appreciation)).
- Venango County population projected at -30% by 2050 — secular population decline; favor cash flow + early exit over multi-decade hold.
- At projected returns (2.2% appreciation + 3.0% rent growth), your $31k cash investment doubles in ~5 years — after that, you're playing with house money.
- By year 10, paydown + projected appreciation supports a ~$31k cash-out refi (75% LTV) — recoverable capital for the next deal without selling this one.
Negotiation context
- It's been on market 384 days — a 12% lower offer ($97k) is reasonable based on typical stale-listing flexibility.
- 3 sale attempts since 3y ago; this cycle's ask has dropped $40k (27%) from the opening price — seller is motivated, your offer sets the floor, not the list.
- Current owner paid $85k; 29% above their basis — modest negotiation headroom, anchor on the comps not their cost.
Risks & watch-outs
- Watch-outs: built in 1954 — expect roof / HVAC / electrical / plumbing capex.
Questions for the listing agent
- It's been on market 384 days. Have you received any prior offers? Is the seller open to a 12% concession, seller financing, or rate buy-down credit?
- Built in 1954 — when were the roof, HVAC, electrical panel, plumbing, and water heater last replaced?
- Why hasn't it sold? Are there any deal-killer items the seller is aware of (foundation, flood, title, zoning, code violations)?
- Is there a deadline driving the sale (1031 exchange, divorce, estate, relocation)? That informs how much negotiation room exists.
- What's the average days-on-market for RENTAL listings here right now (not sales)? A rising rental-DOM trend means longer vacancies and softer asking-rent achievability than the comps imply.
- What's the recent tenant-quality profile in this submarket — average credit score on applications, eviction rate, late-payment / NSF rate, and stable-employment percentage? A property-management company in the area should have these aggregated.
- How much new for-sale + rental construction is in the pipeline within 1–3 miles? Heavy new supply typically softens prices + rents 12–24 months out; constrained supply supports both.
Investment metrics
- 1% rule
- 1.24% ✓
- Cap rate
- 9.68%
- Cash-on-cash
- 12.09%
- DSCR
- 1.54
- GRM
- 6.7
CMA / ARV
- ARV (median comp)
- $175,114
- List price
- $109,900
- Delta
- -37.24%
- Verdict
- UNDERPRICED
- Comps
- 5 within 1.0 mi
Show comp detail 1 sale within ~0.75 mi
| Address | Dist | Beds/Ba | Sqft | Sold | Price | $/sf | Match |
|---|---|---|---|---|---|---|---|
| 124 Kings Hwy | 0.30mi | 3/1.0 | 1,080 (-15%) | 22mo | $129,400 | $120 | 43 |
Match score weights: distance 35% · size 25% · config 20% · recency 20%. Top-matched comps best support the ARV.
Projected returns pro-forma
2.18% appreciation · 3.0% rent growth · sell at horizon
- IRR
- 16.9%
- Equity multiple
- 1.92×
- Total profit
- $28,290
- Equity at exit
- $44,397
- IRR
- 19.1%
- Equity multiple
- 3.57×
- Total profit
- $79,156
- Equity at exit
- $64,748
Cash invested: $30,772 (down + closing). Projections, not guarantees.
Landlord ↔ Tenant lean methodology
- Overall (STATE)
- 62 Landlord-Friendly
- State Pennsylvania
- 62 Landlord-Friendly · EVEN
- County
- — inherits STATE
- City
- — inherits STATE
ZIP-level market 16301
- Home prices YoY
- 1.0%
- Active inventory
- 53
- Price-to-rent
- 6.7×
Monthly cashflow live
- Estimated rent
- $1,359 medium interval (Pro) →
- Mortgage (P&I)
- −$576
- Tax from tax record
- −$141 /mo · $1,697/yr
- Insurance
- −$46
- HOA
- −$0
- Vacancy / Maint / Mgmt
- −$285
- Net cashflow
- $310
Break-even live
UW: 25.0% down · 7.5% · 30yr · 1.5% tax · 5.0% vac · 8.0% maint · 8.0% mgmt
Financing live
Cash to close
- Down payment
- $27,475
- Closing costs
- $3,297
- Reserves months
- —
- Total cash needed
- —
Loan-product check · same deal, 3 products live
Conventional
25% down · 7.5% · 30yr
- Down + closing
- —
- Monthly P&I
- —
- Monthly cashflow
- —
- DSCR
- —
- Eligible?
- —
Personal DTI + credit; lowest rate.
DSCR
20% down · 8.5% · 30yr
- Down + closing
- —
- Monthly P&I
- —
- Monthly cashflow
- —
- DSCR
- —
- Eligible?
- —
No personal income docs; deal must DSCR.
Hard money
10% down · 12.0% · 12mo
- Down + closing
- —
- Monthly P&I
- —
- Monthly cashflow
- —
- DSCR
- —
- Eligible?
- —
Short-term bridge; refi at stabilization.
Listing history 27 events
-
2026-06-18days on market $109,900 Active 384 DOM
-
2026-06-17days on market $109,900 Active 383 DOM
-
2026-06-16days on market $109,900 Active 382 DOM
-
2026-06-15days on market $109,900 Active 381 DOM
-
2026-06-13days on market $109,900 Active 379 DOM
-
2026-06-12days on market $109,900 Active 378 DOM
-
2026-06-09days on market $109,900 Active 375 DOM
-
2026-06-08days on market $109,900 Active 374 DOM
-
2026-06-08days on market $109,900 Active 373 DOM
-
2026-06-07days on market $109,900 Active 372 DOM
-
2026-06-04days on market $109,900 Active 369 DOM
-
2026-06-02days on market $109,900 Active 368 DOM
-
2026-06-01days on market $109,900 Active 367 DOM
-
2026-05-31days on market $109,900 Active 366 DOM
-
2026-04-27price $109,900 247-char remark
Show marketing remark (247 chars)
Cape Cod Home on 2.3 Acres in Cranberry Township , Venango County. Home has 3 Bedrooms and 1.5 Baths with attached 2 Car garage. Property is being SOLD AS IS AND NO WARRANTY! All Offers must be submitted via PropOffers.com web-site by the Realtor.
-
2025-11-25price $122,500 247-char remark
Show marketing remark (247 chars)
Cape Cod Home on 2.3 Acres in Cranberry Township , Venango County. Home has 3 Bedrooms and 1.5 Baths with attached 2 Car garage. Property is being SOLD AS IS AND NO WARRANTY! All Offers must be submitted via PropOffers.com web-site by the Realtor.
-
2025-06-10price $139,900 247-char remark
Show marketing remark (247 chars)
Cape Cod Home on 2.3 Acres in Cranberry Township , Venango County. Home has 3 Bedrooms and 1.5 Baths with attached 2 Car garage. Property is being SOLD AS IS AND NO WARRANTY! All Offers must be submitted via PropOffers.com web-site by the Realtor.
-
2025-05-31$149,900 Active 247-char remark
Show marketing remark (247 chars)
Cape Cod Home on 2.3 Acres in Cranberry Township , Venango County. Home has 3 Bedrooms and 1.5 Baths with attached 2 Car garage. Property is being SOLD AS IS AND NO WARRANTY! All Offers must be submitted via PropOffers.com web-site by the Realtor.
-
2025-02-17price $149,900 241-char remark
Show marketing remark (241 chars)
Adorable, fully updated Cape Cod on a fantastic 2+ acre lot. Enjoy the serene surroundings from the extra-large deck off the rear. Home features a large eat-in kitchen, main floor laundry, stone fireplace in the living room and so much more!
-
2024-10-21$164,900 Active 241-char remark
Show marketing remark (241 chars)
Adorable, fully updated Cape Cod on a fantastic 2+ acre lot. Enjoy the serene surroundings from the extra-large deck off the rear. Home features a large eat-in kitchen, main floor laundry, stone fireplace in the living room and so much more!
-
2024-08-14historical Expired
-
2024-07-26price $164,900
-
2024-01-09price $175,000
-
2023-12-13price $185,000
-
2023-08-15$209,900 Active
-
2007-10-17soldstatus $85,000
-
2007-10-17soldstatus $85,000
ⓘ Source: listings_history table (triggers on properties + properties_extension) + one-shot
backfill from property_details.listing_events for pre-trigger history.
Tax reassessment forecast PA · Partial reset (capped growth)
- Current annual tax
- $1,697 · $141/mo
- Projected year-2 tax
- $1,717 · $143/mo
- Expected delta
- +$20/yr (+$2/mo · 1.2%)
ⓘ Screening estimate from a state-policy table — verify with the county assessor before closing.
Climate risk First Street
- Flood 1/10 Low FEMA zone X (unshaded) · 0% chance over 30 yrs
- Wildfire 3/10 Moderate
- Heat 2/10 Low 7 d/yr ≥92°F today · 18 d/yr by 30 yrs out
- Wind 1/10 Low
- Air quality 2/10 Low 1 unhealthy d/yr today · 2 by 30 yrs out
Nearby sold comps map
Loading sold comps map…
Walkable amenities ~0.75 mi
Loading nearby amenities…
Taxation est. · year 1
- Rental income
- $16,307
- − Mortgage interest
- −$6,156
- − Property taxes
- −$1,697
- − Insurance
- −$550
- − Repairs & maintenance
- −$1,305
- − Management
- −$1,305
- − Depreciation
- −$3,197
- Taxable income
- $2,098
- Est. tax owed @ 24.0%
- −$504
- After-tax cash flow
- $3,217/yr
For passive investors: Depreciation is non-cash, so a rental often shows a tax loss while cash-flowing — sheltering income. Rental losses are passive: they offset passive income freely, and up to $25,000/yr can offset ordinary (W-2) income if you actively participate and your MAGI is under $100k (phasing out to $0 by $150k); unused losses carry forward. On sale, claimed depreciation is recaptured at up to 25%, and gains may owe capital-gains tax (a 1031 exchange can defer both). Figures are a year-1 estimate at your 24.0% rate — not tax advice; consult a CPA.
Schools (NCES district)
- District
- Cranberry Area SD
- NCES district ID
- 4207050
- Math proficiency
- 32% ▼ -17.00%
- Reading proficiency
- 52% ▼ -14.00%
- Median HH income
- $47,410
- Composite
- 35.82/100
- National rank
- #4827
- State rank
- #327 of 539 in PA
Livability — Cranberry
No livability data for this city. (Only ~50 U.S. cities are tracked.)
Census & demographics
- Population (ZIP)
- 15,067
Population outlook (Venango County) Hauer SSP2
- Today (2025)
- 48,827 people
- By 2030
- 46,061 · -5.7%
- By 2040
- 39,989 · -18.1%
- By 2050
- 34,094 · -30.2%
- By 2075
- 22,500 · -53.9%
- By 2100
- 13,659 · -72.0%
Race, ethnicity, and origin ACS 2023
- Neighborhood character
- Predominantly White (93%)
- Race & ethnicity
- White 93% Two or more races 4% Hispanic / Latino 1%
- Common ancestry
- Romanian 7% Iranian 3% Italian 2%
- Foreign-born
- 1%
Political lean MEDSL · Venango
- 2024 margin
- Solid R (+42.1) · D 28.5% · R 70.6%
- 2008→2024 swing
- -22.9pp toward R · 2008: -19.2pp · 2024: -42.1pp
- All cycles
- 2024: R+42.1 2020: R+41.4 2016: R+42.4 2012: R+26.3 2008: R+19.2
Not yet ingested
- Civics
- —
Market trends
- HPI YoY
- ▲ 2.18%
- Current HPI
- 218.0124
- Rent YoY
- —
- Metro
- —
- State GDP YoY
- ▲ 1.68%
- F500 in state
- 34
Industry mix (Fortune 500 HQ in PA)
| Industry | F500 HQs | Revenue |
|---|---|---|
| Healthcare | 2 | $309B |
|
||
| Insurance | 2 | $27B |
|
||
| Telecommunications / Media | 1 | $124B |
|
||
| Industrial Distribution | 1 | $22B |
|
||
| Financial Services | 1 | $20B |
|
||
| Chemicals / Materials | 1 | $18B |
|
||
Price history
+29.3% since first listed13 events — show timeline
- 2026-04-27 Price Changed $109,900 AVBREALTORS
- 2025-11-25 Price Changed $122,500 AVBREALTORS
- 2025-06-10 Price Changed $139,900 AVBREALTORS
- 2025-05-31 Listed $149,900 AVBREALTORS
- 2025-02-17 Price Changed $149,900 West Penn MLS
- 2024-10-21 Listed $164,900 West Penn MLS
- 2024-08-14 Delisted — West Penn MLS
- 2024-07-26 Price Changed $164,900 West Penn MLS
- 2024-01-09 Price Changed $175,000 West Penn MLS
- 2023-12-13 Price Changed $185,000 West Penn MLS
- 2023-08-15 Listed $209,900 West Penn MLS
- 2007-10-17 Sold (Public Records) $85,000 Public Records
- 2007-10-17 Sold (MLS) $85,000 AVBREALTORS
Property tax history
+1.1%/yrLatest (2026): $1,697 · +1.5% YoY. Source: county tax records.
Cash-flow waterfall
monthlySold comps — $/sqft
last 12 mo · ≤1 miLoading sold comps…