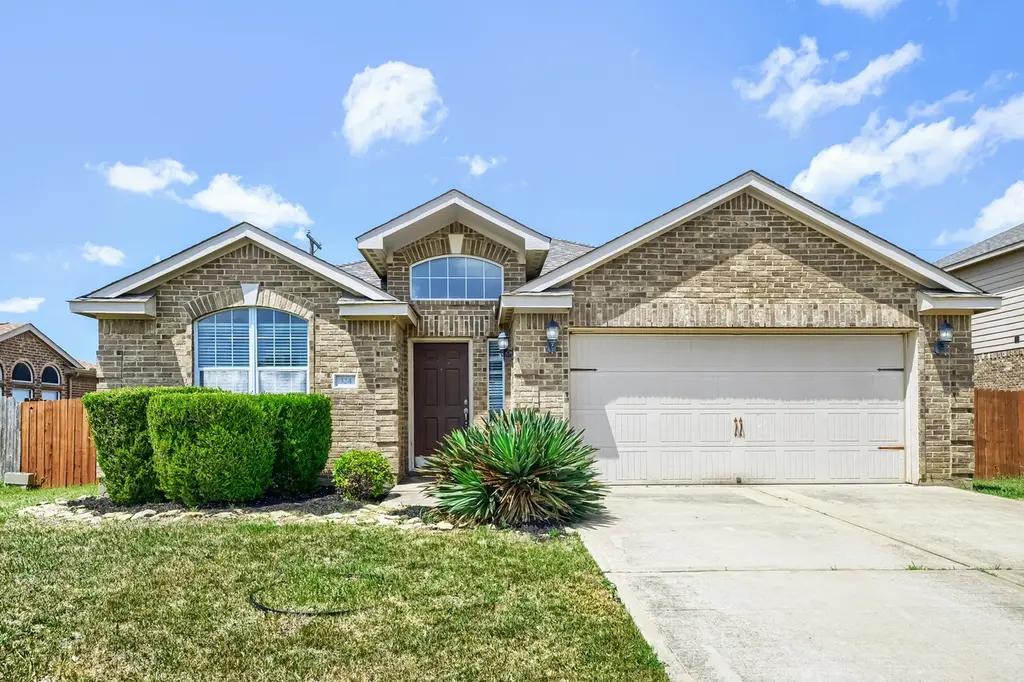
324 Meadow View Ln · Anna, TX
Flood risk 1/10 · Minimal
- FEMA flood zone
- X (unshaded)
- Chance of flooding over 30 yrs
- 0.0%
- Est. flood insurance / yr
- $507 – $1,088
Fire risk 6/10 · Moderate
- Est. fire insurance / yr
- $1,222 – $2,270
Heat risk 7/10 · Major
- Hot days now (above 110°F)
- 7 days/yr
- Hot days in 30 yrs
- 22 days/yr
Wind risk 6/10 · Moderate
- Chance of severe wind over 30 yrs
- 27.0%
Air-quality risk 3/10 · Minor
- Unhealthy air days now
- 2 days/yr
- Unhealthy air days in 30 yrs
- 3 days/yr
Risk factors via First Street. Map © Google.
Why this score? — see what drove the D- grade
The composite is a weighted blend of 9 inputs, each scored 0–100. Each bar is that input's sub-score; the figure is the points it added to the 100-point composite (weight × sub-score).
- ARV discount +14.1/15.0
- Cash flow +8.0/30.0
- Schools +3.8/10.0
- Livability +3.8/5.0
- 1% rule +3.3/10.0
- Condition / age +2.5/5.0
- DSCR +2.1/10.0
- Rent growth +2.0/5.0
- Appreciation +0.0/10.0
$255,000
🖨 Deal sheet 📄 Offer letter ✓ Due diligence
Listing remarks
Charming new property listing located at 324 Meadow View Ln in Anna. This 1,467 sq. ft. single-story brick home features three bedrooms and two bathrooms. The interior offers a spacious living area that opens directly into an eat-in kitchen, providing a functional and seamless layout for everyday living. Additionally, the property boasts a large fenced backyard complete with a covered patio, making it an ideal space for both relaxation and entertaining.
Key facts
- Spacious living area
- Covered patio
- Eat-in kitchen
Tags
Property features AI
Finance
- Financial info: Lease not considered
Exterior
- Parking: Attached 2-car garage with garage door opener
- Utilities: Public water; Public sewer
- Home design: Residential property; Entry level: First floor
- Construction: Brick construction; Built in 2012; Composition roof; Slab foundation
- Exterior features: Covered patio; Patio; Deck
Interior
- Kitchen: Dishwasher; Disposal; Microwave
- Bedrooms: 3 bedrooms (all on the first level)
- Flooring: Carpet; Tile
- Bathrooms: 2 full bathrooms
- Heating & cooling: Central heating (electric); Central air (electric)
- Interior features: Separate shower; Window treatments / coverings; Ceiling fan(s)
- Laundry & utility: Washer hookup; Electric dryer hookup
Neighborhood map
What this means for you Summary
Snapshot
- This is a 3-bed/2.0-bath single-family listed at $255k.
Deal economics
- At list price, monthly cash flow is $-257 ($-3k/yr) — negative.
- To cash-flow at today's rent, offer at most $210k (17.8% below list).
- To meet the 1% rule (rent ≥ 1% of price), the offer needs to be $211k (17.1% below list).
- Recommended offer: $210k (17.8% below list) — sets the bar for cash-flow.
- Cap rate 5.1% vs local median 3.6% in Anna — top-decile yield for the area; either an underpriced asset or a hidden risk that comps aren't pricing in. Stress-test before assuming the spread holds.
Location & tenants
- Location reads 75/100 on livability (#127 in TX, #3,880 nationally) — a middle-class / working-renter tenant base. Strengths: employment A+, housing A+, crime A; Watch: amenities F, commute F.
- Anna ISD (rural): math 44% / reading 41% proficiency, ranked #271 of 826 in TX (top 33%) — families likely to look elsewhere, expect single-tenant / working-renter base with shorter leases.
- Zoned schools: Joe K Bryant El (math 45% / reading 38%, grade F, #1,437 of 4,322 statewide, top 34%, 626 students, 53% FRL); Anna Middle (math 39% / reading 37%, grade F, #717 of 1,662 statewide, top 44%, 1,089 students, 51% FRL).
- Market conditions: Rents soft (-1.9%/yr); 1199 active listings in the ZIP; 40 comparable units currently listed for rent nearby; rentals at typical pace (median 21d on market — plan ~3-4 weeks tenant-placement turnaround); solid renter incomes; 19,194 units permitted in Collin County in 2024 (3,988 in 5+ unit buildings).
Forward outlook
- Local home prices are declining (-3.0%/yr); year-one equity from $2k of loan paydown is wiped out by about $8k of value loss. Plan a longer hold.
- Collin County population projected at +60% by 2050 — long-run rental-demand tailwind backs the buy-and-hold thesis.
Negotiation context
- It's been on market 37 days — a 3% lower offer ($247k) is reasonable based on typical stale-listing flexibility.
Risks & watch-outs
- Climate carrying-cost: major wind risk, 27% chance of damaging wind over 30y; major wildfire risk; extreme-heat days projected 7→22/yr by 2055 (HVAC capex compounding) — expect insurance premiums to compound above CPI over the hold.
Questions for the listing agent
- What do current leases actually rent for vs. the listed asking? Can we see a recent rent roll and the last 12 months of T-12 income?
- It's been on market 37 days. Have you received any prior offers? Is the seller open to a 18% concession, seller financing, or rate buy-down credit?
- Is there a deadline driving the sale (1031 exchange, divorce, estate, relocation)? That informs how much negotiation room exists.
- Schools are B-rated — typically a magnet for longer-tenancy family renters. What's the average tenant stay here, and is there a school-zone premium baked into asking?
- The area grade is low — what's the realistic commute time and amenity access for the typical tenant pool here? Any planned neighborhood developments (good or bad) we should know about?
- What's the average days-on-market for RENTAL listings here right now (not sales)? A rising rental-DOM trend means longer vacancies and softer asking-rent achievability than the comps imply.
- What's the recent tenant-quality profile in this submarket — average credit score on applications, eviction rate, late-payment / NSF rate, and stable-employment percentage? A property-management company in the area should have these aggregated.
- How much new for-sale + rental construction is in the pipeline within 1–3 miles? Heavy new supply typically softens prices + rents 12–24 months out; constrained supply supports both.
Investment metrics
- 1% rule
- 0.83% ✗
- Cap rate
- 5.08%
- Cash-on-cash
- -4.31%
- DSCR
- 0.81
- GRM
- 10.1
CMA / ARV
- ARV (median comp)
- $299,141
- List price
- $255,000
- Delta
- -14.76%
- Verdict
- UNDERPRICED
- Comps
- 20 within 1.0 mi
Show comp detail 12 sales within ~0.75 mi
| Address | Dist | Beds/Ba | Sqft | Sold | Price | $/sf | Match |
|---|---|---|---|---|---|---|---|
| 216 Meadow Ridge Dr | 0.17mi | 3/2.0 | 1,481 (+1%) | 2mo | $264,900 | $179 | 89 |
| 2809 Mitchell Ln | 0.44mi | 3/2.0 | 1,479 (+1%) | 4mo | $219,900 | $149 | 75 |
| 2509 Margaret Ln | 0.31mi | 3/2.0 | 1,601 (+9%) | 3mo | $239,500 | $150 | 68 |
| 209 Emma Dr | 0.25mi | 3/2.0 | 1,647 (+12%) | 4mo | $275,000 | $167 | 64 |
| 117 Tennyson St | 0.40mi | 4/2.0 (+1) | 1,621 (+10%) | 3mo | $280,000 | $173 | 57 |
| 1020 Calhoun Dr | 0.47mi | 3/2.0 | 1,647 (+12%) | 2mo | $298,000 | $181 | 56 |
| 2410 Lupton St | 0.63mi | 4/2.0 (+1) | 1,587 (+8%) | 0mo | $285,000 | $180 | 52 |
| 106 Magnolia St | 0.48mi | 3/2.0 | 1,288 (-12%) | 7mo | $259,000 | $201 | 51 |
| 132 Bowen St | 0.72mi | 3/2.0 | 1,619 (+10%) | 1mo | $287,400 | $178 | 48 |
| 209 Oriole Dr | 0.52mi | 4/2.0 (+1) | 1,663 (+13%) | 3mo | $280,000 | $168 | 46 |
| 106 Aaron St | 0.55mi | 4/2.0 (+1) | 1,656 (+13%) | 8mo | $290,000 | $175 | 41 |
| 145 Collin St | 0.71mi | 4/2.0 (+1) | 1,656 (+13%) | 5mo | $279,000 | $168 | 36 |
Match score weights: distance 35% · size 25% · config 20% · recency 20%. Top-matched comps best support the ARV.
Projected returns pro-forma
-3.0% appreciation · 0.0% rent growth · sell at horizon
- IRR
- -27.3%
- Equity multiple
- 0.11×
- Total profit
- $-63,731
- Equity at exit
- $38,021
- IRR
- -43.3%
- Equity multiple
- -0.40×
- Total profit
- $-99,941
- Equity at exit
- $22,048
Cash invested: $71,400 (down + closing). Projections, not guarantees.
Landlord ↔ Tenant lean methodology
- Overall (STATE)
- 87 Strongly Landlord-Friendly
- State Texas
- 87 Strongly Landlord-Friendly · R+5
- County
- — inherits STATE
- City
- — inherits STATE
ZIP-level market 75409
- Home prices YoY
- -20.1%
- Rents YoY
- -1.9%
- Active inventory
- 1199
- Price-to-rent
- 10.1×
Monthly cashflow live
- Estimated rent
- $2,113 high interval (Pro) →
- Mortgage (P&I)
- −$1,337
- Tax from tax record
- −$482 /mo · $5,787/yr
- Insurance
- −$106
- HOA
- −$0
- Vacancy / Maint / Mgmt
- −$444
- Net cashflow
- $-257
Break-even live
UW: 25.0% down · 7.5% · 30yr · 1.5% tax · 5.0% vac · 8.0% maint · 8.0% mgmt
Financing live
Cash to close
- Down payment
- $63,750
- Closing costs
- $7,650
- Reserves months
- —
- Total cash needed
- —
Loan-product check · same deal, 3 products live
Conventional
25% down · 7.5% · 30yr
- Down + closing
- —
- Monthly P&I
- —
- Monthly cashflow
- —
- DSCR
- —
- Eligible?
- —
Personal DTI + credit; lowest rate.
DSCR
20% down · 8.5% · 30yr
- Down + closing
- —
- Monthly P&I
- —
- Monthly cashflow
- —
- DSCR
- —
- Eligible?
- —
No personal income docs; deal must DSCR.
Hard money
10% down · 12.0% · 12mo
- Down + closing
- —
- Monthly P&I
- —
- Monthly cashflow
- —
- DSCR
- —
- Eligible?
- —
Short-term bridge; refi at stabilization.
Rent comps 40 comps
| Address | Beds | Baths | Sqft | Rent | $/sqft | DOM | Units | Dist |
|---|---|---|---|---|---|---|---|---|
| 317 Meadow View Ln Anna, TX | 4.0 | 2.0 | 1684 | $2,000 | $1.19 | 44d | 1 | 0.04mi |
| 216 Meadow Ridge Dr Anna, TX | 3.0 | 2.0 | 1481 | $1,875 | $1.27 | 44d | 1 | 0.16mi |
| 209 Meadow View Ln Anna, TX | 3.0 | 2.0 | 1651 | $2,100 | $1.27 | 24d | 1 | 0.18mi |
| 216 Emma Dr Anna, TX | 4.0 | 2.0 | 1811 | $2,000 | $1.10 | 44d | 1 | 0.20mi |
| 2108 Erlinda Dr Anna, TX | 3.0 | 2.0 | 1637 | $1,950 | $1.19 | 24d | 1 | 0.20mi |
| 2020 Jeanine Dr Anna, TX | 4.0 | 2.0 | 1811 | $1,895 | $1.05 | 2d | 1 | 0.22mi |
| 2012 Erlinda Dr Anna, TX | 4.0 | 2.0 | 1811 | $1,950 | $1.08 | 2d | 1 | 0.26mi |
| 104 Meadow View Ln Anna, TX | 3.0 | 2.0 | 1402 | $1,899 | $1.35 | 6d | 1 | 0.26mi |
| 613 Emerson Dr Anna, TX | 4.0 | 2.0 | 1801 | $2,050 | $1.14 | 24d | 1 | 0.28mi |
| 316 Zimmet Dr Anna, TX | 3.0 | 2.0 | 1649 | $2,095 | $1.27 | 5d | 1 | 0.32mi |
| 316 Zimmet Dr Anna, TX | 3.0 | 2.0 | 1649 | $2,095 | $1.27 | 7d | 1 | 0.32mi |
| 629 Harbor Oaks Dr Anna, TX | 3.0 | 2.0 | 1620 | $2,100 | $1.30 | 44d | 1 | 0.34mi |
| 2113 Emma Ct Anna, TX | 4.0 | 2.0 | 1801 | $2,100 | $1.17 | 24d | 1 | 0.34mi |
| 804 Emerson Dr Anna, TX | 3.0 | 2.0 | 1640 | $3,300 | $2.01 | 44d | 1 | 0.34mi |
| 313 Zimmet Dr Anna, TX | 3.0 | 2.0 | 1649 | $1,895 | $1.15 | 44d | 1 | 0.35mi |
| 2513 Melanie Dr Anna, TX | 4.0 | 2.0 | 1420 | $1,875 | $1.32 | 13d | 1 | 0.36mi |
| 1817 Atwood Dr Anna, TX | 4.0 | 2.0 | 1801 | $2,100 | $1.17 | 44d | 1 | 0.38mi |
| 112 Woodland St Anna, TX | 4.0 | 2.0 | 1587 | $2,149 | $1.35 | 3d | 1 | 0.39mi |
| 311 Charleston Dr Anna, TX | 3.0 | 2.0 | 1648 | $1,850 | $1.12 | 24d | 1 | 0.39mi |
| 1913 McKee Ct Anna, TX | 3.0 | 2.0 | 1620 | $1,999 | $1.23 | 24d | 1 | 0.42mi |
| 311 Olivia Ln Anna, TX | 3.0 | 2.0 | 1601 | $1,899 | $1.19 | 4d | 1 | 0.44mi |
| 909 Emerson Dr Anna, TX | 3.0 | 2.0 | 1647 | $2,085 | $1.27 | 13d | 1 | 0.44mi |
| 1020 Calhoun Dr Anna, TX | 3.0 | 2.0 | 1620 | $2,100 | $1.30 | 24d | 1 | 0.44mi |
| 925 Emerson Dr Anna, TX | 3.0 | 2.0 | 1647 | $2,050 | $1.24 | 24d | 1 | 0.46mi |
| 929 Emerson Dr Anna, TX | 3.0 | 2.0 | 1620 | $1,995 | $1.23 | 13d | 1 | 0.47mi |
| 2809 Mitchell Ln Anna, TX | 3.0 | 2.0 | 1479 | $2,100 | $1.42 | 1d | 1 | 0.47mi |
| 2713 Dustin Trl Anna, TX | 4.0 | 2.0 | 1658 | $2,100 | $1.27 | 1d | 1 | 0.48mi |
| 119 Magnolia St Anna, TX | 3.0 | 2.0 | 1511 | $1,900 | $1.26 | 7d | 1 | 0.48mi |
| 109 Magnolia St Anna, TX | 3.0 | 2.0 | 1510 | $1,985 | $1.31 | 2d | 1 | 0.48mi |
| 110 Magnolia St Anna, TX | 3.0 | 2.0 | 1284 | $1,800 | $1.40 | 3d | 1 | 0.51mi |
| 2406 Fall Ct Anna, TX | 4.0 | 2.0 | 1645 | $1,900 | $1.16 | 19d | 1 | 0.52mi |
| 231 Park Ave Anna, TX | 4.0 | 2.0 | 1645 | $2,150 | $1.31 | 17d | 1 | 0.53mi |
| 216 Mill St Anna, TX | 3.0 | 2.0 | 1597 | $1,850 | $1.16 | 17d | 1 | 0.59mi |
| 149 Lamont Rd Anna, TX | 4.0 | 2.0 | 1656 | $1,900 | $1.15 | 24d | 1 | 0.60mi |
| 204 Lamont Rd Anna, TX | 4.0 | 2.0 | 1678 | $1,950 | $1.16 | 44d | 1 | 0.64mi |
| 205 Briar Cv Anna, TX | 3.0 | 2.0 | 1459 | $1,825 | $1.25 | 24d | 1 | 0.72mi |
| 205 Briar Cv Anna, TX | 3.0 | 2.0 | 1429 | $1,825 | $1.28 | 7d | 1 | 0.72mi |
| 301 Indian Crk Anna, TX | 3.0 | 2.0 | 1635 | $1,695 | $1.04 | 44d | 1 | 0.73mi |
| 228 Ryan St Anna, TX | 3.0 | 2.0 | 1658 | $1,950 | $1.18 | 21d | 1 | 0.78mi |
| 125 Three Chimneys Ln Anna, TX | 3.0 | 2.0 | 1391 | $2,050 | $1.47 | 3d | 1 | 0.81mi |
Listing history 16 events
-
2026-06-18days on market $255,000 Active 37 DOM
-
2026-06-17days on market $255,000 Active 36 DOM
-
2026-06-16days on market $255,000 Active 35 DOM
-
2026-06-15days on market $255,000 Active 34 DOM
-
2026-06-13days on market $255,000 Active 32 DOM
-
2026-06-13pricedays on market $255,000 Active 31 DOM
-
2026-06-09days on market $270,000 Active 28 DOM
-
2026-06-08days on market $270,000 Active 27 DOM
-
2026-06-07days on market $270,000 Active 26 DOM
-
2026-06-04days on market $270,000 Active 23 DOM
-
2026-06-03days on market $270,000 Active 22 DOM
-
2026-06-02days on market $270,000 Active 21 DOM
-
2026-06-01days on market $270,000 Active 20 DOM
-
2026-05-31days on market $270,000 Active 19 DOM
-
2026-05-12$285,000 Active 457-char remark
-
2026-04-22soldstatus
ⓘ Source: listings_history table (triggers on properties + properties_extension) + one-shot
backfill from property_details.listing_events for pre-trigger history.
Tax reassessment forecast TX · Resets to sale price
- Current annual tax
- $5,787 · $482/mo
- Projected year-2 tax
- $5,787 · $482/mo
- Expected delta
- $0/yr ($0/mo · 0.0%)
ⓘ Screening estimate from a state-policy table — verify with the county assessor before closing.
Climate risk First Street
- Flood 1/10 Low FEMA zone X (unshaded) · 0% chance over 30 yrs
- Wildfire 6/10 Major
- Heat 7/10 Severe 7 d/yr ≥110°F today · 22 d/yr by 30 yrs out
- Wind 6/10 Major 27% chance of damaging wind over 30 yrs
- Air quality 3/10 Moderate 2 unhealthy d/yr today · 3 by 30 yrs out
Nearby sold comps map
Loading sold comps map…
Walkable amenities ~0.75 mi
Loading nearby amenities…
Taxation est. · year 1
- Rental income
- $25,352
- − Mortgage interest
- −$14,284
- − Property taxes
- −$5,787
- − Insurance
- −$1,275
- − Repairs & maintenance
- −$2,028
- − Management
- −$2,028
- − Depreciation
- −$7,418
- Taxable loss
- −$7,468
- Est. tax savings @ 24.0%
- +$1,792
- After-tax cash flow
- $-1,288/yr
For passive investors: Depreciation is non-cash, so a rental often shows a tax loss while cash-flowing — sheltering income. Rental losses are passive: they offset passive income freely, and up to $25,000/yr can offset ordinary (W-2) income if you actively participate and your MAGI is under $100k (phasing out to $0 by $150k); unused losses carry forward. On sale, claimed depreciation is recaptured at up to 25%, and gains may owe capital-gains tax (a 1031 exchange can defer both). Figures are a year-1 estimate at your 24.0% rate — not tax advice; consult a CPA.
Schools (NCES district)
- District
- Anna ISD
- NCES district ID
- 4808340
- Math proficiency
- 44% ▼ -9.00%
- Reading proficiency
- 41% ▼ -4.00%
- Median HH income
- $67,456
- Composite
- 38.26/100
- National rank
- #4241
- State rank
- #271 of 826 in TX
Livability — Anna
- Score
- 75/100
- State rank
- #127
- US rank
- #3880
Category grades
Schools grade is shown separately in the Schools card above.
Census & demographics
- Census place
- Anna, TX
- County
- Collin County · 1,159,394 people
- City population
- 27,131
- Metro
- Dallas-Fort Worth-Arlington, TX
- Population (ZIP)
- 27,131
- Household income
- $104,814
- Rent vs Own
- Severe rent burden
- 454.0
Population outlook (Collin County) Hauer SSP2
- Today (2025)
- 1,210,074 people
- By 2030
- 1,358,201 · +12.2%
- By 2040
- 1,654,061 · +36.7%
- By 2050
- 1,937,359 · +60.1%
- By 2075
- 2,567,039 · +112.1%
- By 2100
- 2,952,048 · +144.0%
Race, ethnicity, and origin ACS 2023
- Neighborhood character
- Diverse neighborhood (Simpson 0.56)
- Race & ethnicity
- White 61% Hispanic / Latino 20% Black 15% Two or more races 6% Asian 1%
- Hispanic origin (detail)
- Mexican 16% Puerto Rican 1%
- Common ancestry
- Italian 3% Lithuanian 2% Slovak 1%
- Foreign-born
- 10% · Canada
- Languages at home
- 79% English-only · Spanish 18% French/Haitian/Cajun 2%
Political lean MEDSL · Collin
- 2024 margin
- R (+11.1) · D 43.1% · R 54.3% · Other 2.6%
- 2008→2024 swing
- +14.4pp toward D · 2008: -25.6pp · 2024: -11.1pp
- All cycles
- 2024: R+11.1 2020: R+4.3 2016: R+17.0 2012: R+31.6 2008: R+25.6
Not yet ingested
- Civics
- —
Market trends
- HPI YoY
- ▼ -58.99%
- Current HPI
- 235.0945
- Rent YoY
- ▼ -1.92%
- Metro
- Dallas-Fort Worth-Arlington, TX
- State GDP YoY
- ▲ 3.95%
- F500 in state
- 110
Industry mix (Fortune 500 HQ in TX)
| Industry | F500 HQs | Revenue |
|---|---|---|
| Energy | 16 | $1,198B |
|
||
| Technology | 5 | $198B |
|
||
| Engineering / Construction | 4 | $72B |
|
||
| Energy Services | 3 | $60B |
|
||
| Utilities | 3 | $41B |
|
||
| Healthcare | 2 | $330B |
|
||
Price history
-10.5% since first listed4 events — show timeline
- 2026-06-12 Price Changed $255,000 HARMLS
- 2026-05-26 Price Changed $270,000 HARMLS
- 2026-05-12 Listed $285,000 HARMLS
- 2026-04-22 Sold (Public Records) — Public Records
Property tax history
+18.7%/yrLatest (2025): $5,787 · +6.5% YoY. Source: county tax records.
Cash-flow waterfall
monthlySold comps — $/sqft
last 12 mo · ≤1 miLoading sold comps…