200 Rector Pl Unit 6V · New York, NY
Flood risk 5/10 · Moderate
- FEMA flood zone
- X (shaded)
- Chance of flooding over 30 yrs
- 0.45%
- Est. flood insurance / yr
- $507 – $1,088
Fire risk 1/10 · Minimal
- Est. fire insurance / yr
- $691 – $1,283
Heat risk 6/10 · Moderate
- Hot days now (above 99°F)
- 7 days/yr
- Hot days in 30 yrs
- 15 days/yr
Wind risk 6/10 · Moderate
- Chance of severe wind over 30 yrs
- 27.0%
Air-quality risk 4/10 · Minor
- Unhealthy air days now
- 5 days/yr
- Unhealthy air days in 30 yrs
- 7 days/yr
Risk factors via First Street. Map © Google.
Why this score? — see what drove the D- grade
The composite is a weighted blend of 9 inputs, each scored 0–100. Each bar is that input's sub-score; the figure is the points it added to the 100-point composite (weight × sub-score).
- ARV discount +7.5/15.0
- Appreciation +7.2/10.0
- Cash flow +5.8/30.0
- Schools +5.0/10.0
- Livability +3.8/5.0
- Rent growth +3.5/5.0
- 1% rule +3.2/10.0
- Condition / age +2.5/5.0
- DSCR +0.1/10.0
$625,000
🖨 Deal sheet 📄 Offer letter ✓ Due diligence
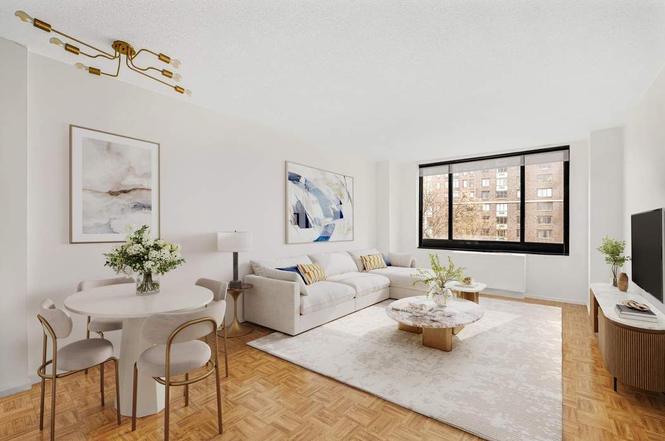
Listing remarks
REDUCED - BEST PRICED UNIT All showings are by appointment only; kindly contact the listng agent to schedule 1 hours in advance. Bright and tranquil, this 610 sq ft one-bedroom overlooks the treetops of Rector Park and enjoys abundant natural light throughout the day. The spacious living and dining area offers flexible layout options, while the pass-through kitchen features a breakfast bar and full-size appliances. The king-size bedroom provides ample room for a dedicated home-office area, complemented by three generous closets for excellent storage. Parquet wood floors run throughout, and the marble-tile bathroom offers clean, classic finishes. Monthly common charges include water, heat, a
Key facts
- Marble tile bathroom
- Park facing home
- Pass through kitchen
Tags
Property features AI
Finance
- HOA & community: Monthly association fee of $976; Pets allowed in building
Exterior
- Parking: Has garage
- Utilities: Indoor pool
- Home design: Condominium in a 44-story building; Entry level 6
- Construction: Building name: Liberty Court
- Exterior features: Building roof deck; North exposure; Has view
Interior
- Bedrooms: 3 total rooms (includes living areas and bedrooms)
- Bathrooms: 1 full bathroom
- Interior features: Unfurnished; Common on-floor laundry
- Laundry & utility: Common on-floor laundry
Neighborhood map
What this means for you Summary
Snapshot
- This is a 1-bed/1.0-bath condo listed at $625k.
Deal economics
- At list price, monthly cash flow is $-1k ($-15k/yr) — negative.
- To cash-flow at today's rent, offer at most $442k (29.2% below list).
- To meet the 1% rule (rent ≥ 1% of price), the offer needs to be $510k (18.3% below list).
- Recommended offer: $442k (29.2% below list) — sets the bar for cash-flow.
- Cap rate 3.9% vs local median 2.6% in New York — top-decile yield for the area; either an underpriced asset or a hidden risk that comps aren't pricing in. Stress-test before assuming the spread holds.
Location & tenants
- Location reads 75/100 on livability (#268 in NY, #4,188 nationally) — a middle-class / working-renter tenant base. Strengths: amenities A+, commute A+, health & safety A; Watch: crime F, cost of living F.
- Market conditions: Rents rising fast (+4.1%/yr); 92 active listings in the ZIP; 40 comparable units currently listed for rent nearby; rentals leasing fast (median 3d on market — plan ~1-2 weeks tenant-placement turnaround); high-income renter base; 4,467 units permitted in New York County in 2024 (4,463 in 5+ unit buildings).
Forward outlook
- In year one you build about $32k of equity ($4k loan paydown + $27k appreciation (4.4% local appreciation)).
- New York County population projected at +21% by 2050 — long-run rental-demand tailwind backs the buy-and-hold thesis.
- By year 2, paydown + projected appreciation supports a ~$51k cash-out refi (75% LTV) — recoverable capital for the next deal without selling this one.
Negotiation context
- It's been on market 99 days — a 9% lower offer ($569k) is reasonable based on typical stale-listing flexibility.
- Current owner paid $178k; list at $625k implies a 251% gain — meaningful room to come down on a strong offer.
Risks & watch-outs
- Climate carrying-cost: moderate flood risk; major wind risk, 27% chance of damaging wind over 30y; extreme-heat days projected 7→15/yr by 2055 (HVAC capex compounding) — expect insurance premiums to compound above CPI over the hold.
Questions for the listing agent
- What do current leases actually rent for vs. the listed asking? Can we see a recent rent roll and the last 12 months of T-12 income?
- It's been on market 99 days. Have you received any prior offers? Is the seller open to a 29% concession, seller financing, or rate buy-down credit?
- What does the HOA fee cover, when was the last increase, and are there any pending special assessments or reserve-fund shortfalls?
- Any open or pending special assessments — roof, HVAC, plumbing, elevator, façade? What's the per-unit balance and payoff schedule, and is the seller paying it off at close or rolling it to the buyer?
- Why hasn't it sold? Are there any deal-killer items the seller is aware of (foundation, flood, title, zoning, code violations)?
- Is there a deadline driving the sale (1031 exchange, divorce, estate, relocation)? That informs how much negotiation room exists.
- Schools are B-rated — typically a magnet for longer-tenancy family renters. What's the average tenant stay here, and is there a school-zone premium baked into asking?
- Crime grade is F in this area — have there been break-ins, vandalism, or insurance claims at this property in the last 3 years? What carrier currently insures it and at what premium?
- The area grade is low — what's the realistic commute time and amenity access for the typical tenant pool here? Any planned neighborhood developments (good or bad) we should know about?
- What's the average days-on-market for RENTAL listings here right now (not sales)? A rising rental-DOM trend means longer vacancies and softer asking-rent achievability than the comps imply.
- What's the recent tenant-quality profile in this submarket — average credit score on applications, eviction rate, late-payment / NSF rate, and stable-employment percentage? A property-management company in the area should have these aggregated.
- How much new apartment / multifamily construction is in the pipeline within 1–3 miles? Heavy new supply (>2% of stock underway) typically softens rents 12–24 months out; light construction supports rent growth.
Investment metrics
- 1% rule
- 0.82% ✗
- Cap rate
- 3.87%
- Cash-on-cash
- -8.66%
- DSCR
- 0.61
- GRM
- 10.2
CMA / ARV
No comps found within radius.
Projected returns pro-forma
4.39% appreciation · 4.12% rent growth · sell at horizon
- IRR
- 4.4%
- Equity multiple
- 1.28×
- Total profit
- $48,368
- Equity at exit
- $331,072
- IRR
- 7.7%
- Equity multiple
- 2.37×
- Total profit
- $240,117
- Equity at exit
- $553,135
Cash invested: $175,000 (down + closing). Projections, not guarantees.
Landlord ↔ Tenant lean methodology
- Overall (CITY)
- 0 Strongly Tenant-Friendly
- State New York
- 15 Strongly Tenant-Friendly · D+10
- County
- — inherits STATE
- City New York
- 0 Strongly Tenant-Friendly · D+34
ZIP-level market 10280
- Home prices YoY
- 1.7%
- Rents YoY
- 4.1%
- Active inventory
- 92
- Price-to-rent
- 10.2×
Monthly cashflow live
- Estimated rent
- $5,104 high interval (Pro) →
- Mortgage (P&I)
- −$3,278
- Tax est. 1.5%
- −$781 /mo · $9,375/yr
- Insurance
- −$260
- HOA
- −$976
- Vacancy / Maint / Mgmt
- −$1,072
- Net cashflow
- $-1,263
Break-even live
UW: 25.0% down · 7.5% · 30yr · 1.5% tax · 5.0% vac · 8.0% maint · 8.0% mgmt
Financing live
Cash to close
- Down payment
- $156,250
- Closing costs
- $18,750
- Reserves months
- —
- Total cash needed
- —
Loan-product check · same deal, 3 products live
Conventional
25% down · 7.5% · 30yr
- Down + closing
- —
- Monthly P&I
- —
- Monthly cashflow
- —
- DSCR
- —
- Eligible?
- —
Personal DTI + credit; lowest rate.
DSCR
20% down · 8.5% · 30yr
- Down + closing
- —
- Monthly P&I
- —
- Monthly cashflow
- —
- DSCR
- —
- Eligible?
- —
No personal income docs; deal must DSCR.
Hard money
10% down · 12.0% · 12mo
- Down + closing
- —
- Monthly P&I
- —
- Monthly cashflow
- —
- DSCR
- —
- Eligible?
- —
Short-term bridge; refi at stabilization.
Rent comps 40 comps
| Address | Beds | Baths | Sqft | Rent | $/sqft | DOM | Units | Dist |
|---|---|---|---|---|---|---|---|---|
| 1 West St #546 New York, NY | 1.0 | 1.0 | 700 | $5,770 | $8.24 | 20d | 1 | 0.19mi |
| 389 S End Ave New York, NY | 3.0 | 1.0–2.0 | 1080 | $6,685 | $6.19 | 1d | 36 | 0.24mi |
| 140 Broadway Unit 1298277P New York, NY | 1.0 | 1.0 | 699 | $9,406 | $13.46 | 22d | 1 | 0.36mi |
| 3 Hanover Sq New York, NY | 3.0 | 1.0–2.0 | 600 | $4,534 | $7.56 | 24d | 5 | 0.45mi |
| 63 Wall St #1971 New York, NY | — | 1.0 | 489 | $5,190 | $10.61 | 20d | 1 | 0.47mi |
| 67 Wall St #13 New York, NY | 1.0–2.0 | 1.0 | 636 | $5,750 | $9.03 | 2d | 2 | 0.48mi |
| 25 Water St Apt 706 New York, NY | — | 1.0 | 550 | $3,990 | $7.25 | 24d | 1 | 0.49mi |
| 25 Water St Unit 707 New York, NY | — | 1.0 | 550 | $3,950 | $7.18 | 24d | 1 | 0.49mi |
| 10 Hanover Sq New York, NY | 2.0 | 1.0–2.0 | 790 | $5,948 | $7.53 | 2d | 25 | 0.49mi |
| 75 Wall St New York, NY | 3.0 | 1.0–3.0 | 452 | $7,598 | $16.81 | 15d | 16 | 0.51mi |
| 75 Wall St Unit 251 New York, NY | 1.0 | 1.5 | 653 | $6,580 | $10.08 | 24d | 1 | 0.52mi |
| 95 Wall St New York, NY | 2.0 | 1.0–2.0 | 733 | $5,862 | $8.00 | 1d | 39 | 0.54mi |
| 180 Water St #537 New York, NY | 1.0–2.0 | 1.0–2.0 | 728 | $8,040 | $11.04 | 2d | 2 | 0.61mi |
| 400 Chambers St #587 New York, NY | 2.0 | 1.0–1.5 | 675 | $7,370 | $10.91 | 7d | 3 | 0.68mi |
| 105 Duane St #183 New York, NY | 2.0 | 1.0–2.0 | 821 | $9,000 | $10.96 | 1d | 3 | 0.79mi |
| 88 Leonard St New York, NY | 1.0 | 1.0 | 598 | $7,966 | $13.32 | 7d | 13 | 0.89mi |
| 111 Worth St New York, NY | 1.0–2.0 | 1.0–2.0 | 747 | $6,077 | $8.14 | 7d | 7 | 0.90mi |
| 77 Hudson St #2703 Jersey City, NJ | 1.0 | 1.0 | 744 | $4,950 | $6.65 | 24d | 1 | 1.04mi |
| 77 Hudson St #2203 Jersey City, NJ | 1.0 | 1.0 | 744 | $4,200 | $5.65 | 17d | 1 | 1.04mi |
| 77 Hudson St #1804 Jersey City, NJ | 1.0 | 1.0 | 750 | $4,100 | $5.47 | 20d | 1 | 1.04mi |
| 33 Hudson St Jersey City, NJ | 2.0 | 1.0–2.0 | 937 | $4,598 | $4.90 | 2d | 23 | 1.04mi |
| 70 Greene St Jersey City, NJ | 3.0 | 1.0–2.0 | 960 | $4,292 | $4.47 | 1d | 26 | 1.09mi |
| 1 Harborside Pl Jersey City, NJ | 1.0–2.0 | 1.0–2.0 | 1100 | $3,822 | $3.47 | 2d | 7 | 1.13mi |
| 120 Mulberry St Unit 1257050P New York, NY | 2.0 | 1.0 | 645 | $12,372 | $19.18 | 24d | 1 | 1.21mi |
| 155 Washington St Jersey City, NJ | 3.0 | 1.0–3.0 | 1545 | $3,445 | $2.23 | 1d | 8 | 1.21mi |
| 115 Morris St Jersey City, NJ | 1.0–3.0 | 1.0–2.0 | 1101 | $3,772 | $3.42 | 1d | 22 | 1.22mi |
| 200 Greene St Jersey City, NJ | 2.0 | 1.0 | 713 | $4,645 | $6.51 | 1d | 50 | 1.26mi |
| 15 Warren St Jersey City, NJ | 1.0–2.0 | 1.0–2.0 | 942 | $3,695 | $3.92 | 7d | 2 | 1.26mi |
| 65 Bay St Jersey City, NJ | 2.0 | 1.0–2.0 | 863 | $4,743 | $5.49 | 1d | 12 | 1.27mi |
| 100 Montgomery St Jersey City, NJ | 1.0 | 1.0 | 650 | $3,372 | $5.19 | 3d | 1 | 1.27mi |
| 20 2nd St Jersey City, NJ | 1.0–2.0 | 1.0–2.0 | 922 | $3,350 | $3.63 | 24d | 4 | 1.28mi |
| 120 York St Jersey City, NJ | 1.0–2.0 | 1.0–2.0 | 962 | $3,822 | $3.97 | 1d | 9 | 1.28mi |
| 131 Dudley St Jersey City, NJ | 1.0–2.0 | 1.0–2.0 | 1044 | $3,428 | $3.28 | 2d | 4 | 1.28mi |
| 107 Columbia Hts #1757 Brooklyn, NY | 1.0–2.0 | 1.0–2.0 | 708 | $5,710 | $8.06 | 1d | 2 | 1.28mi |
| 25 Columbus Dr Jersey City, NJ | 3.0 | 1.0–2.5 | 973 | $6,598 | $6.78 | 1d | 35 | 1.31mi |
| 142 Sussex St #3 Jersey City, NJ | 1.0 | 1.0 | 668 | $3,250 | $4.87 | 2d | 1 | 1.32mi |
| 1 2nd St Jersey City, NJ | 1.0–3.0 | 1.0–2.5 | 1032 | $3,150 | $3.05 | 12d | 5 | 1.33mi |
| 1 2nd St Jersey City, NJ | 1.0–3.0 | 1.0–2.5 | 1032 | $3,400 | $3.29 | 7d | 5 | 1.33mi |
| 255 Warren St Jersey City, NJ | 2.0 | 1.0–2.0 | 932 | $4,160 | $4.46 | 2d | 7 | 1.34mi |
| 198 Van Vorst St Jersey City, NJ | 2.0 | 1.0–2.0 | 932 | $3,488 | $3.74 | 1d | 6 | 1.34mi |
HOA detail condo
- Monthly dues
- $976 · $11,712/yr
- Likely covers
- water
- Assessments
- None detected in remarks — confirm with the listing agent.
Listing history 14 events
-
2026-06-18days on market $625,000 Active 99 DOM
-
2026-06-17days on market $625,000 Active 98 DOM
-
2026-06-15days on market $625,000 Active 96 DOM
-
2026-06-13days on market $625,000 Active 94 DOM
-
2026-06-10days on market $625,000 Active 90 DOM
-
2026-06-08days on market $625,000 Active 89 DOM
-
2026-06-08pricedays on market $625,000 Active 88 DOM
-
2026-06-04days on market $639,000 Active 85 DOM
-
2026-06-03days on market $639,000 Active 84 DOM
-
2026-06-01days on market $639,000 Active 82 DOM
-
2026-05-31days on market $639,000 Active 81 DOM
-
2026-03-11price $639,000
-
2026-03-11$650,000 Active
-
1988-11-15soldstatus $178,000
ⓘ Source: listings_history table (triggers on properties + properties_extension) + one-shot
backfill from property_details.listing_events for pre-trigger history.
Climate risk First Street
- Flood 5/10 Major FEMA zone X (shaded) · 45% chance over 30 yrs
- Wildfire 1/10 Low
- Heat 6/10 Major 7 d/yr ≥99°F today · 15 d/yr by 30 yrs out
- Wind 6/10 Major 27% chance of damaging wind over 30 yrs
- Air quality 4/10 Moderate 5 unhealthy d/yr today · 7 by 30 yrs out
Nearby sold comps map
Loading sold comps map…
Walkable amenities ~0.75 mi
Loading nearby amenities…
Taxation est. · year 1
- Rental income
- $61,245
- − Mortgage interest
- −$35,010
- − Property taxes
- −$9,375
- − Insurance
- −$3,125
- − Repairs & maintenance
- −$4,900
- − Management
- −$4,900
- − HOA
- −$11,712
- − Depreciation
- −$18,182
- Taxable loss
- −$25,957
- Est. tax savings @ 24.0%
- +$6,230
- After-tax cash flow
- $-8,929/yr
For passive investors: Depreciation is non-cash, so a rental often shows a tax loss while cash-flowing — sheltering income. Rental losses are passive: they offset passive income freely, and up to $25,000/yr can offset ordinary (W-2) income if you actively participate and your MAGI is under $100k (phasing out to $0 by $150k); unused losses carry forward. On sale, claimed depreciation is recaptured at up to 25%, and gains may owe capital-gains tax (a 1031 exchange can defer both). Figures are a year-1 estimate at your 24.0% rate — not tax advice; consult a CPA.
Schools (NCES district)
No district data.
Livability — New York
- Score
- 75/100
- State rank
- #268
- US rank
- #4188
Category grades
Schools grade is shown separately in the Schools card above.
Census & demographics
- Census place
- New York, NY
- County
- New York County · 1,599,927 people
- City population
- 7,731,280
- Metro
- New York-Newark-Jersey City, NY-NJ-PA
- Population (ZIP)
- 8,933
- Household income
- $206,299
- Rent vs Own
- Severe rent burden
- 609.0
Population outlook (New York County) Hauer SSP2
- Today (2025)
- 1,825,725 people
- By 2030
- 1,904,611 · +4.3%
- By 2040
- 2,052,719 · +12.4%
- By 2050
- 2,206,601 · +20.9%
- By 2075
- 2,509,427 · +37.4%
- By 2100
- 2,702,933 · +48.0%
Race, ethnicity, and origin ACS 2023
- Neighborhood character
- Diverse neighborhood (Simpson 0.59)
- Race & ethnicity
- White 57% Asian 28% Hispanic / Latino 12% Two or more races 5% Native American 2% Black 2%
- Hispanic origin (detail)
- Dominican 4%
- Common ancestry
- Romanian 4% Russian 3% Lithuanian 1%
- Foreign-born
- 32% · Canada, South Korea, China
- Languages at home
- 57% English-only · Other Indo-European 12% Chinese 12% Spanish 9%
Political lean MEDSL · New York
- 2024 margin
- Solid D (+64.8) · D 82.4% · R 17.6%
- 2008→2024 swing
- -7.4pp toward R · 2008: 72.2pp · 2024: 64.8pp
- All cycles
- 2024: D+64.8 2020: D+74.5 2016: D+77.2 2012: D+69.6 2008: D+72.2
Not yet ingested
- Civics
- —
Market trends
- HPI YoY
- ▲ 4.39%
- Current HPI
- 263.9143
- Rent YoY
- ▲ 4.12%
- Metro
- New York-Newark-Jersey City, NY-NJ-PA
- State GDP YoY
- ▲ 2.60%
- F500 in state
- 92
Industry mix (Fortune 500 HQ in NY)
| Industry | F500 HQs | Revenue |
|---|---|---|
| Financial Services | 10 | $950B |
|
||
| Consumer Goods | 9 | $162B |
|
||
| Insurance | 4 | $225B |
|
||
| Telecommunications | 2 | $144B |
|
||
| Pharmaceuticals | 2 | $112B |
|
||
| Media / Entertainment | 2 | $69B |
|
||
Price history
+259.0% since first listed3 events — show timeline
- 2026-03-11 Price Changed $639,000 RLS at REBNY
- 2026-03-11 Listed $650,000 RLS at REBNY
- 1988-11-15 Sold (Public Records) $178,000 Public Records
Cash-flow waterfall
monthlySold comps — $/sqft
last 12 mo · ≤1 miLoading sold comps…