29-31 Washburn Ave Unit 1B · Cambridge, MA
Flood risk 6/10 · Moderate
- FEMA flood zone
- X (unshaded)
- Chance of flooding over 30 yrs
- 0.69%
- Est. flood insurance / yr
- $507 – $1,088
Fire risk 1/10 · Minimal
- Est. fire insurance / yr
- $915 – $1,699
Heat risk 6/10 · Moderate
- Hot days now (above 96°F)
- 7 days/yr
- Hot days in 30 yrs
- 15 days/yr
Wind risk 6/10 · Moderate
- Chance of severe wind over 30 yrs
- 58.0%
Air-quality risk 3/10 · Minor
- Unhealthy air days now
- 3 days/yr
- Unhealthy air days in 30 yrs
- 3 days/yr
Risk factors via First Street. Map © Google.
Why this score? — see what drove the D+ grade
The composite is a weighted blend of 9 inputs, each scored 0–100. Each bar is that input's sub-score; the figure is the points it added to the 100-point composite (weight × sub-score).
- Cash flow +13.3/30.0
- ARV discount +7.5/15.0
- Appreciation +5.9/10.0
- Schools +4.6/10.0
- Livability +4.2/5.0
- 1% rule +4.0/10.0
- DSCR +4.0/10.0
- Condition / age +3.8/5.0
- Rent growth +2.5/5.0
$379,000
🖨 Deal sheet 📄 Offer letter ✓ Due diligence
Listing remarks
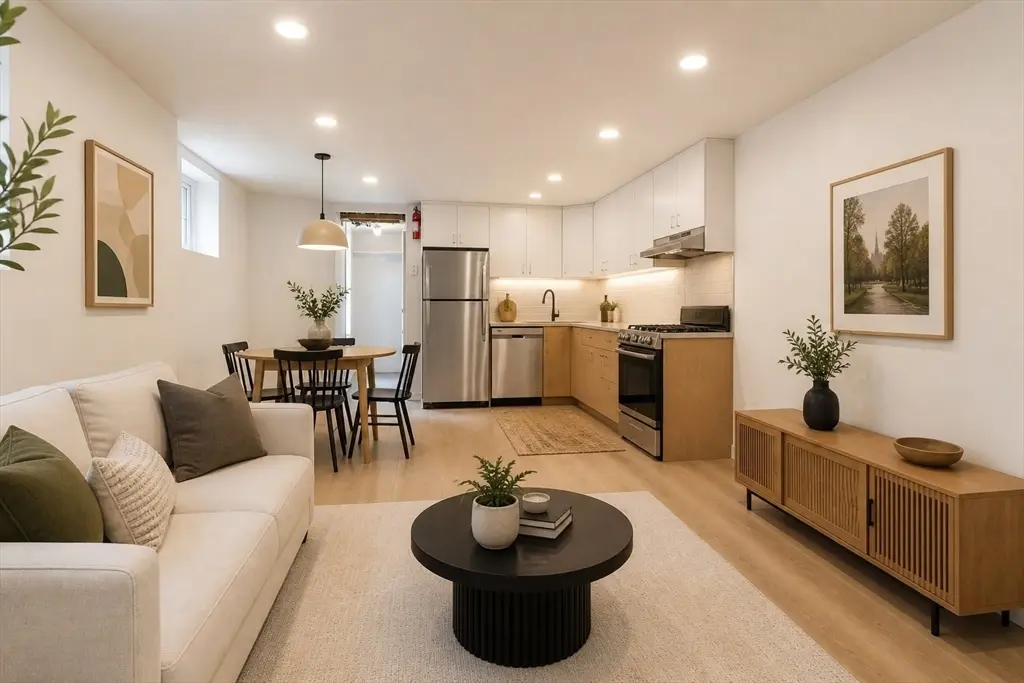
A rare opportunity to create something special in a desirable Cambridge setting. This 2-bed, 1-bath condo sits on the lower level of a converted multi-family building and offers an open living, kitchen, and dining area with two bedrooms—an ideal canvas for buyers looking to personalize their home. Select images have been virtually enhanced to illustrate potential design concepts. Conveniently located near Fresh Pond, Huron Village, Harvard and Porter Squares, public transit, and major roadways including Route 2, Memorial Drive, and Storrow Drive. Estate sale; seller has never occupied. Sold as-is. Buyer to perform due diligence.
Key facts
- Public transit
- Major roadways
- Near huron village
Tags
Property features AI
Finance
- HOA & community: Monthly association fee of $83 covering water, sewer and insurance
Exterior
- Parking: Open on-street parking available
- Utilities: Public water; Public sewer
- Home design: Condominium; Entry level: 1 (unit placement below grade); 4-story building; 2/3-family structure
- Construction: Approximate year built (per public records)
- Exterior features: On-street parking; Public transportation, shopping, walk/jog trails, medical facility, laundromat, bike path, conservation area, highway access, house of worship, public school, T‑station, university nearby; Pets allowed with restrictions
Interior
- Bedrooms: Unit is below grade (entry placement: below grade)
- Bathrooms: 1 full bathroom
- Heating & cooling: Electric baseboard heating
- Interior features: Total of 3 rooms
Neighborhood map
What this means for you Summary
Snapshot
- This is a 2-bed/1.0-bath condo listed at $379k. Condition is rated good.
Deal economics
- At list price, monthly cash flow is $0 ($-5/yr) — negative.
- To cash-flow at today's rent, offer at most $379k (0.0% below list).
- To meet the 1% rule (rent ≥ 1% of price), the offer needs to be $342k (9.8% below list).
- Recommended offer: $342k (9.8% below list) — sets the bar for 1% rule.
- Cap rate 6.3% vs local median 1.8% in Cambridge — top-decile yield for the area; either an underpriced asset or a hidden risk that comps aren't pricing in. Stress-test before assuming the spread holds.
Location & tenants
- Location reads 84/100 on livability (#15 in MA, #654 nationally) — a professional / high-income tenant draw. Strengths: schools A+, amenities A+, commute A+; Watch: crime F, cost of living F.
- Cambridge (urban): math 42% / reading 59% proficiency, ranked #117 of 302 in MA (top 39%) — acceptable for families but not a draw, mixed tenant base, ~2y average lease.
- Market conditions: 50 active listings in the ZIP; 40 comparable units currently listed for rent nearby; rentals at typical pace (median 25d on market — plan ~3-4 weeks tenant-placement turnaround); 45% of comp listings sitting > 30 days — soft ceiling on asking rent; 3,670 units permitted in Middlesex County in 2024 (2,611 in 5+ unit buildings).
Forward outlook
- In year one you build about $9k of equity ($3k loan paydown + $6k appreciation (1.7% local appreciation)).
- Middlesex County population projected at +20% by 2050 — long-run rental-demand tailwind backs the buy-and-hold thesis.
- At projected returns (1.7% appreciation + 3.0% rent growth), your $106k cash investment doubles in ~9 years — after that, you're playing with house money.
- By year 4, paydown + projected appreciation supports a ~$32k cash-out refi (75% LTV) — recoverable capital for the next deal without selling this one.
Negotiation context
- It's been on market 42 days — a 3% lower offer ($368k) is reasonable based on typical stale-listing flexibility.
- 3 sale attempts; this cycle's ask has dropped $76k (17%) from the opening price — seller is motivated, your offer sets the floor, not the list.
Risks & watch-outs
- Watch-outs: built in 1916 — expect roof / HVAC / electrical / plumbing capex.
- Climate carrying-cost: major flood risk; major wind risk, 58% chance of damaging wind over 30y; extreme-heat days projected 7→15/yr by 2055 (HVAC capex compounding) — expect insurance premiums to compound above CPI over the hold.
Questions for the listing agent
- What do current leases actually rent for vs. the listed asking? Can we see a recent rent roll and the last 12 months of T-12 income?
- It's been on market 42 days. Have you received any prior offers? Is the seller open to a 10% concession, seller financing, or rate buy-down credit?
- Built in 1916 — when were the roof, HVAC, electrical panel, plumbing, and water heater last replaced?
- What does the HOA fee cover, when was the last increase, and are there any pending special assessments or reserve-fund shortfalls?
- Any open or pending special assessments — roof, HVAC, plumbing, elevator, façade? What's the per-unit balance and payoff schedule, and is the seller paying it off at close or rolling it to the buyer?
- Is there a deadline driving the sale (1031 exchange, divorce, estate, relocation)? That informs how much negotiation room exists.
- Schools are A-rated — typically a magnet for longer-tenancy family renters. What's the average tenant stay here, and is there a school-zone premium baked into asking?
- Crime grade is F in this area — have there been break-ins, vandalism, or insurance claims at this property in the last 3 years? What carrier currently insures it and at what premium?
- The area grade is low — what's the realistic commute time and amenity access for the typical tenant pool here? Any planned neighborhood developments (good or bad) we should know about?
- What's the average days-on-market for RENTAL listings here right now (not sales)? A rising rental-DOM trend means longer vacancies and softer asking-rent achievability than the comps imply.
- What's the recent tenant-quality profile in this submarket — average credit score on applications, eviction rate, late-payment / NSF rate, and stable-employment percentage? A property-management company in the area should have these aggregated.
- How much new apartment / multifamily construction is in the pipeline within 1–3 miles? Heavy new supply (>2% of stock underway) typically softens rents 12–24 months out; light construction supports rent growth.
Investment metrics
- 1% rule
- 0.90% ✗
- Cap rate
- 6.29%
- Cash-on-cash
- -0.00%
- DSCR
- 1.00
- GRM
- 9.2
CMA / ARV
- ARV (median comp)
- $810,914
- List price
- $379,000
- Delta
- -53.26%
- Verdict
- UNDERPRICED
- Comps
- 20 within 1.0 mi
Projected returns pro-forma
1.71% appreciation · 3.0% rent growth · sell at horizon
- IRR
- 3.7%
- Equity multiple
- 1.19×
- Total profit
- $20,556
- Equity at exit
- $143,632
- IRR
- 7.6%
- Equity multiple
- 2.00×
- Total profit
- $106,446
- Equity at exit
- $202,426
Cash invested: $106,120 (down + closing). Projections, not guarantees.
Landlord ↔ Tenant lean methodology
- Overall (STATE)
- 20 Strongly Tenant-Friendly
- State Massachusetts
- 20 Strongly Tenant-Friendly · D+15
- County
- — inherits STATE
- City
- — inherits STATE
ZIP-level market 01240
- Home prices YoY
- 0.6%
- Active inventory
- 50
- Price-to-rent
- 9.2×
Monthly cashflow live
- Estimated rent
- $3,420 high interval (Pro) →
- Mortgage (P&I)
- −$1,988
- Tax est. 1.5%
- −$474 /mo · $5,685/yr
- Insurance
- −$158
- HOA
- −$83
- Vacancy / Maint / Mgmt
- −$718
- Net cashflow
- $-0
Break-even live
UW: 25.0% down · 7.5% · 30yr · 1.5% tax · 5.0% vac · 8.0% maint · 8.0% mgmt
Financing live
Cash to close
- Down payment
- $94,750
- Closing costs
- $11,370
- Reserves months
- —
- Total cash needed
- —
Loan-product check · same deal, 3 products live
Conventional
25% down · 7.5% · 30yr
- Down + closing
- —
- Monthly P&I
- —
- Monthly cashflow
- —
- DSCR
- —
- Eligible?
- —
Personal DTI + credit; lowest rate.
DSCR
20% down · 8.5% · 30yr
- Down + closing
- —
- Monthly P&I
- —
- Monthly cashflow
- —
- DSCR
- —
- Eligible?
- —
No personal income docs; deal must DSCR.
Hard money
10% down · 12.0% · 12mo
- Down + closing
- —
- Monthly P&I
- —
- Monthly cashflow
- —
- DSCR
- —
- Eligible?
- —
Short-term bridge; refi at stabilization.
Rent comps 40 comps
| Address | Beds | Baths | Sqft | Rent | $/sqft | DOM | Units | Dist |
|---|---|---|---|---|---|---|---|---|
| 2456 Massachusetts Ave Cambridge, MA | 2.0 | 2.0 | 1040 | $4,300 | $4.13 | 22d | 1 | 0.12mi |
| 14 Malvern Ave Unit 14 Somerville, MA | 3.0 | 1.5 | 1030 | $4,000 | $3.88 | 44d | 1 | 0.13mi |
| 2440 Massachusetts Ave Cambridge, MA | 1.0–3.0 | 1.0–2.5 | 786 | $4,100 | $5.22 | 15d | 2 | 0.14mi |
| 2534 Massachusetts Ave Unit 2 Cambridge, MA | 2.0 | 1.0 | 800 | $2,900 | $3.62 | 18d | 1 | 0.14mi |
| 24 Cameron Ave #2 Cambridge, MA | 2.0 | 1.0 | 762 | $2,800 | $3.67 | 18d | 1 | 0.16mi |
| 97 Elmwood St Cambridge, MA | 1.0 | 1.0 | 594 | $3,500 | $5.89 | 44d | 1 | 0.18mi |
| 1 Whittemore Ave Cambridge, MA | 1.0–2.0 | 1.0–2.0 | 915 | $4,223 | $4.62 | 2d | 7 | 0.22mi |
| 52 Victoria St Somerville, MA | 3.0 | 1.0 | 1026 | $3,600 | $3.51 | 44d | 1 | 0.30mi |
| 1131 Broadway Somerville, MA | 2.0 | 1.0 | 700 | $3,000 | $4.29 | 44d | 1 | 0.31mi |
| 1060 Broadway #2 Somerville, MA | 1.0 | 1.0 | 769 | $3,150 | $4.10 | 44d | 1 | 0.34mi |
| 45 Waterhouse St Somerville, MA | 2.0 | 1.0 | 900 | $3,400 | $3.78 | 44d | 1 | 0.35mi |
| 46 Paulina St Somerville, MA | 1.0 | 1.0 | 900 | $3,200 | $3.56 | 44d | 1 | 0.35mi |
| 27 Meacham Rd Somerville, MA | 1.0 | 1.0 | 700 | $2,600 | $3.71 | 44d | 1 | 0.36mi |
| 55 Fairmount Ave Somerville, MA | 3.0 | 1.0 | 1000 | $3,750 | $3.75 | 5d | 1 | 0.38mi |
| 173 Rindge Ave Cambridge, MA | 3.0 | 1.0 | 950 | $3,875 | $4.08 | 22d | 1 | 0.43mi |
| 39 Day St Unit 22 Somerville, MA | 1.0 | 1.0 | 600 | $3,025 | $5.04 | 44d | 1 | 0.47mi |
| 21 Chandler St Apt 3 Somerville, MA | 2.0 | 1.0 | 800 | $3,700 | $4.62 | 11d | 1 | 0.48mi |
| 149 Powder House Blvd Somerville, MA | 3.0 | 1.0 | 1100 | $3,900 | $3.55 | 44d | 1 | 0.48mi |
| 149 Powder House Blvd Unit 1 Somerville, MA | 3.0 | 1.0 | 1100 | $3,900 | $3.55 | 5d | 1 | 0.48mi |
| 51 College Ave Unit 3 Somerville, MA | 2.0 | 1.0 | 850 | $3,500 | $4.12 | 4d | 1 | 0.53mi |
| 39 Magnolia St Arlington, MA | 2.0 | 1.0 | 1028 | $4,100 | $3.99 | 24d | 1 | 0.53mi |
| 69 Raymond Ave Somerville, MA | 2.0 | 1.0 | 800 | $3,000 | $3.75 | 24d | 1 | 0.54mi |
| 58 Conwell Ave #1 Somerville, MA | 2.0 | 2.0 | 971 | $3,800 | $3.91 | 44d | 1 | 0.56mi |
| 35 Whitfield Rd Unit 3 Somerville, MA | 2.0 | 1.0 | 750 | $3,200 | $4.27 | 18d | 1 | 0.56mi |
| 42 Rindge Ave Unit 2B Cambridge, MA | 1.0 | 1.0 | 650 | $2,500 | $3.85 | 8d | 1 | 0.57mi |
| 42 Rindge Ave Cambridge, MA | 1.0 | 1.0 | 650 | $2,650 | $4.08 | 44d | 1 | 0.57mi |
| 27 Conwell Ave Somerville, MA | 2.0 | 1.0 | 1100 | $3,000 | $2.73 | 44d | 1 | 0.57mi |
| 402 Highland Ave Somerville, MA | 2.0 | 1.0 | 800 | $3,550 | $4.44 | 5d | 1 | 0.59mi |
| 9 Fairfield St Cambridge, MA | 3.0 | 2.0 | 1100 | $3,750 | $3.41 | 24d | 1 | 0.59mi |
| 9 Fairfield St Cambridge, MA | 2.0 | 2.0 | 1100 | $3,600 | $3.27 | 3d | 1 | 0.59mi |
| 75 Varnum St Unit 75 Arlington, MA | 2.0 | 1.0 | 1114 | $3,250 | $2.92 | 18d | 1 | 0.61mi |
| 364 Rindge Ave Cambridge, MA | 1.0–3.0 | 1.0–1.5 | 1030 | $3,339 | $3.24 | 44d | 5 | 0.63mi |
| 40 Michael St Unit 4 Arlington, MA | 1.0 | 1.0 | 700 | $2,250 | $3.21 | 18d | 1 | 0.64mi |
| 59 Winslow Ave Somerville, MA | 2.0 | 1.0 | 805 | $3,800 | $4.72 | 44d | 1 | 0.65mi |
| 389 Highland Ave Somerville, MA | 2.0 | 1.0 | 800 | $3,100 | $3.88 | 44d | 1 | 0.65mi |
| 389 Highland Ave Somerville, MA | 2.0 | 1.0 | 800 | $3,100 | $3.88 | 15d | 1 | 0.65mi |
| 389 Highland Ave Unit 1 Somerville, MA | 2.0 | 1.0 | 800 | $3,100 | $3.88 | 5d | 1 | 0.65mi |
| 388 Highland Ave Somerville, MA | 1.0 | 1.0 | 800 | $2,700 | $3.38 | 44d | 1 | 0.65mi |
| 11 Cogswell Ave Cambridge, MA | 1.0 | 1.0 | 700 | $1,800 | $2.57 | 44d | 1 | 0.68mi |
| 66 Cleveland St Unit 1 Arlington, MA | 2.0 | 1.0 | 1100 | $2,800 | $2.55 | 5d | 1 | 0.68mi |
HOA detail condo
- Monthly dues
- $83 · $996/yr
- Assessments
- None detected in remarks — confirm with the listing agent.
Listing history 16 events
-
2026-06-18days on market $379,000 Active 42 DOM
-
2026-06-17days on market $379,000 Active 41 DOM
-
2026-06-16days on market $379,000 Active 40 DOM
-
2026-06-15statusdays on market $379,000 Active 39 DOM
-
2026-06-13days on market $379,000 Price Changed 37 DOM
-
2026-06-13pricestatusdays on market $379,000 Price Changed 36 DOM
-
2026-06-10status $399,000 Back On Market 33 DOM
-
2026-06-09days on market $399,000 Contingent 33 DOM
-
2026-06-08days on market $399,000 Contingent 32 DOM
-
2026-06-07statusdays on market $399,000 Contingent 31 DOM
-
2026-06-04days on market $399,000 Active 28 DOM
-
2026-06-03days on market $399,000 Active 27 DOM
-
2026-06-02days on market $399,000 Active 26 DOM
-
2026-06-01days on market $399,000 Active 25 DOM
-
2026-05-31days on market $399,000 Active 24 DOM
-
2026-05-07$455,000 New 642-char remark
ⓘ Source: listings_history table (triggers on properties + properties_extension) + one-shot
backfill from property_details.listing_events for pre-trigger history.
Climate risk First Street
- Flood 6/10 Major FEMA zone X (unshaded) · 69% chance over 30 yrs
- Wildfire 1/10 Low
- Heat 6/10 Major 7 d/yr ≥96°F today · 15 d/yr by 30 yrs out
- Wind 6/10 Major 58% chance of damaging wind over 30 yrs
- Air quality 3/10 Moderate 3 unhealthy d/yr today · 3 by 30 yrs out
Nearby sold comps map
Loading sold comps map…
Walkable amenities ~0.75 mi
Loading nearby amenities…
Taxation est. · year 1
- Rental income
- $41,039
- − Mortgage interest
- −$21,230
- − Property taxes
- −$5,685
- − Insurance
- −$1,895
- − Repairs & maintenance
- −$3,283
- − Management
- −$3,283
- − HOA
- −$996
- − Depreciation
- −$11,025
- Taxable loss
- −$6,358
- Est. tax savings @ 24.0%
- +$1,526
- After-tax cash flow
- $1,521/yr
For passive investors: Depreciation is non-cash, so a rental often shows a tax loss while cash-flowing — sheltering income. Rental losses are passive: they offset passive income freely, and up to $25,000/yr can offset ordinary (W-2) income if you actively participate and your MAGI is under $100k (phasing out to $0 by $150k); unused losses carry forward. On sale, claimed depreciation is recaptured at up to 25%, and gains may owe capital-gains tax (a 1031 exchange can defer both). Figures are a year-1 estimate at your 24.0% rate — not tax advice; consult a CPA.
Condition & rehab AI · 6 photos
This well-maintained, open-concept townhouse in a desirable location offers a blank canvas for personalization and is ready for a new owner to make it their own.
Value-add opportunities
- Both Painting the exterior — Enhances curb appeal and resale value.
- Both Landscaping improvements — Improves curb appeal and rental value.
- Both New flooring in kitchen and bathrooms — Enhances aesthetics and value for both buyers and renters.
Renovation cost estimate screening
Value-add ROI direction
- Both Painting the exterior — Enhances curb appeal and resale value. ↑
- Both Landscaping improvements — Improves curb appeal and rental value. ↑
- Both New flooring in kitchen and bathrooms — Enhances aesthetics and value for both buyers and renters. ↑
ⓘ Cost ranges are severity-bucket heuristics (US national rule-of-thumb). Get contractor quotes + a written scope before underwriting a rehab budget.
Schools (NCES district)
- District
- Cambridge
- NCES district ID
- 2503270
- Math proficiency
- 42% ▼ -12.00%
- Reading proficiency
- 59% ▼ -1.00%
- Median HH income
- $76,444
- Composite
- 45.66/100
- National rank
- #2580
- State rank
- #117 of 302 in MA
Livability — Cambridge
- Score
- 84/100
- State rank
- #15
- US rank
- #654
Category grades
Schools grade is shown separately in the Schools card above.
Census & demographics
- Census place
- Cambridge, MA
- City population
- 119,000
- Population (ZIP)
- 5,024
Population outlook (Middlesex County) Hauer SSP2
- Today (2025)
- 1,740,269 people
- By 2030
- 1,817,187 · +4.4%
- By 2040
- 1,963,195 · +12.8%
- By 2050
- 2,087,461 · +20.0%
- By 2075
- 2,344,036 · +34.7%
- By 2100
- 2,383,776 · +37.0%
Race, ethnicity, and origin ACS 2023
- Neighborhood character
- Predominantly White (91%)
- Race & ethnicity
- White 91% Hispanic / Latino 6% Two or more races 2%
- Hispanic origin (detail)
- Common ancestry
- Romanian 5% Lithuanian 5% Slovak 4%
- Foreign-born
- 10% · Canada
- Languages at home
- 92% English-only · Spanish 5% French/Haitian/Cajun 1% Other Asian/Pacific 1%
Political lean MEDSL · Middlesex
- 2024 margin
- Solid D (+39.5) · D 68.5% · R 29.0% · Other 2.5%
- 2008→2024 swing
- +9.3pp toward D · 2008: 30.1pp · 2024: 39.5pp
- All cycles
- 2024: D+39.5 2020: D+45.2 2016: D+38.1 2012: D+26.9 2008: D+30.1
Not yet ingested
- Civics
- —
Market trends
- HPI YoY
- ▲ 1.71%
- Current HPI
- 272.511
- Rent YoY
- —
- Metro
- —
- State GDP YoY
- ▲ 2.28%
- F500 in state
- 38
Industry mix (Fortune 500 HQ in MA)
| Industry | F500 HQs | Revenue |
|---|---|---|
| Technology | 3 | $17B |
|
||
| Insurance | 2 | $84B |
|
||
| Retail | 2 | $76B |
|
||
| Life Sciences | 1 | $43B |
|
||
| Energy Technology | 1 | $31B |
|
||
| Aerospace / Defense | 1 | $18B |
|
||
Price history
-16.7% since first listed7 events — show timeline
- 2026-06-11 Relisted — MLS PIN
- 2026-06-11 Price Changed $379,000 MLS PIN
- 2026-06-10 Contingent — MLS PIN
- 2026-06-09 Relisted — MLS PIN
- 2026-06-04 Contingent — MLS PIN
- 2026-05-20 Price Changed $399,000 MLS PIN
- 2026-05-07 Listed $455,000 MLS PIN
Cash-flow waterfall
monthlySold comps — $/sqft
last 12 mo · ≤1 miLoading sold comps…