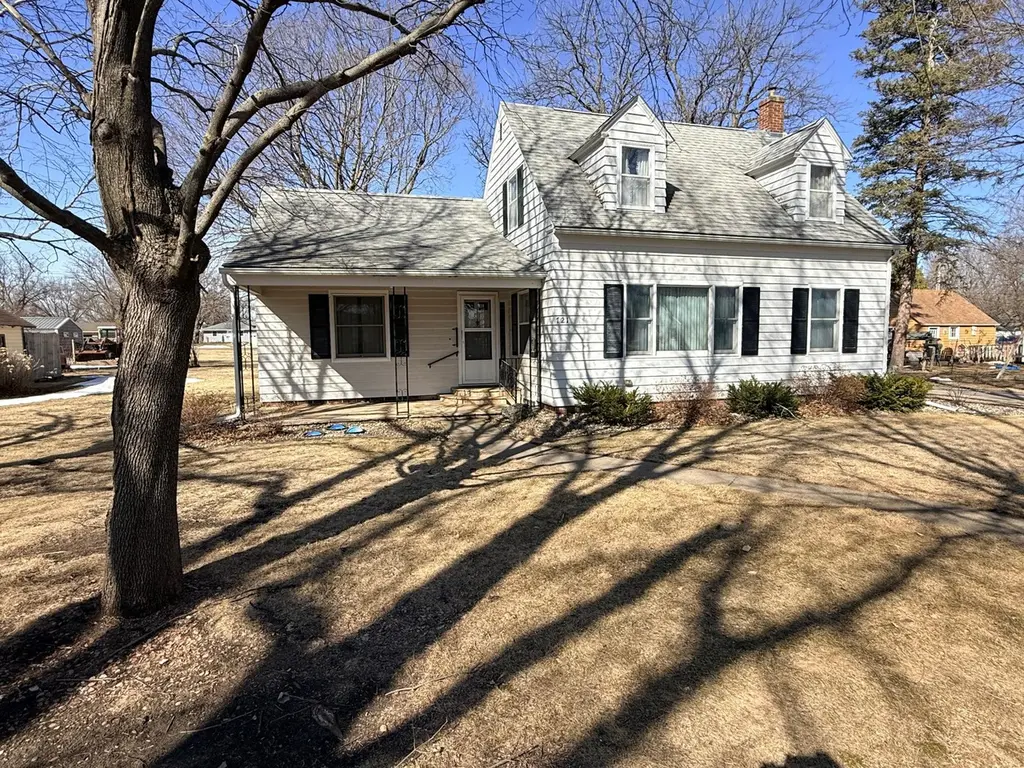
721 7th St · Walnut Grove, MN
Flood risk No data
- FEMA flood zone
- —
- Chance of flooding over 30 yrs
- —
- Est. flood insurance / yr
- —
Fire risk No data
- Est. fire insurance / yr
- —
Heat risk No data
- Hot days now (above threshold)
- —
- Hot days in 30 yrs
- —
Wind risk No data
- Chance of severe wind over 30 yrs
- —
Air-quality risk No data
- Unhealthy air days now
- —
- Unhealthy air days in 30 yrs
- —
Risk factors via First Street. Map © Google.
Why this score? — see what drove the B+ grade
The composite is a weighted blend of 9 inputs, each scored 0–100. Each bar is that input's sub-score; the figure is the points it added to the 100-point composite (weight × sub-score).
- Cash flow +30.0/30.0
- DSCR +10.0/10.0
- 1% rule +9.9/10.0
- Appreciation +7.6/10.0
- ARV discount +7.5/15.0
- Livability +4.0/5.0
- Schools +3.6/10.0
- Rent growth +2.5/5.0
- Condition / age +2.5/5.0
$95,000
🖨 Deal sheet (PDF) 📄 Offer letter ✓ Due diligence
Listing remarks
Look at this 3 bedroom 2 bath home with main floor laundry with lots of great features. Blocks from both parks and the School.
Key facts
- 0.34 acre lot
- Garage
- Built 1939
Property features AI
Exterior
- Parking: Detached or attached garage not specified, 1-car garage; Garage approximately 12 x 20 with 7-ft door
- Utilities: City water connected; City sewer connected; Natural gas; Electric service with circuit breakers (Redwood Electric Cooperative)
- Home design: Residential property; One and one-half levels; Shingle roof (age 8 years or less)
- Construction: Block foundation; Building area total approximately 3,224 sq ft; Above-grade finished area approximately 2,054; Below-grade finished area approximately 300; Main level finished area approximately 1,638
- Exterior features: Wood exterior; 100 x 150 lot dimensions; Lot size about 0.344 acres; Publicly maintained road access
Interior
- Kitchen: Range; Refrigerator; Dishwasher not listed
- Bedrooms: 4 bedrooms
- Bathrooms: 2 full bathrooms (main floor and upper level)
- Heating & cooling: Forced air heating; Central air conditioning
- Interior features: Informal dining room; Block foundation in basement; Crawl space basement
- Laundry & utility: Washer and dryer; Laundry located on main level
Neighborhood map
What this means for you Summary
Snapshot
- This is a 4-bed/2.0-bath single-family listed at $95k.
Deal economics
- At list price, monthly cash flow is $486 ($6k/yr) — positive.
- The deal already cash-flows at list — no discount required.
- Meets the 1% rule at list price ($1k rent vs $95k).
- Recommended offer: $89k (6.0% below list) — sets the bar for market timing.
Location & tenants
- Location reads 80/100 on livability (#66 in MN, #1,651 nationally) — a professional / high-income tenant draw. Strengths: crime A+, cost of living A+, housing A+; Watch: schools C-, amenities F, commute F.
- Westbrook-Walnut Grove Schools (rural): math 42% / reading 42% proficiency, ranked #213 of 301 in MN (top 71%) — families likely to look elsewhere, expect single-tenant / working-renter base with shorter leases.
- Market conditions: 11 active listings in the ZIP; 25 units permitted in Redwood County in 2024 (0 in 5+ unit buildings).
Forward outlook
- In year one you build about $6k of equity ($657 loan paydown + $5k appreciation (5.2% local appreciation)).
- Redwood County population projected at -16% by 2050 — secular population decline; favor cash flow + early exit over multi-decade hold.
- At projected returns (5.2% appreciation + 3.0% rent growth), your $27k cash investment doubles in ~3 years — after that, you're playing with house money.
- By year 6, paydown + projected appreciation supports a ~$30k cash-out refi (75% LTV) — recoverable capital for the next deal without selling this one.
Negotiation context
- It's been on market 68 days — a 6% lower offer ($89k) is reasonable based on typical stale-listing flexibility.
- 2 sale attempts with the ask held roughly flat each time — persistent listings suggest the price (not the market) is what's stuck; bring a comps-based counter.
Risks & watch-outs
- Watch-outs: built in 1939 — expect roof / HVAC / electrical / plumbing capex.
Questions for the listing agent
- It's been on market 68 days. Have you received any prior offers? Is the seller open to a 6% concession, seller financing, or rate buy-down credit?
- Built in 1939 — when were the roof, HVAC, electrical panel, plumbing, and water heater last replaced?
- Why hasn't it sold? Are there any deal-killer items the seller is aware of (foundation, flood, title, zoning, code violations)?
- Is there a deadline driving the sale (1031 exchange, divorce, estate, relocation)? That informs how much negotiation room exists.
- What's the average days-on-market for RENTAL listings here right now (not sales)? A rising rental-DOM trend means longer vacancies and softer asking-rent achievability than the comps imply.
- What's the recent tenant-quality profile in this submarket — average credit score on applications, eviction rate, late-payment / NSF rate, and stable-employment percentage? A property-management company in the area should have these aggregated.
- How much new for-sale + rental construction is in the pipeline within 1–3 miles? Heavy new supply typically softens prices + rents 12–24 months out; constrained supply supports both.
Investment metrics
- 1% rule
- 1.49% ✓
- Cap rate
- 12.43%
- Cash-on-cash
- 21.92%
- DSCR
- 1.98
- GRM
- 5.6
CMA / ARV
No comps found within radius.
Projected returns pro-forma
5.23% appreciation · 3.0% rent growth · sell at horizon
- IRR
- 32.4%
- Equity multiple
- 3.03×
- Total profit
- $54,092
- Equity at exit
- $55,166
- IRR
- 30.7%
- Equity multiple
- 6.12×
- Total profit
- $136,228
- Equity at exit
- $96,327
Cash invested: $26,600 (down + closing). Projections, not guarantees.
Landlord ↔ Tenant lean methodology
- Overall (STATE)
- 46 Balanced
- State Minnesota
- 46 Balanced · D+2
- County
- — inherits STATE
- City
- — inherits STATE
ZIP-level market 56180
- Home prices YoY
- 2.5%
- Active inventory
- 11
- Price-to-rent
- 5.6×
Monthly cashflow live
- Estimated rent
- $1,412 medium interval (Pro) →
- Mortgage (P&I)
- −$498
- Tax from tax record
- −$92 /mo · $1,100/yr
- Insurance
- −$40
- HOA
- −$0
- Vacancy / Maint / Mgmt
- −$296
- Net cashflow
- $486
Break-even live
Sensitivity live
| Price | -10% $540 | -5% $513 | +0% $486 | +5% $459 | +10% $432 |
|---|---|---|---|---|---|
| Rent | -10% $374 | -5% $430 | +0% $486 | +5% $542 | +10% $597 |
| Rate | -1.0pp $534 | -0.5pp $510 | base $486 | +0.5pp $461 | +1.0pp $436 |
UW: 25.0% down · 7.5% · 30yr · 1.5% tax · 5.0% vac · 8.0% maint · 8.0% mgmt
Financing live
Cash to close
- Down payment
- $23,750
- Closing costs
- $2,850
- Reserves months
- —
- Total cash needed
- —
Loan-product check · same deal, 3 products live
Conventional
25% down · 7.5% · 30yr
- Down + closing
- —
- Monthly P&I
- —
- Monthly cashflow
- —
- DSCR
- —
- Eligible?
- —
Personal DTI + credit; lowest rate.
DSCR
20% down · 8.5% · 30yr
- Down + closing
- —
- Monthly P&I
- —
- Monthly cashflow
- —
- DSCR
- —
- Eligible?
- —
No personal income docs; deal must DSCR.
Hard money
10% down · 12.0% · 12mo
- Down + closing
- —
- Monthly P&I
- —
- Monthly cashflow
- —
- DSCR
- —
- Eligible?
- —
Short-term bridge; refi at stabilization.
Listing history 14 events
-
2026-06-12statusdays on market $95,000 Pending 68 DOM
-
2026-06-09days on market $95,000 Contingent - Subject to Financing 67 DOM
-
2026-06-08days on market $95,000 Contingent - Subject to Financing 66 DOM
-
2026-06-07days on market $95,000 Contingent - Subject to Financing 65 DOM
-
2026-06-07days on market $95,000 Contingent - Subject to Financing 64 DOM
-
2026-06-04days on market $95,000 Contingent - Subject to Financing 61 DOM
-
2026-06-02days on market $95,000 Contingent - Subject to Financing 60 DOM
-
2026-06-01days on market $95,000 Contingent - Subject to Financing 59 DOM
-
2026-05-31days on market $95,000 Contingent - Subject to Financing 58 DOM
-
2026-05-31days on market $95,000 Contingent - Subject to Financing 57 DOM
-
2026-04-09historical Contingent - Subject to Financing
-
2026-04-06status Active
-
2026-04-03historical Contingent - Subject to Financing
-
2026-04-03$95,000 Active
ⓘ Source: listings_history table (triggers on properties + properties_extension) + one-shot
backfill from property_details.listing_events for pre-trigger history.
Tax reassessment forecast MN · Partial reset (capped growth)
- Current annual tax
- $1,100 · $92/mo
- Projected year-2 tax
- $1,100 · $92/mo
- Expected delta
- $0/yr ($0/mo · 0.0%)
ⓘ Screening estimate from a state-policy table — verify with the county assessor before closing.
Nearby sold comps map
Loading sold comps map…
Walkable amenities ~0.75 mi
Loading nearby amenities…
Taxation est. · year 1
- Rental income
- $16,940
- − Mortgage interest
- −$5,321
- − Property taxes
- −$1,100
- − Insurance
- −$475
- − Repairs & maintenance
- −$1,355
- − Management
- −$1,355
- − Depreciation
- −$2,764
- Taxable income
- $4,570
- Est. tax owed @ 24.0%
- −$1,097
- After-tax cash flow
- $4,733/yr
For passive investors: Depreciation is non-cash, so a rental often shows a tax loss while cash-flowing — sheltering income. Rental losses are passive: they offset passive income freely, and up to $25,000/yr can offset ordinary (W-2) income if you actively participate and your MAGI is under $100k (phasing out to $0 by $150k); unused losses carry forward. On sale, claimed depreciation is recaptured at up to 25%, and gains may owe capital-gains tax (a 1031 exchange can defer both). Figures are a year-1 estimate at your 24.0% rate — not tax advice; consult a CPA.
Schools (NCES district)
- District
- Westbrook-Walnut Grove Schools
- NCES district ID
- 2700183
- Math proficiency
- 42% ▼ -13.00%
- Reading proficiency
- 42% ▼ -8.00%
- Median HH income
- $43,672
- Composite
- 35.55/100
- National rank
- #4906
- State rank
- #213 of 301 in MN
Livability — Walnut Grove
- Score
- 80/100
- State rank
- #66
- US rank
- #1651
Category grades
Schools grade is shown separately in the Schools card above.
Census & demographics
- Census place
- Walnut Grove, MN
- Population (ZIP)
- 1,203
Population outlook (Redwood County) Hauer SSP2
- Today (2025)
- 14,504 people
- By 2030
- 13,983 · -3.6%
- By 2040
- 13,056 · -10.0%
- By 2050
- 12,225 · -15.7%
- By 2075
- 11,051 · -23.8%
- By 2100
- 9,786 · -32.5%
Race, ethnicity, and origin ACS 2023
- Neighborhood character
- Diverse neighborhood (Simpson 0.56)
- Race & ethnicity
- White 59% Asian 29% Two or more races 9% Hispanic / Latino 4% Native American 3%
- Common ancestry
- Portuguese 14% English 4% Scottish 2%
- Foreign-born
- 17% · Philippines, Canada
- Languages at home
- 74% English-only · Other Asian/Pacific 22% Spanish 3%
Political lean MEDSL · Redwood
- 2024 margin
- Solid R (+43.3) · D 27.7% · R 71.0% · Other 1.2%
- 2008→2024 swing
- -29.8pp toward R · 2008: -13.6pp · 2024: -43.3pp
- All cycles
- 2024: R+43.3 2020: R+41.2 2016: R+43.0 2012: R+20.1 2008: R+13.6
Not yet ingested
- Civics
- —
Market trends
- HPI YoY
- ▲ 5.23%
- Current HPI
- 210.5411
- Rent YoY
- —
- Metro
- —
- State GDP YoY
- ▲ 2.41%
- F500 in state
- 34
Industry mix (Fortune 500 HQ in MN)
| Industry | F500 HQs | Revenue |
|---|---|---|
| Healthcare | 2 | $407B |
|
||
| Retail | 2 | $150B |
|
||
| Consumer Goods | 2 | $32B |
|
||
| Industrial Machinery | 2 | $6B |
|
||
| Agriculture | 1 | $40B |
|
||
| Healthcare / Medical Devices | 1 | $32B |
|
||
Price history
4 events — show timeline
- 2026-04-09 Contingent — NORTHSTARMLS as Distributed by MLS Grid
- 2026-04-06 Relisted — NORTHSTARMLS as Distributed by MLS Grid
- 2026-04-03 Contingent — NORTHSTARMLS as Distributed by MLS Grid
- 2026-04-03 Listed $95,000 NORTHSTARMLS as Distributed by MLS Grid
Property tax history
+6.5%/yrLatest (2025): $1,100 · +21.7% YoY. Source: county tax records.
Cash-flow waterfall
monthlySold comps — $/sqft
last 12 mo · ≤1 miLoading sold comps…