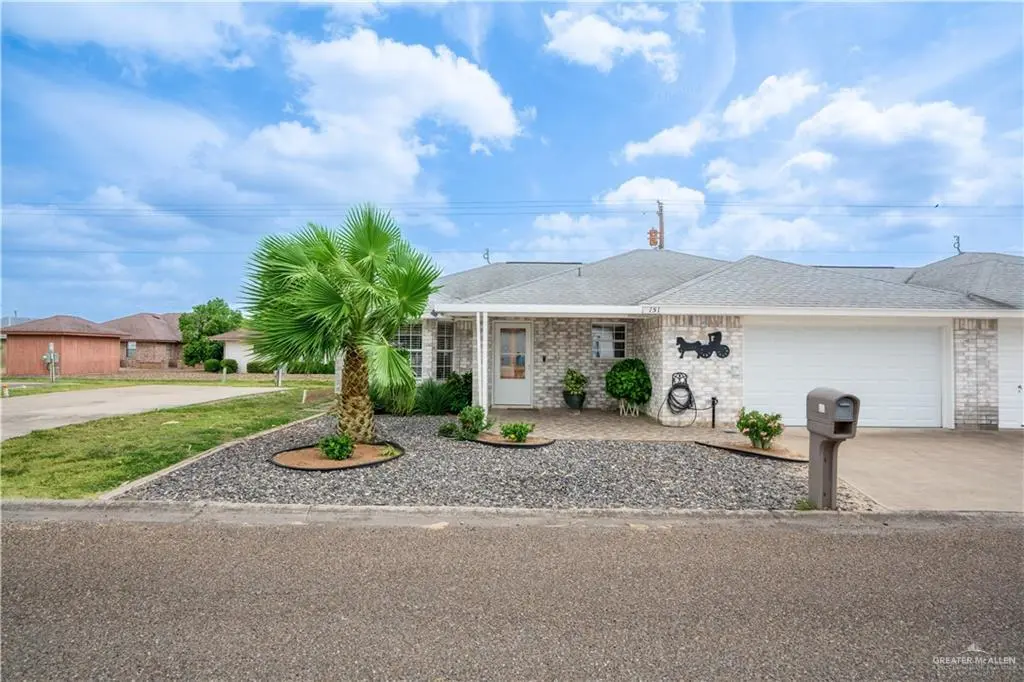
151 Tulip St · Perezville, TX
Flood risk 1/10 · Minimal
- FEMA flood zone
- X
- Chance of flooding over 30 yrs
- 0.0%
- Est. flood insurance / yr
- $507 – $1,088
Fire risk 8/10 · Major
- Est. fire insurance / yr
- $1,222 – $2,270
Heat risk 9/10 · Severe
- Hot days now (above 112°F)
- 7 days/yr
- Hot days in 30 yrs
- 23 days/yr
Wind risk 8/10 · Major
- Chance of severe wind over 30 yrs
- 94.0%
Air-quality risk 1/10 · Minimal
- Unhealthy air days now
- 0 days/yr
- Unhealthy air days in 30 yrs
- 0 days/yr
Risk factors via First Street. Map © Google.
Why this score? — see what drove the D grade
The composite is a weighted blend of 9 inputs, each scored 0–100. Each bar is that input's sub-score; the figure is the points it added to the 100-point composite (weight × sub-score).
- ARV discount +14.0/15.0
- Cash flow +9.9/30.0
- 1% rule +3.3/10.0
- Livability +3.2/5.0
- DSCR +2.8/10.0
- Condition / age +2.8/5.0
- Rent growth +2.5/5.0
- Schools +1.9/10.0
- Appreciation +0.0/10.0
$149,900
🖨 Deal sheet 📄 Offer letter ✓ Due diligence
Listing remarks
Enjoy easy, low-maintenance living in this beautifully maintained 2-bedroom, 2-bathroom 1 office home located in a welcoming 55+ community with resort-style amenities. The bright and open layout features a spacious living area, functional kitchen, and a cozy sunroom perfect for relaxing or enjoying your morning coffee. Step outside to a private patio, ideal for outdoor dining, gardening, or simply soaking up the sun. The primary suite offers a private bath and ample closet space, while the second bedroom is perfect for guests or hobbies. The one-car garage includes extra space for a golf cart, offering added convenience for getting around the community or heading to nearby golf courses. En
Key facts
- Fitness center
- Clubhouse
- Swimming pool
Tags
Property features AI
Finance
- HOA & community: Pleasant Valley Ranch homeowners association; Annual association fee of $455; Community amenities include clubhouse, golf, pool, and sidewalks; Mandatory POA; Senior community
Exterior
- Parking: Attached garage facing front; 1 covered/garage space (total 1 parking space)
- Utilities: MUD sewer; Electric water heater
- Home design: Brick construction; Wood shingle/shake roof; Slab foundation
- Construction: Brick exterior; Slab foundation; Wood shingle/shake roof
- Exterior features: Mature trees; Rock yard; Patio; Paved road access
Interior
- Kitchen: Electric cooktop; Refrigerator; Microwave
- Bedrooms: Living areas: 2
- Flooring: Marble; Tile; Vinyl
- Bathrooms: 2 full bathrooms
- Heating & cooling: Central heating; Central air conditioning
- Interior features: Laminate countertops; Bonus room; Ceiling fans; Microwave; Double-pane and storm windows; Custom drapes and vertical blinds
- Laundry & utility: Laundry area with washer/dryer connection; Electric water heater
Neighborhood map
What this means for you Summary
Snapshot
- This is a 2-bed/2.0-bath single-family listed at $150k. Condition is rated average.
Deal economics
- At list price, monthly cash flow is $-94 ($-1k/yr) — negative.
- To cash-flow at today's rent, offer at most $136k (9.1% below list).
- To meet the 1% rule (rent ≥ 1% of price), the offer needs to be $124k (17.2% below list).
- Recommended offer: $124k (17.2% below list) — sets the bar for 1% rule.
Location & tenants
- Location reads 64/100 on livability (#743 in TX) — a middle-class / working-renter tenant base. Strengths: cost of living A+, housing A+, crime A-; Watch: amenities F, commute F, health & safety F.
- La Joya ISD (suburban): math 18% / reading 29% proficiency, ranked #759 of 826 in TX (top 92%) — low school quality limits family demand, transient renter base, plan for 1-2y turnover.
- Zoned schools: Henry B Gonzalez El (math 17% / reading 27%, grade F, #3,333 of 4,322 statewide, top 80%, 490 students, 91% FRL); Ann Richards Middle (math 21% / reading 30%, grade F, #1,236 of 1,662 statewide, top 76%, 729 students, 96% FRL); La Joya H S (math 16% / reading 32%, grade F, #1,333 of 1,632 statewide, top 82%, 2,775 students, 92% FRL) — zoned schools average 93% FRL vs 54% district-wide (40 pts higher); higher-poverty schools than district average — tighter screening recommended.
- Market conditions: 474 active listings in the ZIP; 11 comparable units currently listed for rent nearby; rentals lingering (median 44d on market — plan ~5-8 weeks vacancy on turnover, expect pricing pressure); 55% of comp listings sitting > 30 days — soft ceiling on asking rent; 7,378 units permitted in Hidalgo County in 2024 (641 in 5+ unit buildings).
Forward outlook
- Local home prices are declining (-3.0%/yr); year-one equity from $1k of loan paydown is wiped out by about $4k of value loss. Plan a longer hold.
- Hidalgo County population projected at +28% by 2050 — long-run rental-demand tailwind backs the buy-and-hold thesis.
Negotiation context
- It's been on market 36 days — a 3% lower offer ($145k) is reasonable based on typical stale-listing flexibility.
- 3 sale attempts with the ask held roughly flat each time — persistent listings suggest the price (not the market) is what's stuck; bring a comps-based counter.
Risks & watch-outs
- Climate carrying-cost: severe wind risk, 94% chance of damaging wind over 30y; severe wildfire risk; extreme-heat days projected 7→23/yr by 2055 (HVAC capex compounding) — expect insurance premiums to compound above CPI over the hold.
Questions for the listing agent
- What do current leases actually rent for vs. the listed asking? Can we see a recent rent roll and the last 12 months of T-12 income?
- It's been on market 36 days. Have you received any prior offers? Is the seller open to a 17% concession, seller financing, or rate buy-down credit?
- What does the HOA fee cover, when was the last increase, and are there any pending special assessments or reserve-fund shortfalls?
- Is there a deadline driving the sale (1031 exchange, divorce, estate, relocation)? That informs how much negotiation room exists.
- Schools are F-rated, which usually means shorter tenancies and higher turnover. Who's the typical renter profile here, and what's been the actual vacancy rate?
- The area grade is low — what's the realistic commute time and amenity access for the typical tenant pool here? Any planned neighborhood developments (good or bad) we should know about?
- What's the average days-on-market for RENTAL listings here right now (not sales)? A rising rental-DOM trend means longer vacancies and softer asking-rent achievability than the comps imply.
- What's the recent tenant-quality profile in this submarket — average credit score on applications, eviction rate, late-payment / NSF rate, and stable-employment percentage? A property-management company in the area should have these aggregated.
- How much new for-sale + rental construction is in the pipeline within 1–3 miles? Heavy new supply typically softens prices + rents 12–24 months out; constrained supply supports both.
Investment metrics
- 1% rule
- 0.83% ✗
- Cap rate
- 5.54%
- Cash-on-cash
- -2.68%
- DSCR
- 0.88
- GRM
- 10.1
CMA / ARV
- ARV (median comp)
- $175,000
- List price
- $149,900
- Delta
- -14.34%
- Verdict
- UNDERPRICED
- Comps
- 20 within 1.0 mi
Show comp detail 12 sales within ~0.75 mi
| Address | Dist | Beds/Ba | Sqft | Sold | Price | $/sf | Match |
|---|---|---|---|---|---|---|---|
| 1906 Wilson St | 0.17mi | 2/2.0 | 1,222 (-4%) | 4mo | $169,900 | $139 | 81 |
| 1810 Tyler St | 0.11mi | 2/2.0 | 1,186 (-7%) | 3mo | $175,000 | $148 | 81 |
| 1909 Tyler St | 0.19mi | 2/2.0 | 1,143 (-11%) | 3mo | $154,900 | $136 | 71 |
| 7412 Golf Dr | 0.36mi | 2/2.0 | 1,347 (+5%) | 4mo | $220,000 | $163 | 71 |
| 7301 Monroe St | 0.10mi | 2/2.0 | 1,461 (+14%) | 2mo | $185,000 | $127 | 70 |
| 7207 Monroe St | 0.23mi | 2/2.0 | 1,425 (+12%) | 1mo | $159,900 | $112 | 69 |
| 7422 Golf Dr | 0.39mi | 2/2.0 | 1,377 (+8%) | 4mo | $195,000 | $142 | 66 |
| 7310 Ford St | 0.24mi | 2/2.0 | 1,450 (+14%) | 1mo | $189,900 | $131 | 65 |
| 7822 Arrow Point St | 0.57mi | 3/1.5 (+1) | 1,289 (+1%) | 4mo | $82,446 | $64 | 62 |
| 204 Silverado Dr E | 0.39mi | 3/2.0 (+1) | 1,180 (-8%) | 6mo | $150,000 | $127 | 59 |
| 3508 Jordyn Dr | 0.67mi | 3/2.0 (+1) | 1,200 (-6%) | 5mo | $209,000 | $174 | 50 |
| 7607 Wagon Trail Dr | 0.66mi | 3/2.0 (+1) | 1,389 (+9%) | 5mo | $200,000 | $144 | 46 |
Match score weights: distance 35% · size 25% · config 20% · recency 20%. Top-matched comps best support the ARV.
Projected returns pro-forma
-3.0% appreciation · 3.0% rent growth · sell at horizon
- IRR
- -20.7%
- Equity multiple
- 0.28×
- Total profit
- $-30,226
- Equity at exit
- $22,351
- IRR
- -13.9%
- Equity multiple
- 0.19×
- Total profit
- $-33,847
- Equity at exit
- $12,961
Cash invested: $41,972 (down + closing). Projections, not guarantees.
Landlord ↔ Tenant lean methodology
- Overall (STATE)
- 87 Strongly Landlord-Friendly
- State Texas
- 87 Strongly Landlord-Friendly · R+5
- County
- — inherits STATE
- City
- — inherits STATE
ZIP-level market 78574
- Home prices YoY
- -16.1%
- Active inventory
- 474
- Price-to-rent
- 10.1×
Monthly cashflow live
- Estimated rent
- $1,241 high interval (Pro) →
- Mortgage (P&I)
- −$786
- Tax est. 1.5%
- −$187 /mo · $2,248/yr
- Insurance
- −$62
- HOA
- −$38
- Vacancy / Maint / Mgmt
- −$261
- Net cashflow
- $-94
Break-even live
UW: 25.0% down · 7.5% · 30yr · 1.5% tax · 5.0% vac · 8.0% maint · 8.0% mgmt
Financing live
Cash to close
- Down payment
- $37,475
- Closing costs
- $4,497
- Reserves months
- —
- Total cash needed
- —
Loan-product check · same deal, 3 products live
Conventional
25% down · 7.5% · 30yr
- Down + closing
- —
- Monthly P&I
- —
- Monthly cashflow
- —
- DSCR
- —
- Eligible?
- —
Personal DTI + credit; lowest rate.
DSCR
20% down · 8.5% · 30yr
- Down + closing
- —
- Monthly P&I
- —
- Monthly cashflow
- —
- DSCR
- —
- Eligible?
- —
No personal income docs; deal must DSCR.
Hard money
10% down · 12.0% · 12mo
- Down + closing
- —
- Monthly P&I
- —
- Monthly cashflow
- —
- DSCR
- —
- Eligible?
- —
Short-term bridge; refi at stabilization.
Rent comps 11 comps
| Address | Beds | Baths | Sqft | Rent | $/sqft | DOM | Units | Dist |
|---|---|---|---|---|---|---|---|---|
| 7220 W Interstate Highway 2 Fl STW 4 WITH PORCH) FRONT UNIT Mission, TX | 2.0 | 2.0 | 1104 | $1,150 | $1.04 | 44d | 1 | 0.21mi |
| 7220 W Interstate Highway 2 Fl STW 3 WITH NO BALCONY) Mission, TX | 1.0 | 1.0 | 945 | $895 | $0.95 | 19d | 1 | 0.21mi |
| 7220 W Interstate Highway 2 Unit 15 Mission, TX | 1.0 | 1.0 | 945 | $925 | $0.98 | 44d | 1 | 0.21mi |
| 7220 W Interstate Highway 2 Fl STW 1 WITH BALCONY) FRONT UNIT Mission, TX | 1.0 | 1.0 | 945 | $895 | $0.95 | 44d | 1 | 0.21mi |
| 7220 W Interstate Highway 2 Unit 12 Mission, TX | 2.0 | 2.0 | 1104 | $995 | $0.90 | 21d | 1 | 0.21mi |
| 7220 W Interstate Highway 2 Unit 20 Mission, TX | 2.0 | 2.0 | 1104 | $995 | $0.90 | 44d | 1 | 0.21mi |
| 1908 Kennedy St Mission, TX | 2.0 | 2.0 | 1062 | $1,300 | $1.22 | 23d | 1 | 0.25mi |
| 3717 Clavel St Unit 8 Palmview, TX | 2.0 | 1.0 | 1005 | $800 | $0.80 | 44d | 1 | 0.39mi |
| 3711 Chapa AVE Palmview, TX | 2.0 | 2.0 | 995 | $1,150 | $1.16 | 14d | 1 | 0.49mi |
| 3711 Chapa AVE Palmview, TX | 3.0 | 2.0 | 1050 | $1,300 | $1.24 | 44d | 1 | 0.49mi |
| 1905 Tierra Linda Cir W Mission, TX | 3.0 | 2.0 | 1344 | $2,000 | $1.49 | 14d | 1 | 1.33mi |
HOA detail
- Monthly dues
- $38 · $456/yr
Listing history 21 events
-
2026-06-18days on market $149,900 Active 36 DOM
-
2026-06-17days on market $149,900 Active 35 DOM
-
2026-06-16days on market $149,900 Active 34 DOM
-
2026-06-15days on market $149,900 Active 33 DOM
-
2026-06-14days on market $149,900 Active 31 DOM
-
2026-06-13days on market $149,900 Active 30 DOM
-
2026-06-10days on market $149,900 Active 28 DOM
-
2026-06-09days on market $149,900 Active 27 DOM
-
2026-06-08days on market $149,900 Active 26 DOM
-
2026-06-07days on market $149,900 Active 25 DOM
-
2026-06-05days on market $149,900 Active 22 DOM
-
2026-06-03days on market $149,900 Active 21 DOM
-
2026-06-03price $149,900 Active 20 DOM
-
2026-06-02days on market $155,000 Active 20 DOM
-
2026-06-01days on market $155,000 Active 19 DOM
-
2026-05-31days on market $155,000 Active 18 DOM
-
2026-05-31days on market $155,000 Active 17 DOM
-
2026-05-13$155,000 Active 969-char remark
-
2025-12-10status Active
-
2025-12-04status Pending
-
2025-08-20$155,000 Active
ⓘ Source: listings_history table (triggers on properties + properties_extension) + one-shot
backfill from property_details.listing_events for pre-trigger history.
Climate risk First Street
- Flood 1/10 Low FEMA zone X · 0% chance over 30 yrs
- Wildfire 8/10 Severe
- Heat 9/10 Extreme 7 d/yr ≥112°F today · 23 d/yr by 30 yrs out
- Wind 8/10 Severe 94% chance of damaging wind over 30 yrs
- Air quality 1/10 Low 0 unhealthy d/yr today · 0 by 30 yrs out
Nearby sold comps map
Loading sold comps map…
Walkable amenities ~0.75 mi
Loading nearby amenities…
Taxation est. · year 1
- Rental income
- $14,887
- − Mortgage interest
- −$8,397
- − Property taxes
- −$2,248
- − Insurance
- −$750
- − Repairs & maintenance
- −$1,191
- − Management
- −$1,191
- − HOA
- −$456
- − Depreciation
- −$4,361
- Taxable loss
- −$3,706
- Est. tax savings @ 24.0%
- +$890
- After-tax cash flow
- $-237/yr
For passive investors: Depreciation is non-cash, so a rental often shows a tax loss while cash-flowing — sheltering income. Rental losses are passive: they offset passive income freely, and up to $25,000/yr can offset ordinary (W-2) income if you actively participate and your MAGI is under $100k (phasing out to $0 by $150k); unused losses carry forward. On sale, claimed depreciation is recaptured at up to 25%, and gains may owe capital-gains tax (a 1031 exchange can defer both). Figures are a year-1 estimate at your 24.0% rate — not tax advice; consult a CPA.
Condition & rehab AI · 12 photos
This home is in average condition with some cosmetic updates needed. It has a good layout and is located in a desirable community, making it a good investment opportunity.
Repairs flagged
- Minor kitchen cabinets — slight wear
- Minor bathroom cabinets — slight wear
- Minor HVAC unit — visible and likely needs cleaning
Value-add opportunities
- Resale paint interior walls — fresh paint enhances curb appeal
- Resale replace kitchen cabinets — new cabinets improve functionality and aesthetics
- Resale replace bathroom cabinets — new cabinets improve functionality and aesthetics
- Both landscaping — improved landscaping enhances curb appeal and adds value
Renovation cost estimate screening
| Repair item | Severity | Est. cost |
|---|---|---|
| kitchen cabinets · slight wear | Minor | $500–3,000 |
| bathroom cabinets · slight wear | Minor | $500–3,000 |
| HVAC unit · visible and likely needs cleaning | Minor | $500–3,000 |
| Total estimated repair cost · 3 items | $1,500–9,000 |
Value-add ROI direction
- Resale paint interior walls — fresh paint enhances curb appeal ↑
- Resale replace kitchen cabinets — new cabinets improve functionality and aesthetics ↑
- Resale replace bathroom cabinets — new cabinets improve functionality and aesthetics ↑
- Both landscaping — improved landscaping enhances curb appeal and adds value ↑
ⓘ Cost ranges are severity-bucket heuristics (US national rule-of-thumb). Get contractor quotes + a written scope before underwriting a rehab budget.
Schools (NCES district)
- District
- La Joya ISD
- NCES district ID
- 4826130
- Math proficiency
- 18% ▼ -35.00%
- Reading proficiency
- 29% ▼ -10.00%
- Median HH income
- $27,845
- Composite
- 18.65/100
- National rank
- #8891
- State rank
- #759 of 826 in TX
Livability — Perezville
- Score
- 64/100
- State rank
- #743
- US rank
- #13748
Category grades
Schools grade is shown separately in the Schools card above.
Census & demographics
- Census place
- Perezville, TX
- County
- Hidalgo County · 623,128 people
- Metro
- McAllen-Edinburg-Mission, TX
- Population (ZIP)
- 62,456
- Household income
- $52,393
- Rent vs Own
- Severe rent burden
- 803.0
Population outlook (Hidalgo County) Hauer SSP2
- Today (2025)
- 955,232 people
- By 2030
- 1,009,774 · +5.7%
- By 2040
- 1,120,332 · +17.3%
- By 2050
- 1,225,036 · +28.2%
- By 2075
- 1,439,189 · +50.7%
- By 2100
- 1,533,429 · +60.5%
Race, ethnicity, and origin ACS 2023
- Neighborhood character
- Predominantly Hispanic (97%)
- Race & ethnicity
- Hispanic / Latino 97% Two or more races 62% White 2%
- Hispanic origin (detail)
- Mexican 93%
- Foreign-born
- 33% · Canada
- Languages at home
- 12% English-only · Spanish 87%
Political lean MEDSL · Hidalgo
- 2024 margin
- Toss-up / Even · D 48.1% · R 51.0%
- 2008→2024 swing
- -41.6pp toward R · 2008: 38.7pp · 2024: -2.9pp
- All cycles
- 2024: R+2.9 2020: D+17.1 2016: D+40.5 2012: D+41.8 2008: D+38.7
Not yet ingested
- Civics
- —
Market trends
- HPI YoY
- ▼ -44.13%
- Current HPI
- 230.3323
- Rent YoY
- —
- Metro
- McAllen-Edinburg-Mission, TX
- State GDP YoY
- ▲ 3.95%
- F500 in state
- 110
Industry mix (Fortune 500 HQ in TX)
| Industry | F500 HQs | Revenue |
|---|---|---|
| Energy | 16 | $1,198B |
|
||
| Technology | 5 | $198B |
|
||
| Engineering / Construction | 4 | $72B |
|
||
| Energy Services | 3 | $60B |
|
||
| Utilities | 3 | $41B |
|
||
| Healthcare | 2 | $330B |
|
||
Price history
-3.3% since first listed5 events — show timeline
- 2026-06-02 Price Changed $149,900 MCALLENMLS
- 2026-05-13 Listed $155,000 MCALLENMLS
- 2025-12-10 Relisted — MCALLENMLS
- 2025-12-04 Pending — MCALLENMLS
- 2025-08-20 Listed $155,000 MCALLENMLS
Cash-flow waterfall
monthlySold comps — $/sqft
last 12 mo · ≤1 miLoading sold comps…